April 28, 2025
Gold’s Bull Market Pullbacks
Author - Ben McGregor
Gold has significant weekly pullback for second time in a month
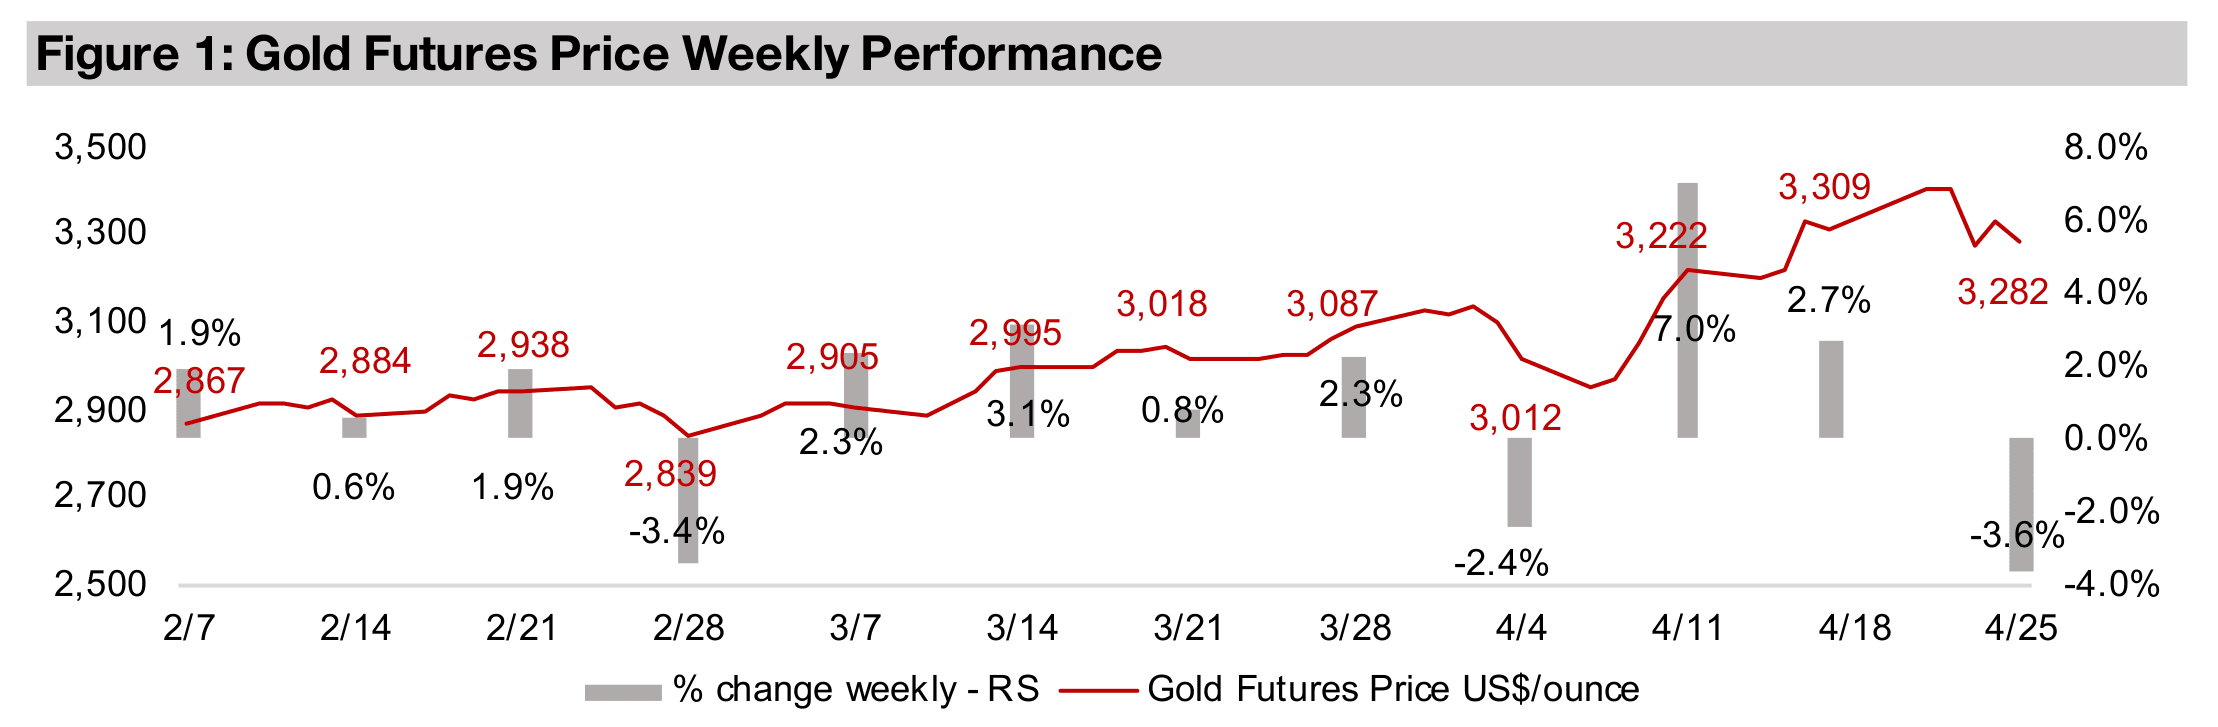
Gold declined -3.6% to US$3,282/oz, for the second reasonably large weekly decline in just a month, with such significant pullbacks typical of gold market bull runs, and the metal showing the early signs of having entered bubble territory.
Gold ETF inflows see massive March, central bank purchases light
Gold ETF inflows saw their highest monthly inflows in years in March 2025 as retail has piled into the metal trade, but central bank purchases in the first two months of the year were relatively light, suggesting they may be viewing current prices as high.
Gold stocks down on metal drop
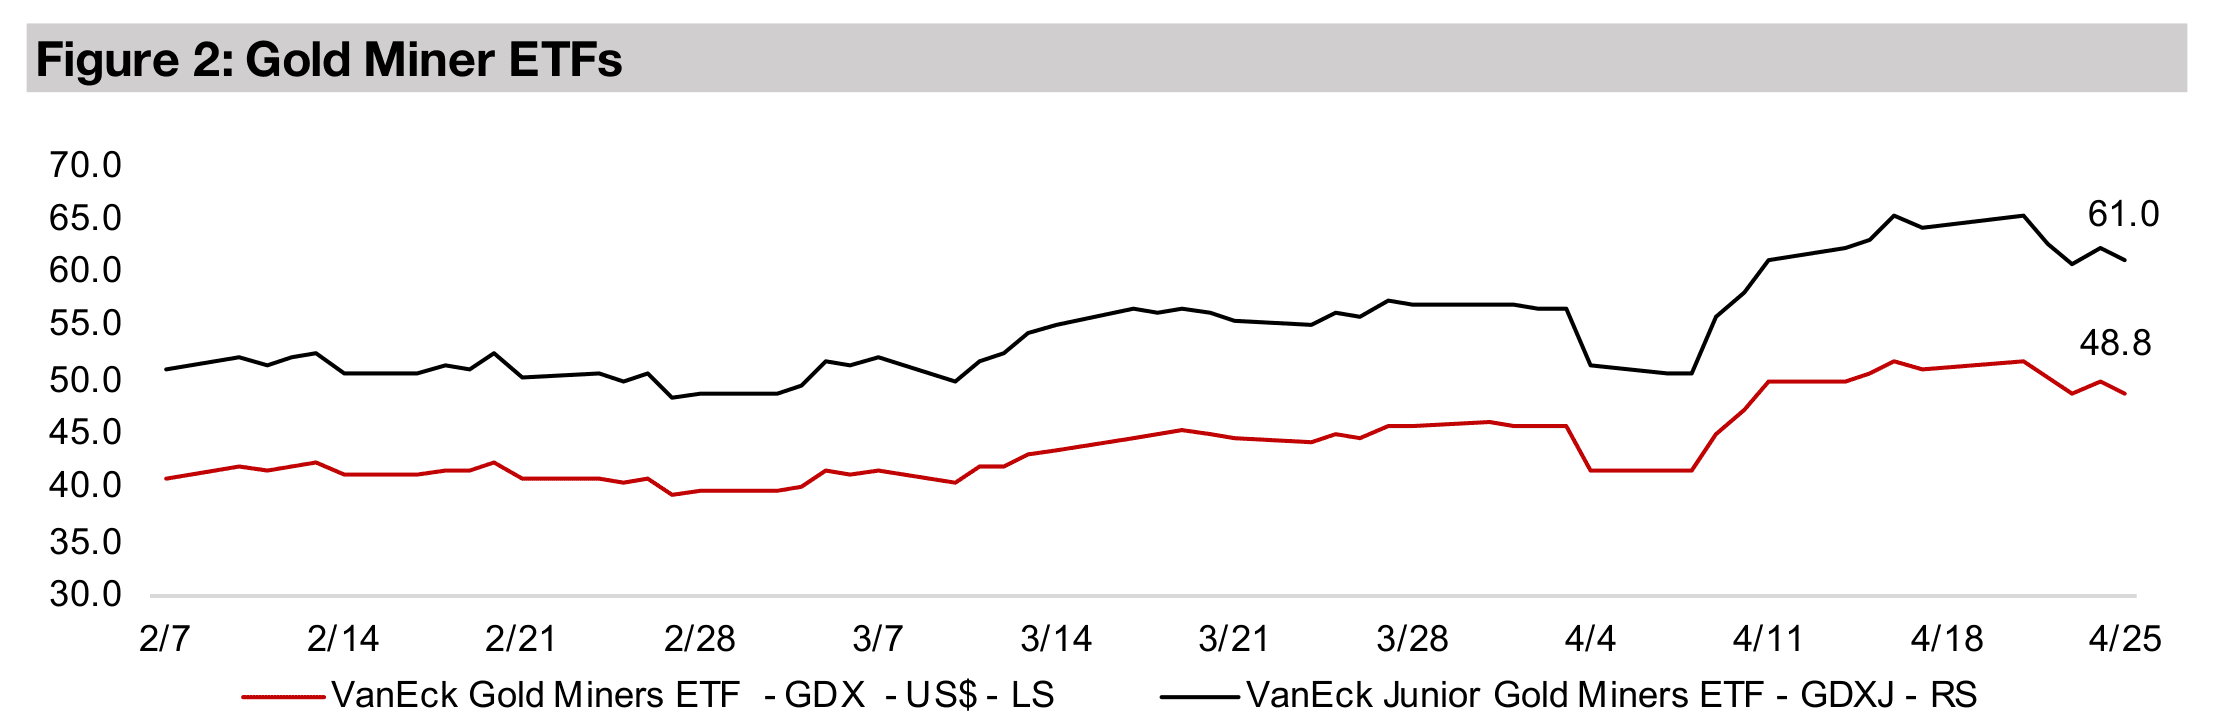
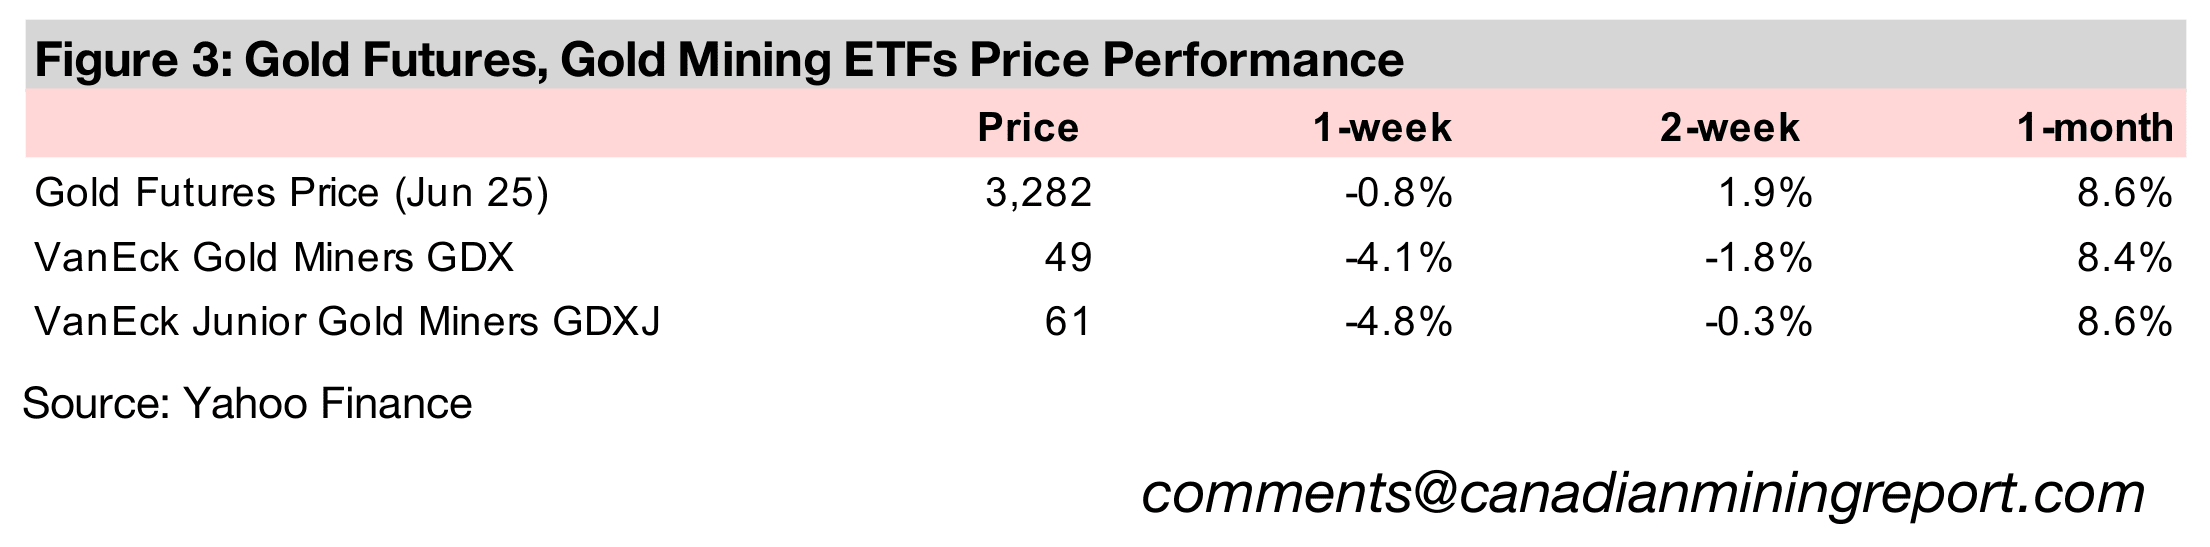
The gold stocks fell with the GDX down -4.1% and GDXJ off -4.8%, far underperforming the 5.6% increase in the S&P 500, 8.3% gain in the Nasdaq and 5.1% rise in the Russell 2000, with safe havens sold off in a major risk-on move.


Gold’s Bull Market Pullbacks
Gold declined -1.8% to US$3,282/oz, with its second significant weekly pullback in
only a month. This came as some major issues causing the recent market declines
seemed to be easing, especially regarding the tariff war. There were some hints of
progress in negotiations between the US and China, where the racheting up of trade
tensions had been particularly severe. However, it is too early to overstate the
progress on trade issues, as even after negotiations between the US and many
countries, tariffs are still likely to be much higher globally from 2025.
The news drove a strong risk on move by markets, with the S&P 500 up 5.6%, the
Nasdaq surging 8.3% and Russell 2000 up 5.1%. However, all three still remain below
their levels just before the crash, with the S&P 500, Nasdaq and Russell 2000 down
-2.5%, -2.3% and -4.8% since March 21, 2025. We remain wary of such volatile
moves, as they tend to characterize a bear, rather than bull, market, with the latter
usually making a gradual ascent over a long period rather than abrupt gains. We are
especially dubious of the outsized rise in Nasdaq, and believe the tech bubble has
finally popped and that hopes of a resurgence in its collapsing valuations, which are
still high versus other sectors, may be dashed this year.
The defensives sectors, which had seen significant gains in the crash,
underperformed, with global utilities up 0.9% and consumer staples down -1.0% this
week, while the gold stocks were dragged down by metal price, with the GDX losing
-4.1% and GDXJ -4.8%. However, overall this year has still been one of significant
rising risk aversion overall, with the S&P 500, Nasdaq and Russell 2000 down -5.9%,
-11.4% and -12.3%, but global utilities, consumer staples, GDX and GDXJ up 9.1%,
8.6%, 39.5% and 36.2% respectively.
A look at gold’s pullbacks in historic bull markets
As we have covered recently, gold’s ratios versus many comparable assets have
surged to far above both medium-term and long-term averages and several are at all
time highs. This suggests that the gold price may be in the early phase of a bubble,
and with the gains this year looking increasing parabolic, it could be setting up the
metal for a potential short-term pullback, even if the overall uptrend remains intact.
Based on the time and length of previous gold bull runs, it seems possible that the
price might top as early as this year, although the bull market could run into 2026.
While gold’s bull markets are all obviously different, there are some common traits,
including significant temporary pullbacks with the overall upward trend soon
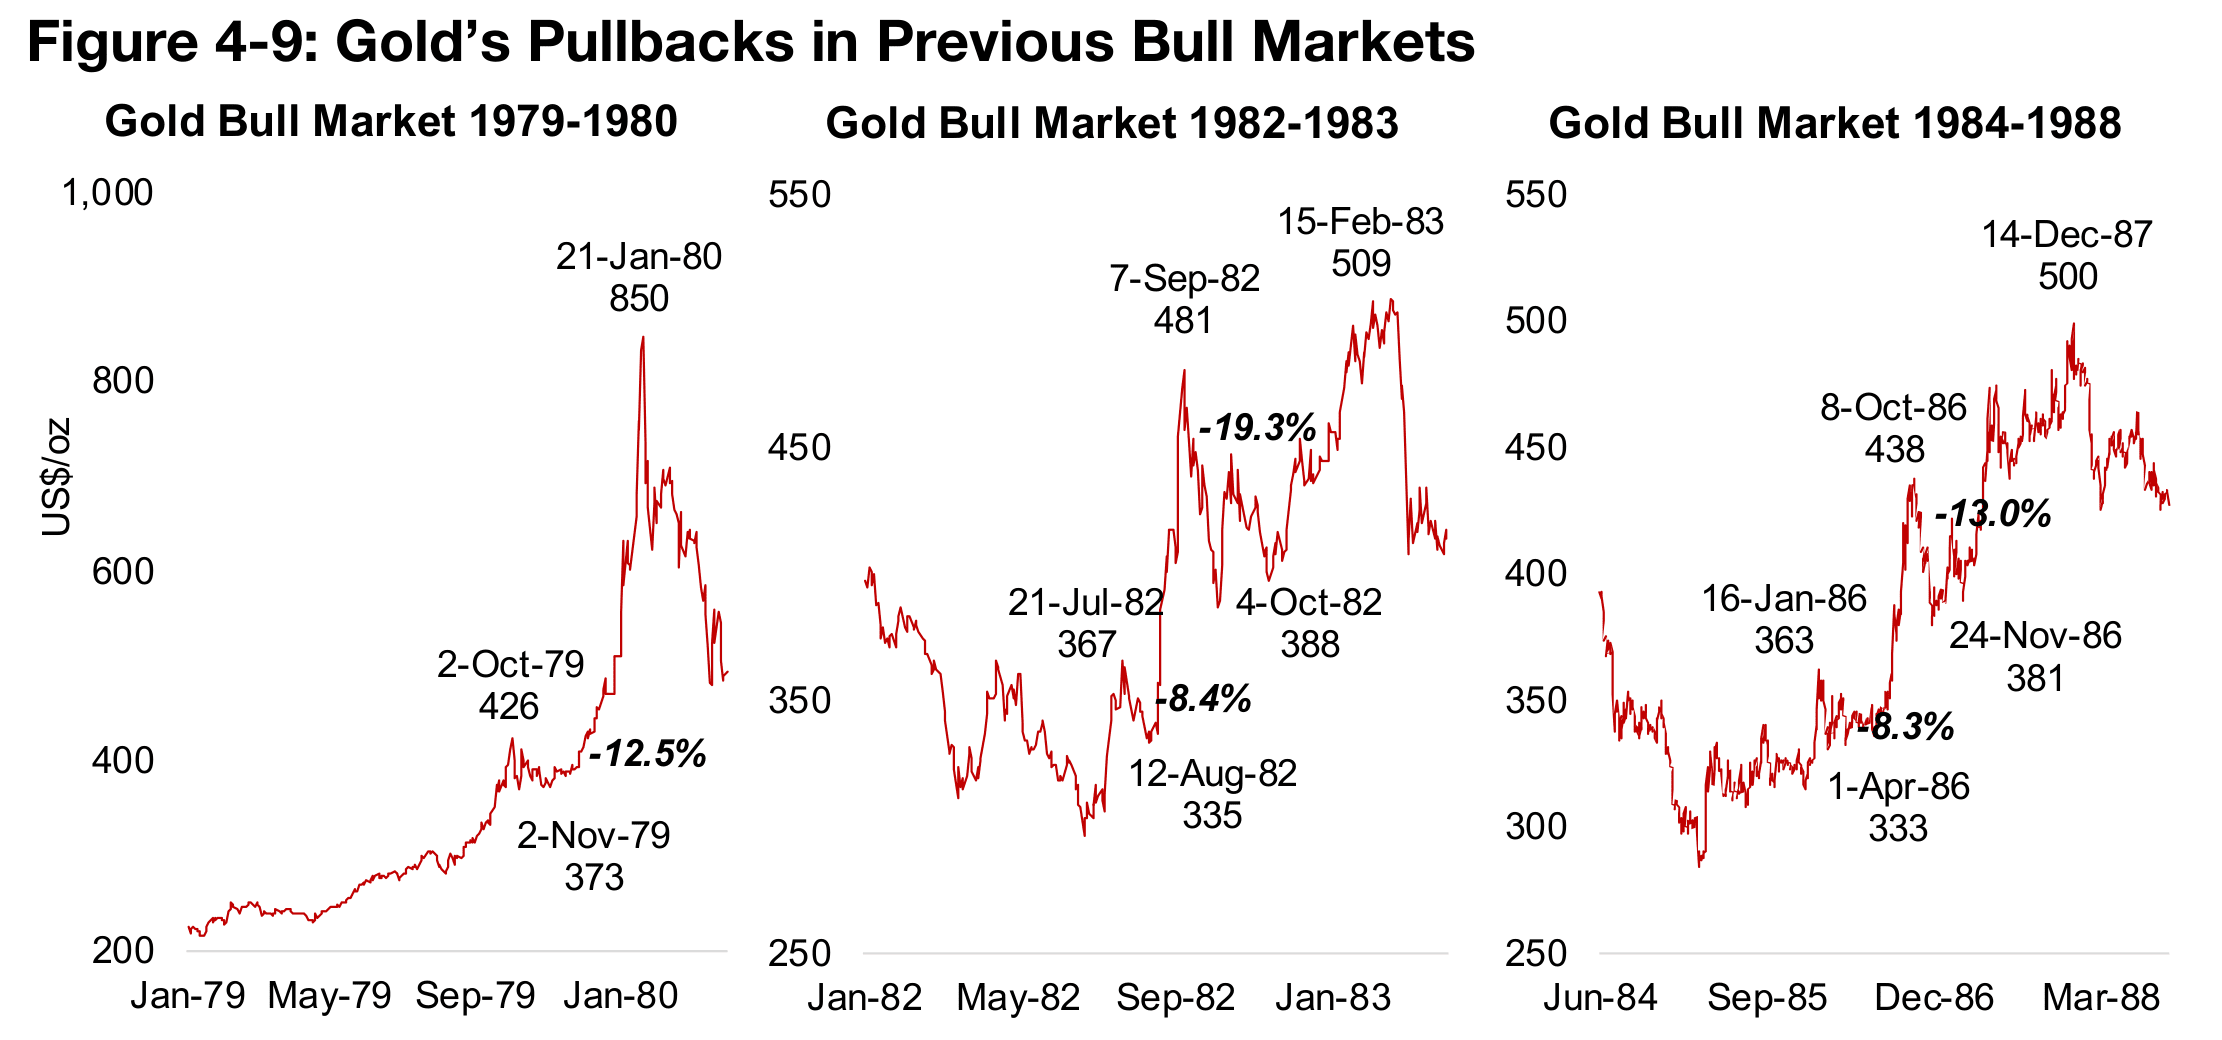
continuing. The largest percentage rise in the gold price of all the major bull runs in
was from the rise starting in 1979, with the metal more than quadrupling in just over
a year from US$200/oz to US$850/oz peak in January 1980 (Figure 4). However, as
is similar with all these bull runs, there was a significant pullback, of -12.5%, in
October 1979.
The next two big upward moves were in the early and then mid-to-late 1980s. Gold
rose from around US$300/oz in June 1982 to US$509/oz in February 1983, with two
major declines, an -8.4% drop from July 1982 to August 1982 and -19.3% decline in
September 1982 (Figure 5). The mid-1980s bull market was much longer, running
from late 1984 to December 1987, with an -8.3% decline from January 1986 to April
1986 and -13.0% drop from October 1986 to November 1986 (Figure 6).
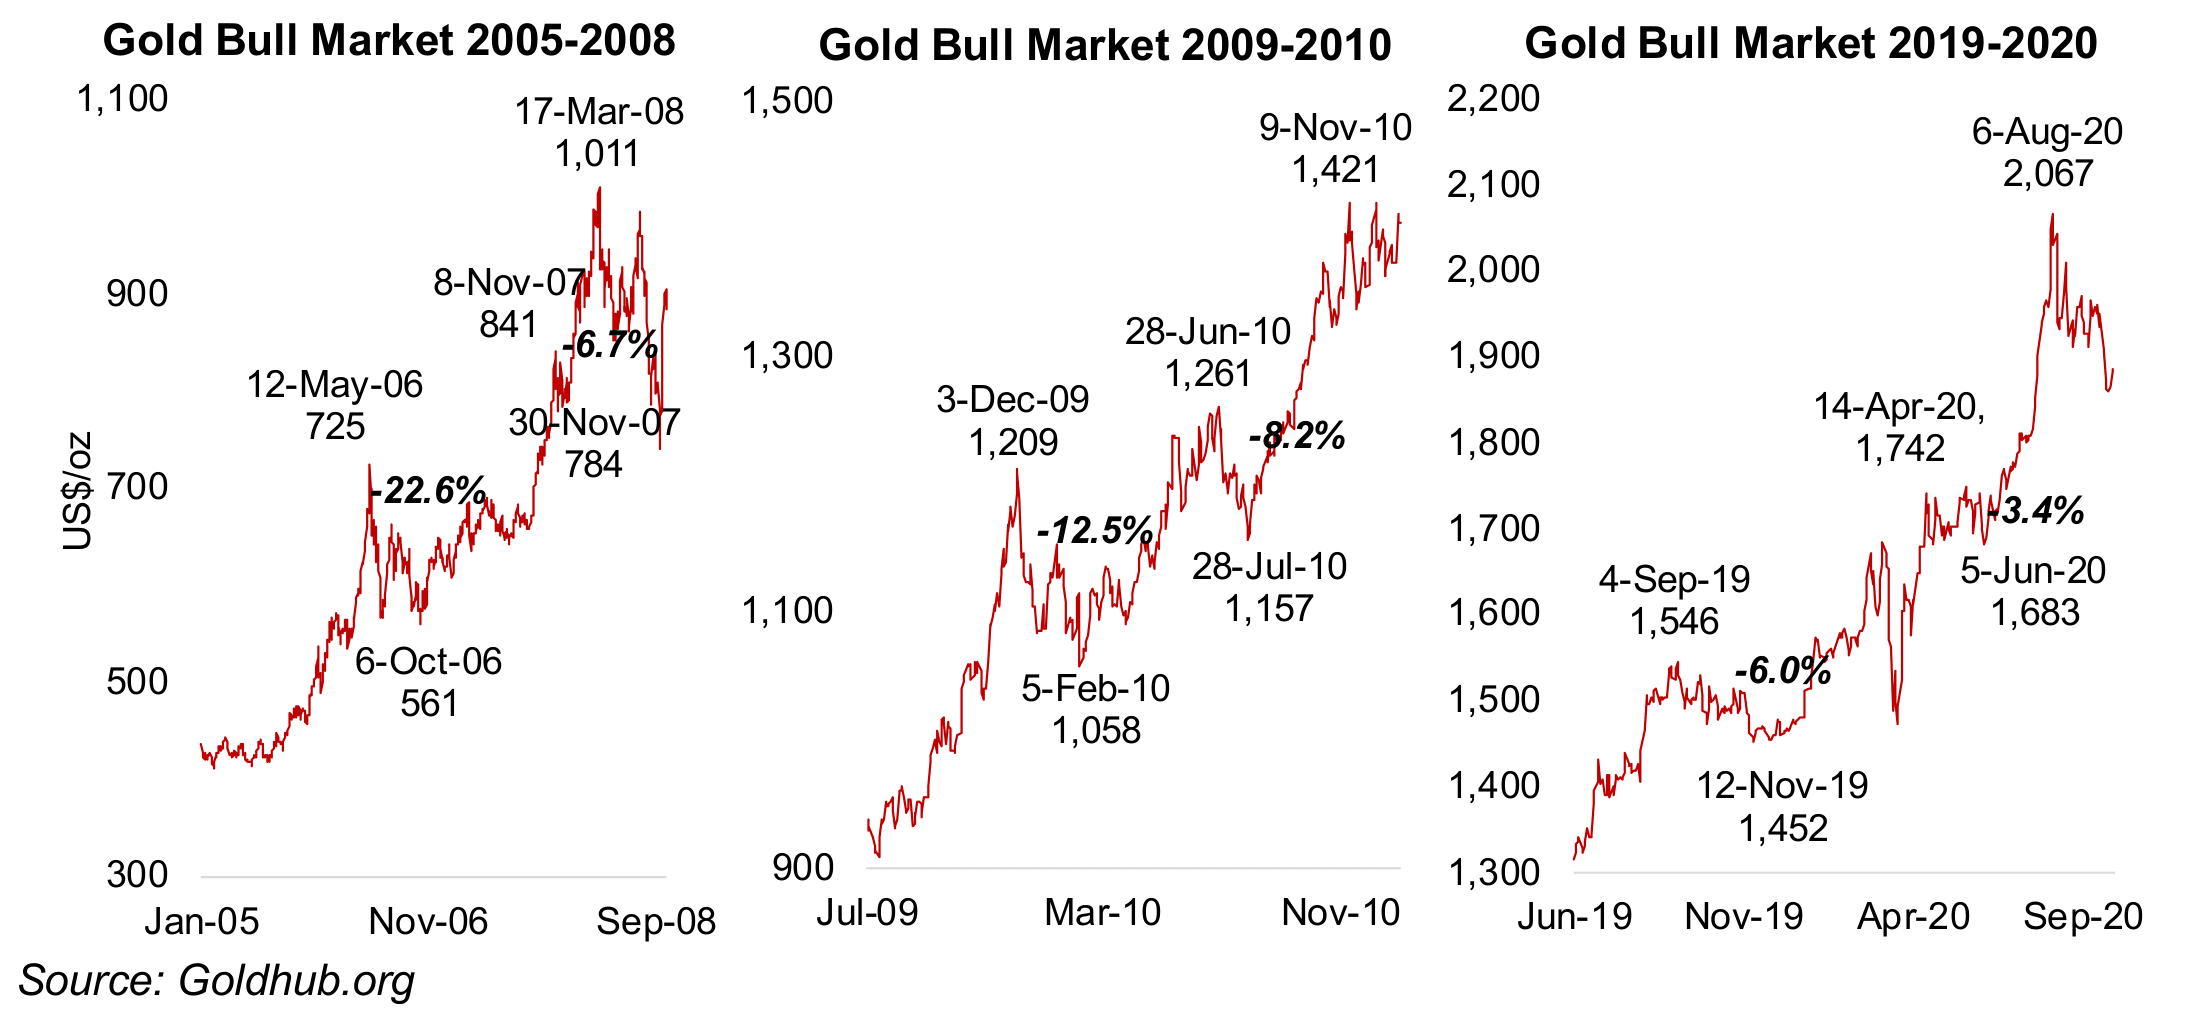
Gold then did not make major gains for fifteen years, before doubling from US$500/oz
in 2005 to US$1,000/oz in 2007, with two pullbacks, by -22.6% from May 2026 to
October 2006 and -6.7% in November 2007 (Figure 7). After slumping along with
most assets in the 2008-2009 financial crisis, gold recovered, rising from US$900/oz
in mid-2009 to US$1,420/oz in late-2010, with two major pullbacks, by -12.5% from
December 2009 to February 2010 and -8.2% from June 2010 to July 2010 (Figure 8).
Another common trait in addition to the price pullbacks, with one usually by a single
digit percentage, and another by double digits, is that the price often doubles in these
bull runs. Taking the start of the current run from late December 2025, and using the
US$1,800/oz average as a base, a doubling would see gold reach US$3,600/oz, and
a particularly frothy move could reach US$4,000/oz. Gold bull runs have tended to
last from one to three years, implying the current move could persist this year,
especially with the trade only recently popular with the broader market.
Gold’s ratios versus other metals, commodities and equities, would look absurdly
high in terms of their long-term averages with the metal at US$4,000/oz, holding
these other prices constant. Of course, if there is a massive monetary expansion, this
could drive up the prices of these other commodities to bring these ratios down, and
another pullback in gold would also bring them more in balance. If we count the -5.9%
decline in recent crash as the first of two reversals which would be expected in the
average bull run, another decline could occur on the way to the metal’s peak,
especially if the current parabolic move continues.
Massive March for gold ETFs, central bank purchases ease
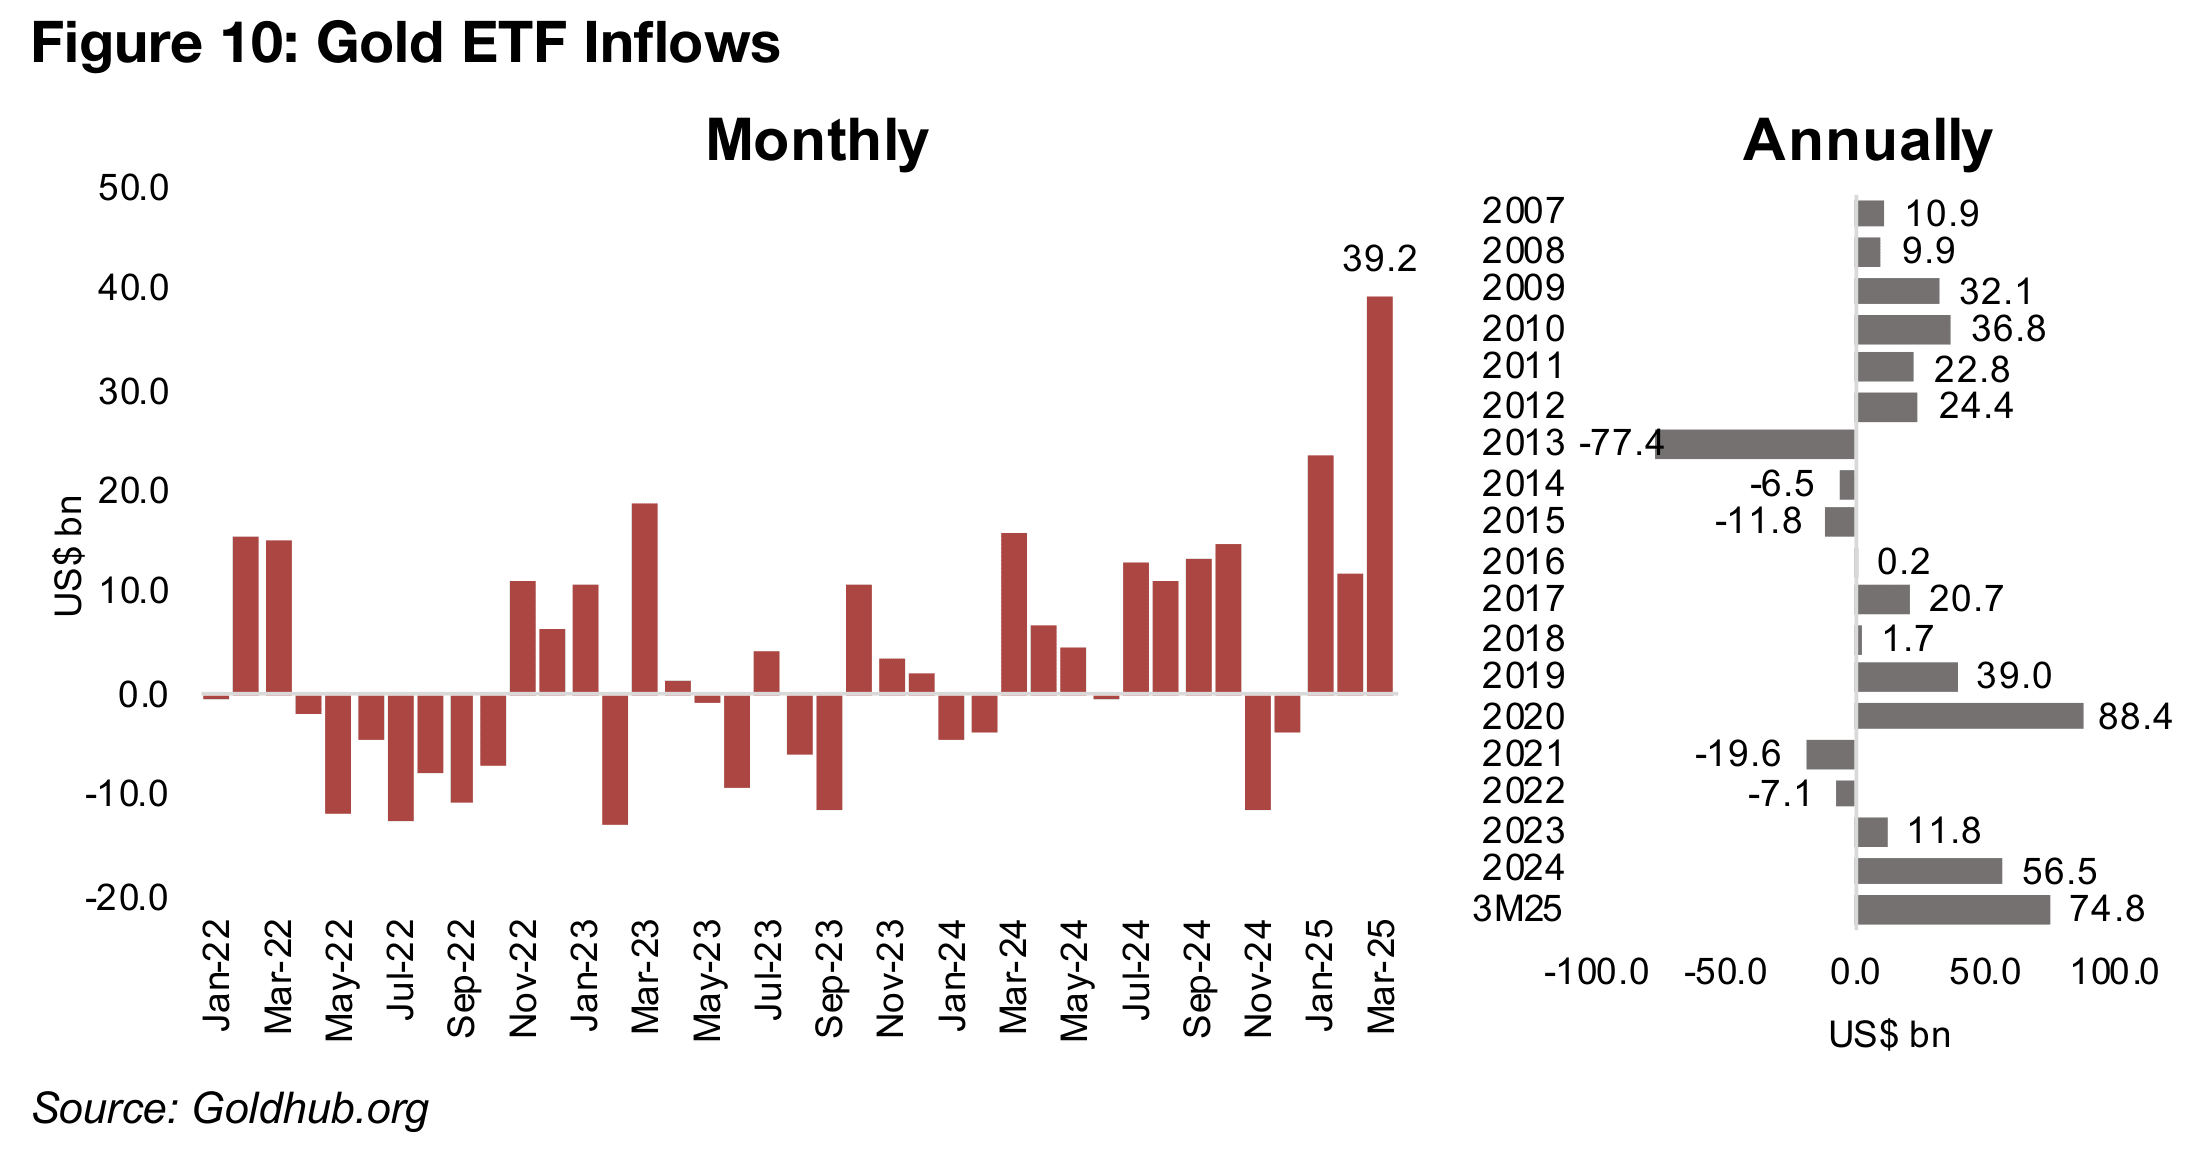
The surging popularity of the gold trade and its shift into the retail mainstream has
been shown by massive ETF inflows in March 2025 of US$39.2bn. This is up from
just US$12.0bn in February 2025 and US$23.6bn in January 2025, following outflows
of US$-3.8bn in December 2025 and US$-11.4bn in November 2025 (Figure 10). This
was the strongest month in years, with Q2/25 inflows already at US$74.8bn,
surpassing all of 2024, at US$74.8bn, and near the US$88.4bn peak in 2020.
Gold ETF inflows from 2021 to 2024 showed a retail market quite disinterested in the
metal from 2021 to 2023, after an initial burst out of the 2013-2018 bear market with
inflows of US$39.0 in 2019 and US$88.4bn in 2020. There were net outflows in 2021
and 2022, at US$-19.6bn and US$-7.1bn, with a marginal US$11.8bn rise in 2023.
While there was a pickup in 2024, this was mainly concentrated in the third quarter.
With the retail markets tending to enter assets more towards the end of major moves,
the huge new interest in the metal could actually be taken as a warning sign for gold.
However, given the length of past gold bull markets, this trend could still persist
through most of 2025. While there could of course be reversals later in the year and
this trend cannot necessarily be extrapolated, even if the gold bull market continues
into the third quarter, the ETF inflows could be on track for their biggest year ever.
These huge retail inflows interestingly contrast with the net purchases of central banks, which have been relatively low in the first two months of 2024. Net buying was 24.2 tonnes in February 2025 and 19.9 tonnes in January 2025, after they turned negative in December 2024 for the first time since January 2022, at -8.1 tonnes (Figure 11). This excludes the exceptional declines in H1/24 on monetary disturbances in Turkey which saw the country sell large amounts of gold to stabilize its financial system. These figures are relatively low compared to the net monthly net purchases in 2024 of 27.6 tonnes per month and in 2023 of 33.5 tonnes.
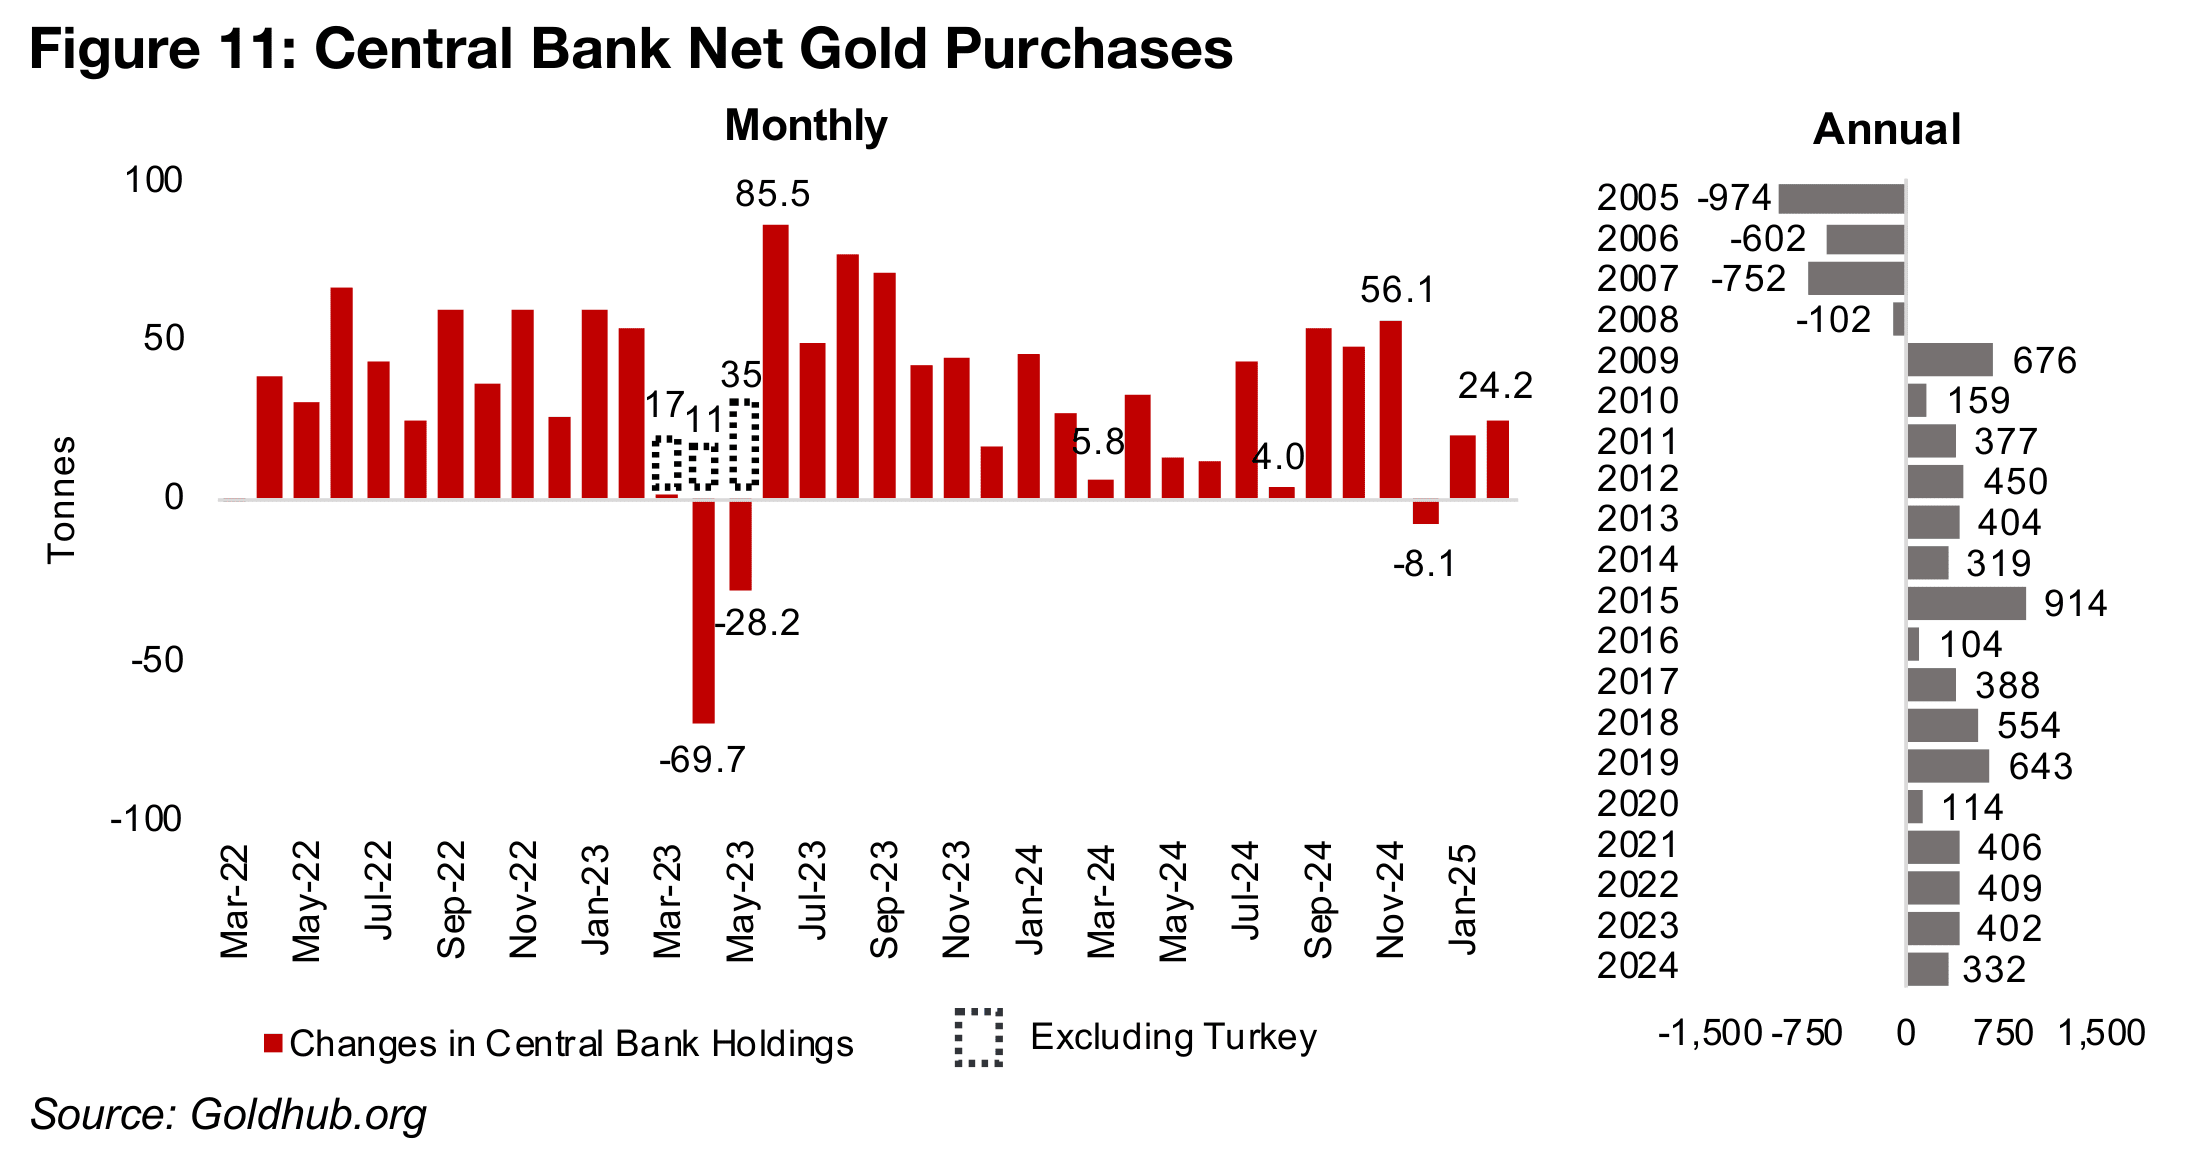
While retail ETF inflows were relatively weak in from 2021 to 2023, central banks continued to make large purchases of over 400 tonnes per year. However, this dropped to 332 tonnes in 2024 and the most recent data suggests a further potential decline. We suspect that this cooling of interest from the central banks could be an indicator they may be viewing the gold price as getting overly high currently and they may be waiting for somewhat of a pullback to boost purchases.
Only gold and silver valuations rise for metals ETFs, but are still relatively low
While gold does seem to be getting high versus comparable assets, its ratio versus gold stocks is just near the medium-term average. However, this has not driven particularly high valuations for the sector, with the price to book (P/B) multiples of the GDX and GDXJ still only 2.30x and 2.02x, although this is up considerably from 1.86x and 1.67x in June 2024 (Figure 12). Along with the SIL silver ETF P/B of 2.10x, up from 1.52x in June 2024, the valuations do look high compared to other metals ETFs.
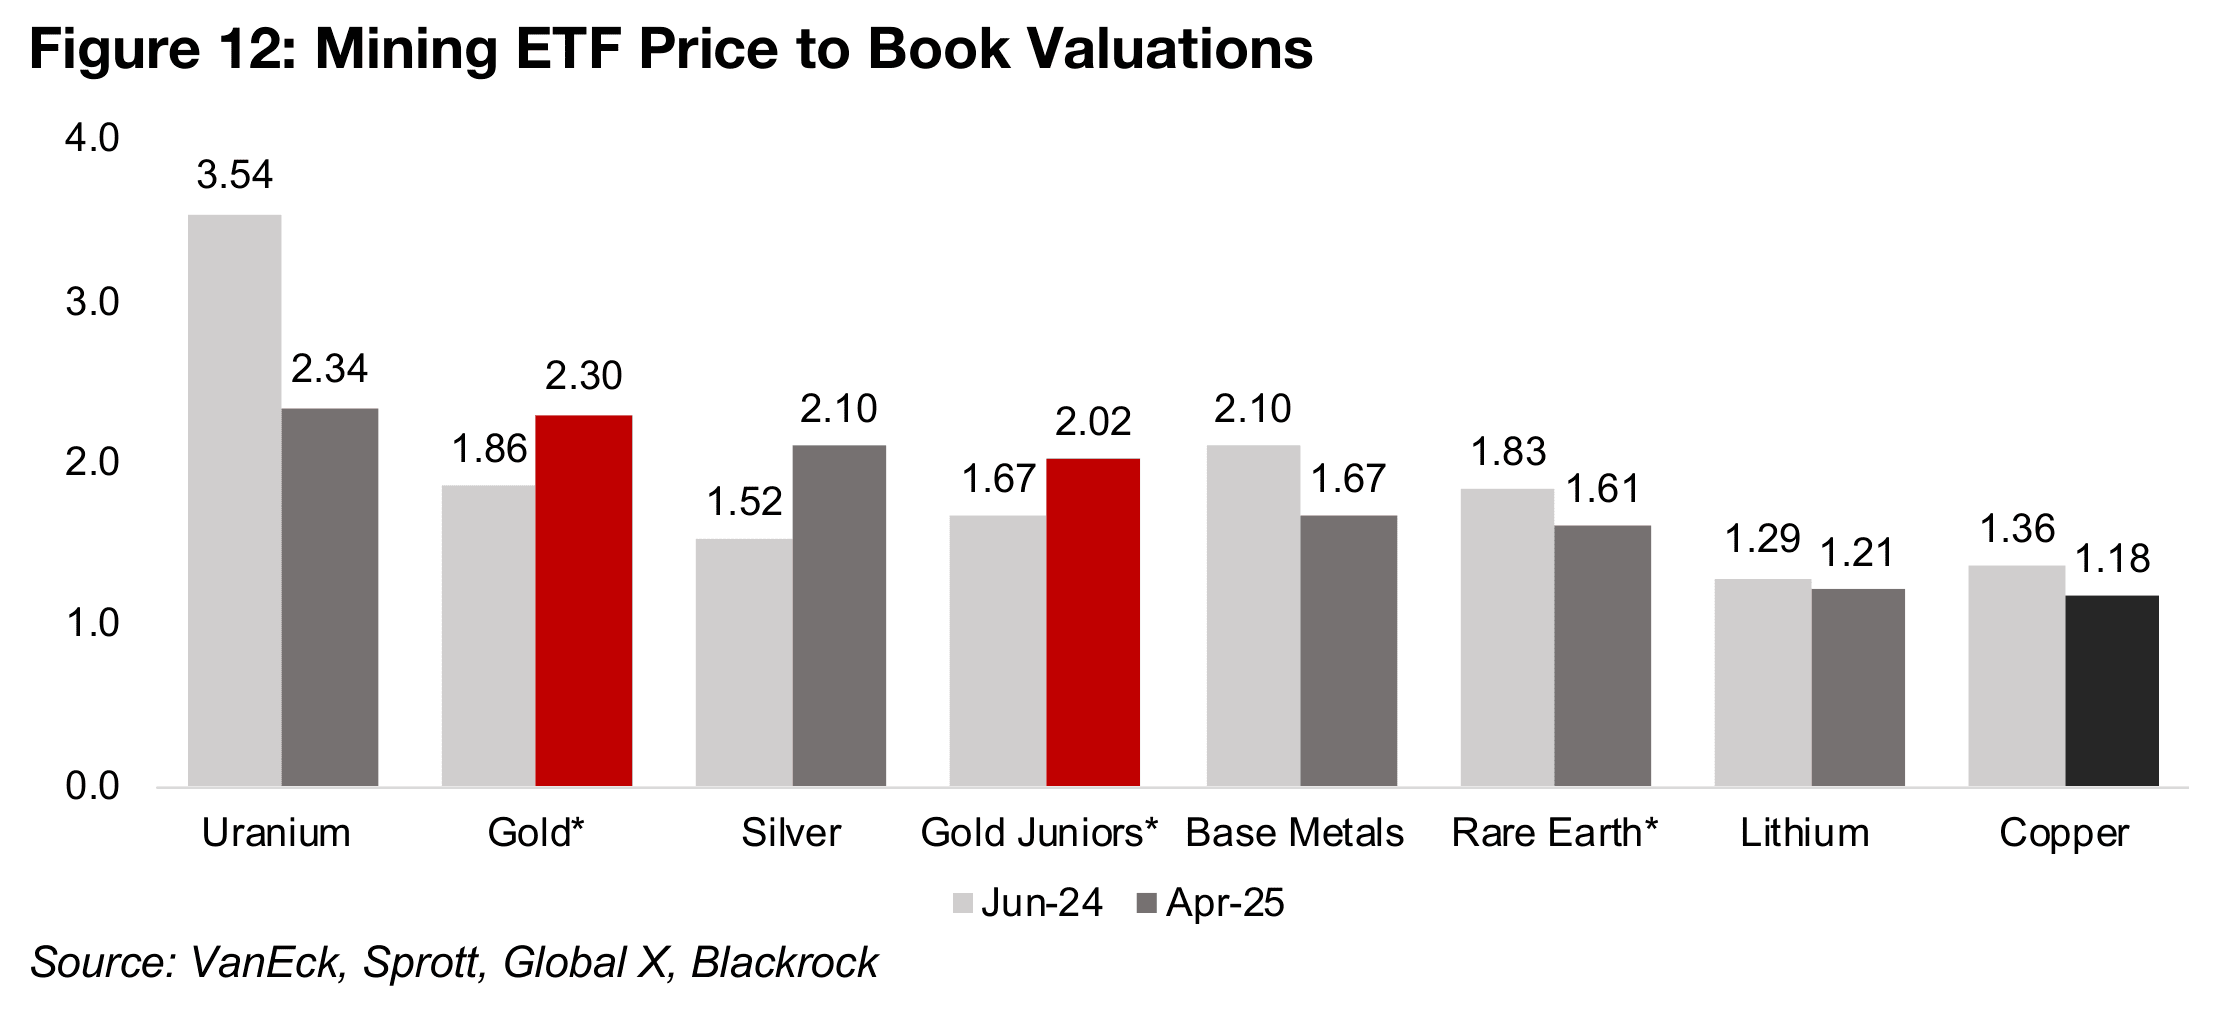
However, this is because of the relatively weak price performance of many base and
other metals, which have held down the multiples of the stock ETFs for these sectors.
This includes base metals, copper, uranium, lithium and rare earth ETFs, which have
all seen major declines in their P/B multiples over the past year. There is a certainly a
case that economic demand could falter this year and put pressure on these metals.
However, for many of these ETFs, and especially in the case of copper, where its P/B
has declined to just 1.2x P/B from 1.4x in June 2024, it seems that these low figures
could have already priced in much of the potential downside.
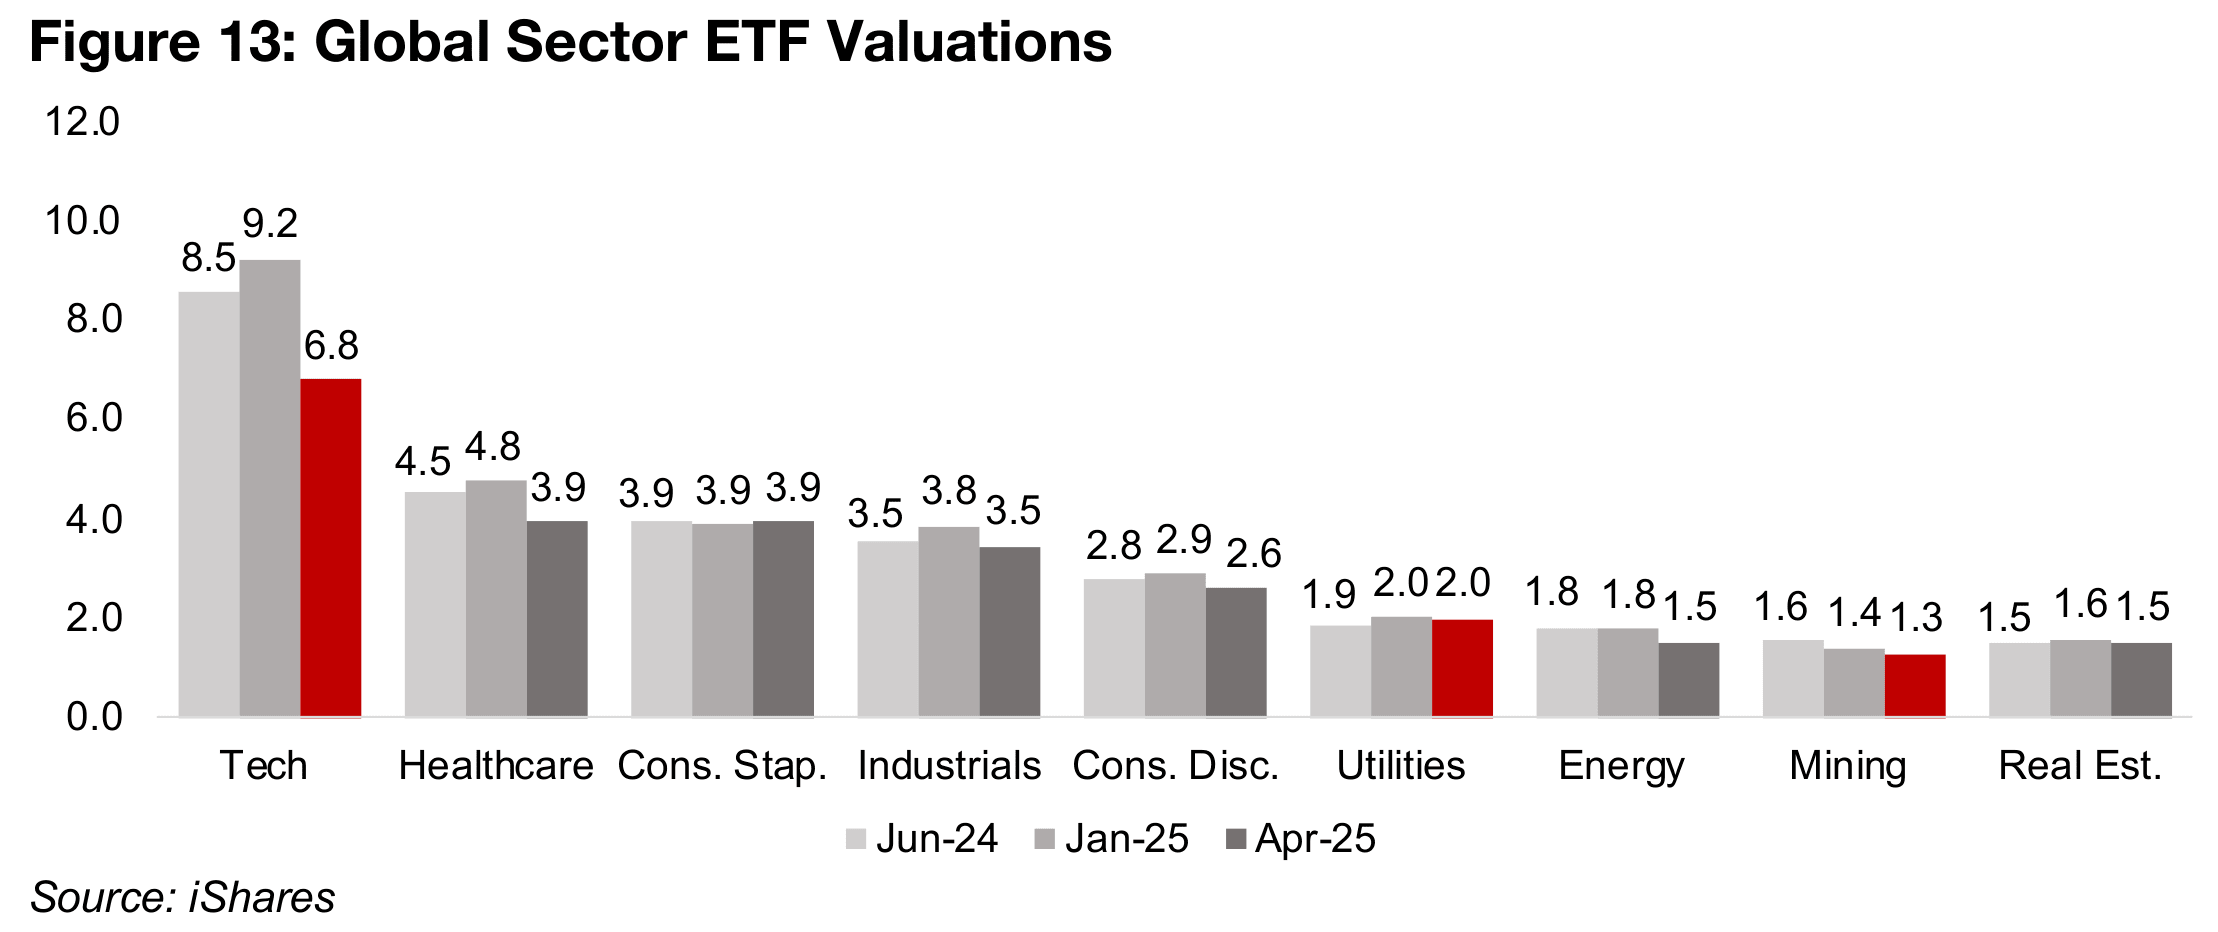
While the gold multiples are high versus other metals ETFs, they are still quite low in
the context the major global sectors. The P/Bs of the GDX and GDXJ are just near
the 2.0x for utilities, another safe haven, with only energy, global mining and real
estate having lower multiples (Figure 13). While the tech multiple has finally
contracted, at 6.8x it is still well above all other sectors. This suggests that its ongoing
unwind could still have a way to go. We suspect that yet another pullback in tech
could drive the market even more heavily into the safe havens like gold, gold stocks
and utilities, especially given their only moderate valuations. Overall, the current
valuations do leave room for a further rise in gold stocks, especially if the metal price
continues up and the broader retail market continues to back the trade.
We would view gold stocks as starting to get expensive if the P/B multiple starts to
head above 2.5x, with multiples well above 3.0x indicating that there could be a move
into bubble territory. This would be a lower level than where some other sectors would
generally be considered to have extremely high multiples. This is because the gold
and other metals stocks may not quite have the long-term growth stories of other
sectors. These companies are always in a fight to replenish depleting reserves, and
in many cases this could mean flat unit production, with earnings growth mainly
depending on rising metals prices or cost reduction.
This contrasts with many companies where growth can be high for a very extended
period if they are in relatively new industries, like tech, that may be rapidly expanding.
However, even in sectors with high growth, valuation multiples can get too high to be
justified, which seems to have been the case with tech in the period prior to late-2024.
Earnings growth for the sector has certainly been strong, but the multiples had started
to imply that the current high growth rates could continue indefinitely, which is of
course unsustainable for any industry.
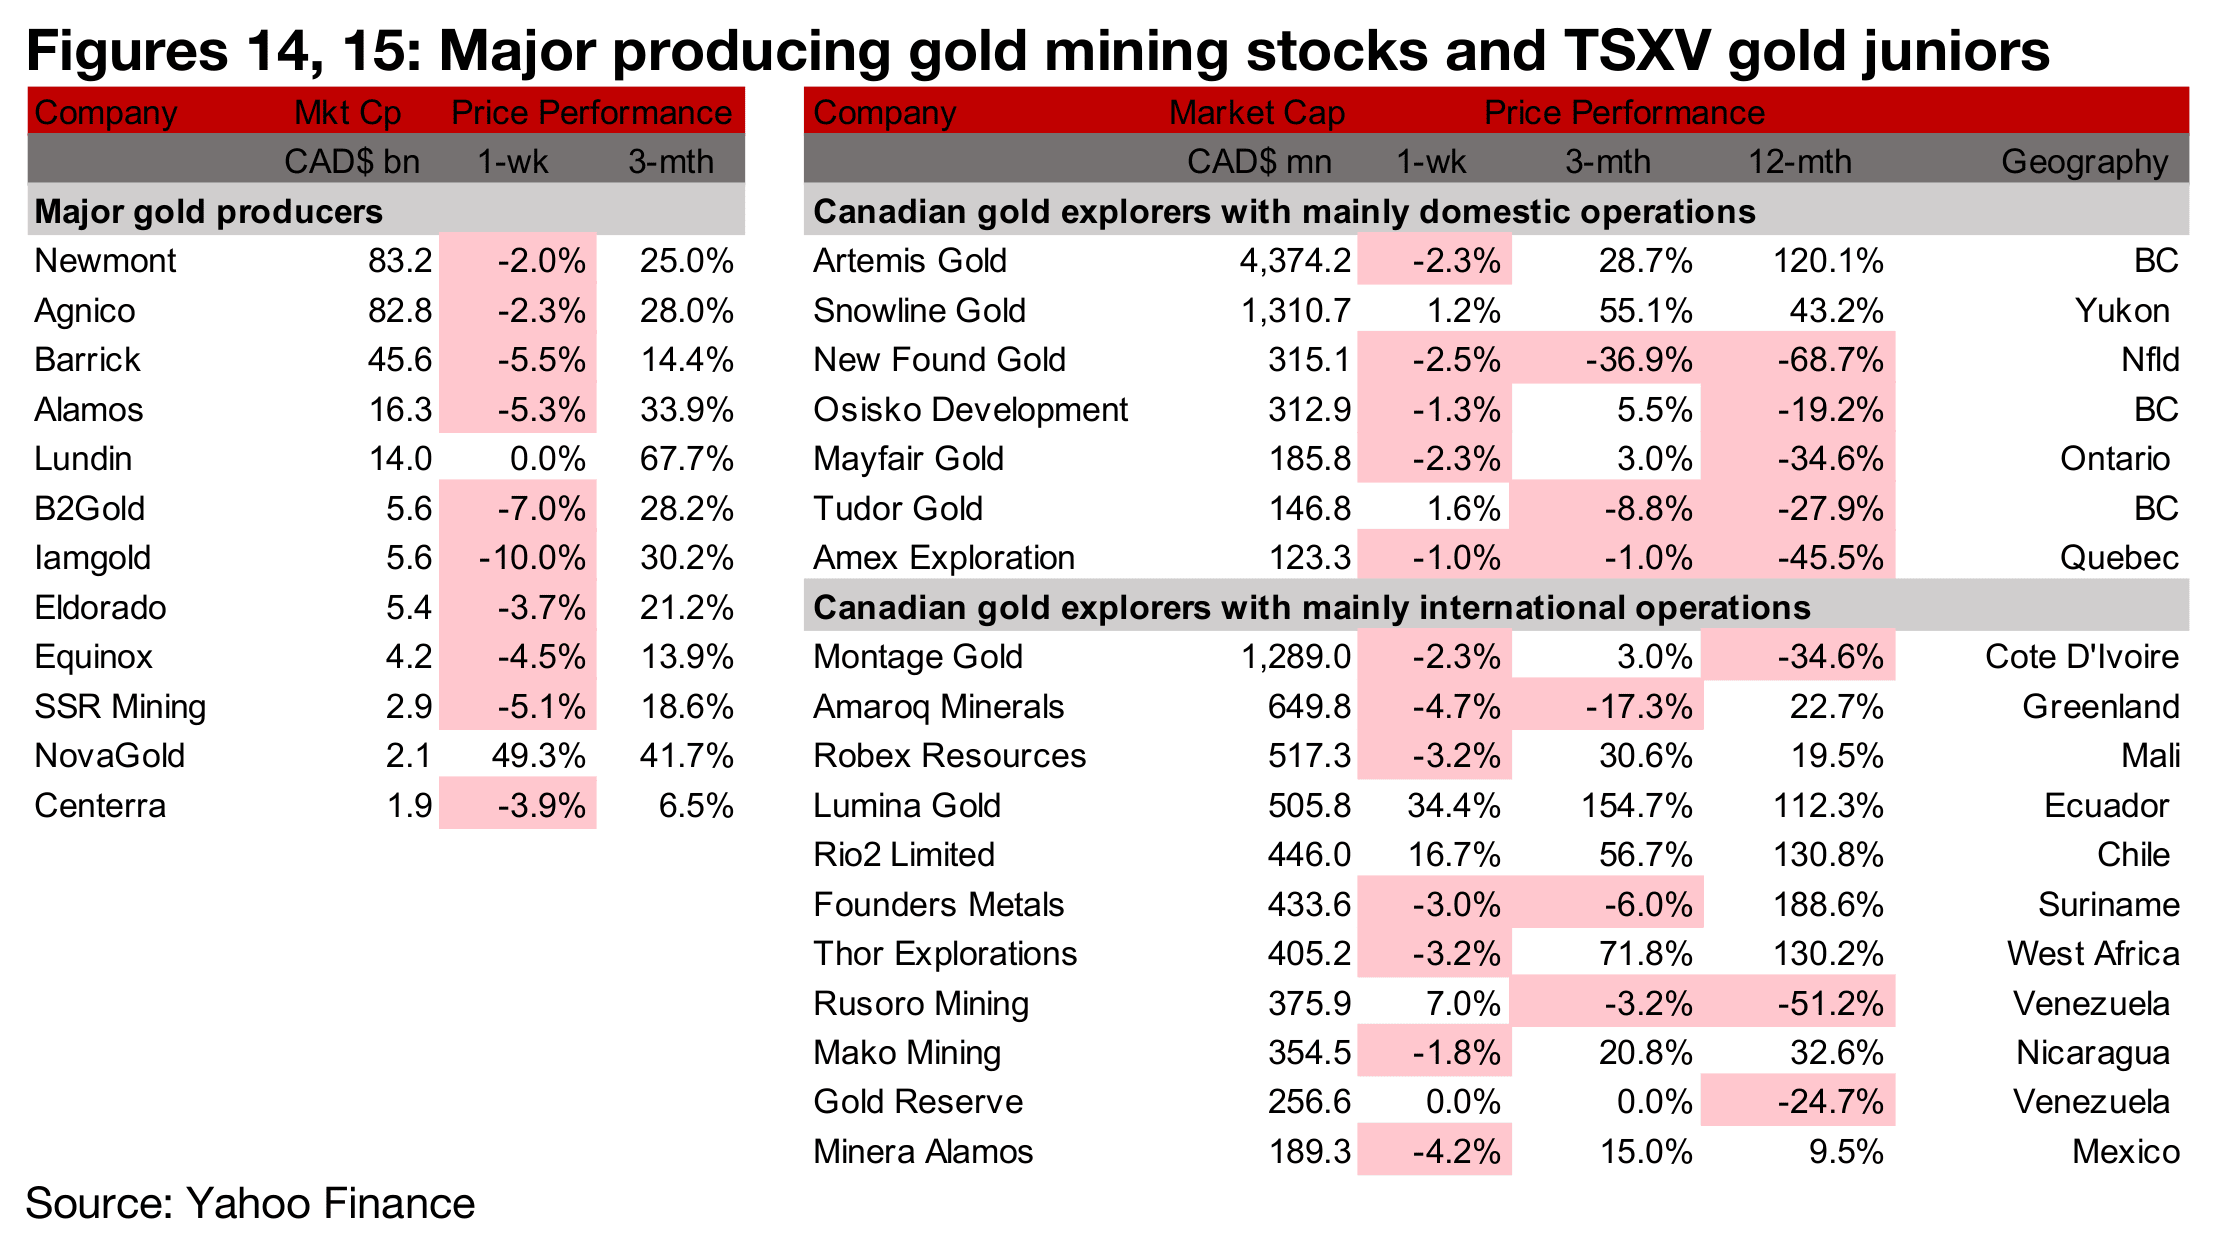
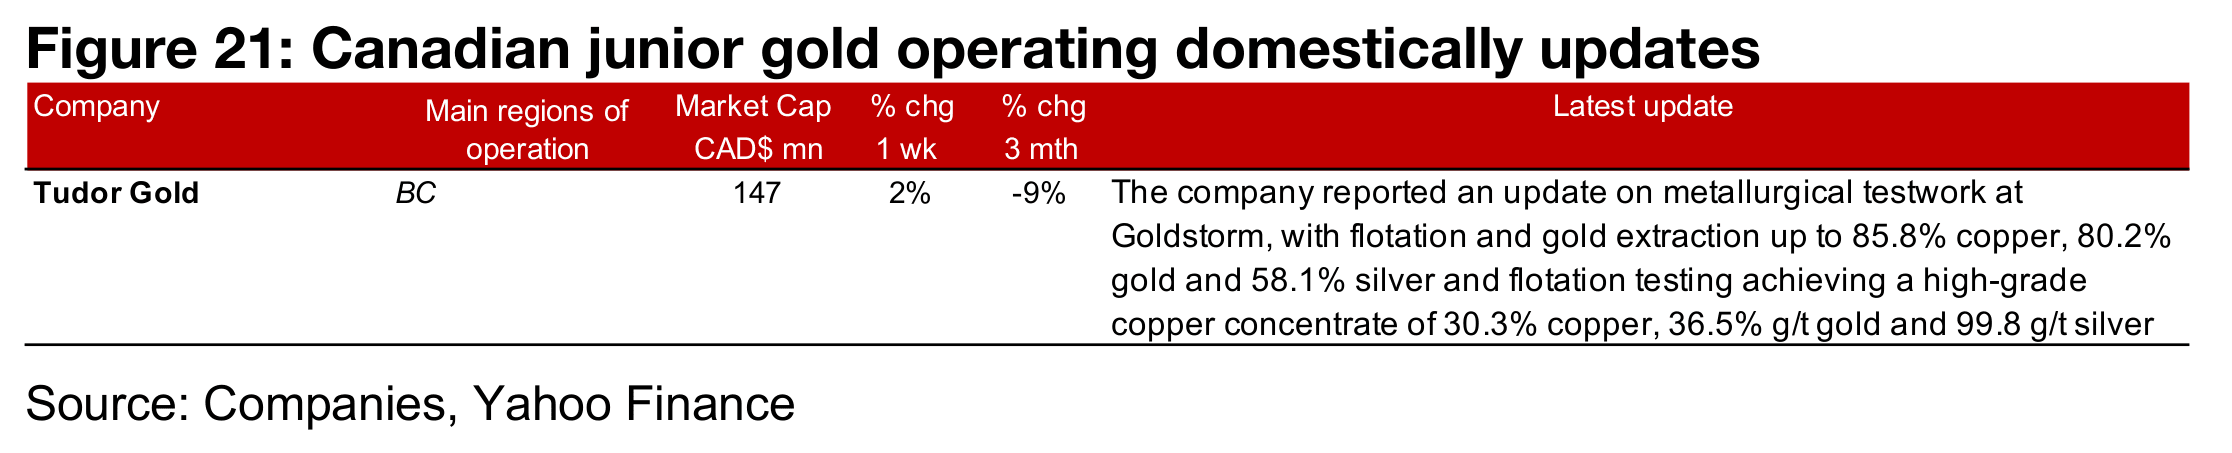
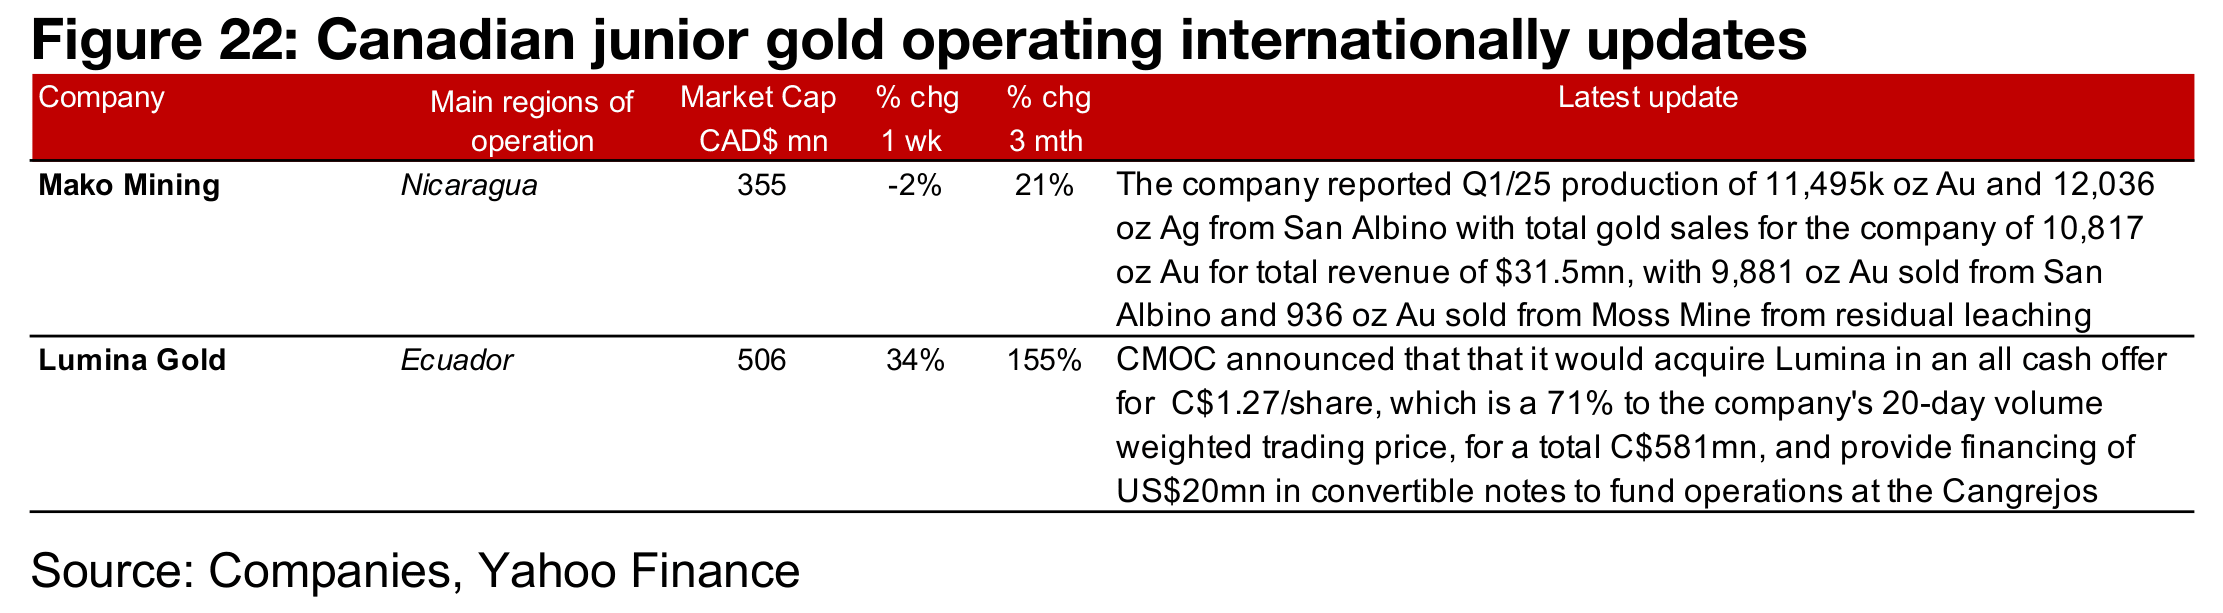
Major producers and TSXV gold mostly down, M&A activity for Nova, Lumina
Most of the major gold producers and TSXV large gold were down on the pullback in the gold price (Figures 14, 15). However, one large producer had major gains, Novagold, up 49.3%, which together with Paulson Advisers will acquire 50% of the Donlin Project from Barrick for US$1.0bn. For the TSXV gold companies operating mainly domestically, Tudor Gold reported an update on metallurgical testwork for Goldstorm (Figure 16). For the TSXV gold companies operating mainly internationally, Lumina had large gains also on M&A news, with it to be acquired by CMOC, and Mako Mining company reported Q1/25 production (Figure 17).
Disclaimer: This report is for informational use only and should not be used an alternative to the financial and legal advice of a qualified professional in business planning and investment. We do not represent that forecasts in this report will lead to a specific outcome or result, and are not liable in the event of any Icon and logotype combination business action taken in whole or in part as a result of the contents of this report.