January 27, 2025
Gold Rips While Silver Lags
Author - Ben McGregor
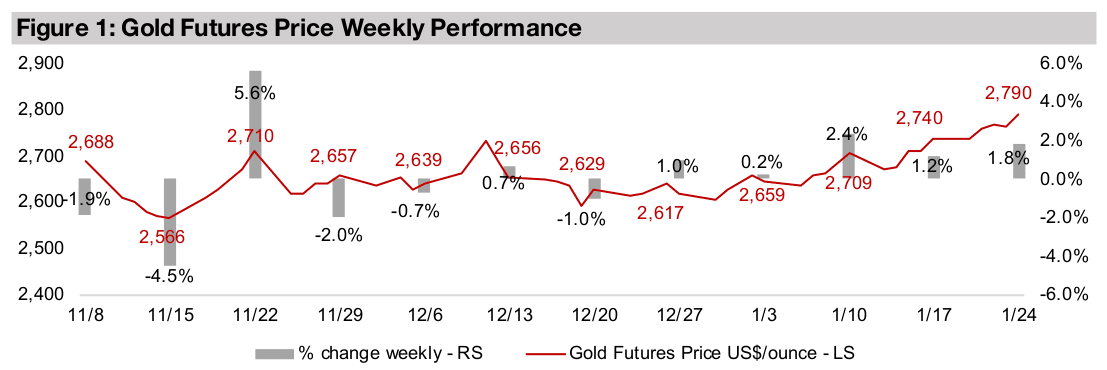
Gold up for fourth week as US$ and yields pullback
Gold rose 1.8% to US$2,790/oz, gaining for a fourth consecutive week and heading towards a new US$2,800/oz benchmark, which appears to have been driven by a decline in the US$ and US bond yields as there were no major economic releases.
Gold outpaces major metals over past half year while silver lags
This week we look at gold’s outperformance of the major metals over the past half year, driving up the metal’s stock ETFs versus other sectors, and how silver has tracked gold and copper long-term, with its drivers effectively a hybrid of these two.


Gold Rips While Silver Lags
Gold rose 1.8% to US$2,790/oz, up for the fourth consecutive week and heading
towards a new US$2,800/oz key benchmark. While there were no major economic
news releases backing the rise this week, the gain could have been partly driven by
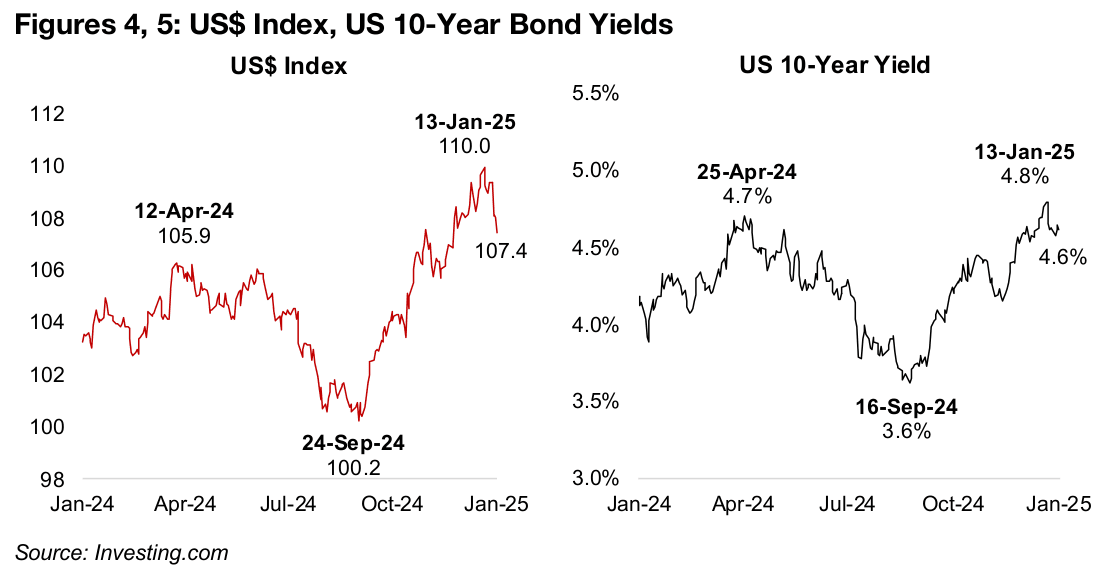
a continued decline in both the US dollar and bond yields, which tend to move
inversely to gold. Since their recent peaks on January 13, 2025, the US$ Index has
come down to 107.4 from 110.0 and the US 10-year bond yield from 4.8% to 4.6%
(Figures 4, 5). The gold stocks rose, with the GDX up 3.2% and GDXJ gaining 3.3%,
significantly outpacing the broader equity indices, with the S&P 500 up 1.8%, the
Nasdaq adding 1.5% and the Russell 2000 increasing 1.1%.
Gold’s continued ascent implies markets are pricing in a rising probability of one or
more of these core drivers: 1) a continued increase in the money supply and therefore
inflation, with gold purchased as a hedge, 2) a slowdown in economic growth or 3)
continued high geopolitical risk, with these latter two seeing gold purchased as a safe
haven. We suspect there may be an especially heavy weighting on the first factor,
with central banks, including the Fed, indicating rate cuts would slow, but not be held
flat or hiked, which would mean continued monetary expansion, which is a key gold
driver. Also, as there is often a long delay between rates cuts and a CPI increase
markets may also expect that last year’s aggressive cuts could still drive up inflation.
While there has been hope that the Trump administration will lower geopolitical risk,
the markets may not be ready to reduce the risk premium priced in into gold for this
factor quite yet. Even the recent announcement of a ceasefire in Gaza did not see a
major decline in the metal’s price. Overall the outlook for this year is apparently more
than opaque enough for markets to continue to build up gold positions as a hedge.
Gold leads precious metals, copper and aluminum relatively flat
Gold has completely dominated all the other major metals since the start of second half 2024, rising 19%, and while silver had been tracking it quite closely through to around October 2024, it has fallen behind since, and is now up only 4% (Figure 6). Silver’s sluggishness is interesting given that it may have its fifth straight year of major supply demand deficit in 2025, and we go more into its longer-term relationship versus gold and copper below. Platinum and palladium, up just 2%, and down -3%, respectively, since July 2024, have been just behind silver, with their near flat performance driven by a mediocre auto industry outlook, with autocatalysts comprising the largest proportion of demand for both metals.
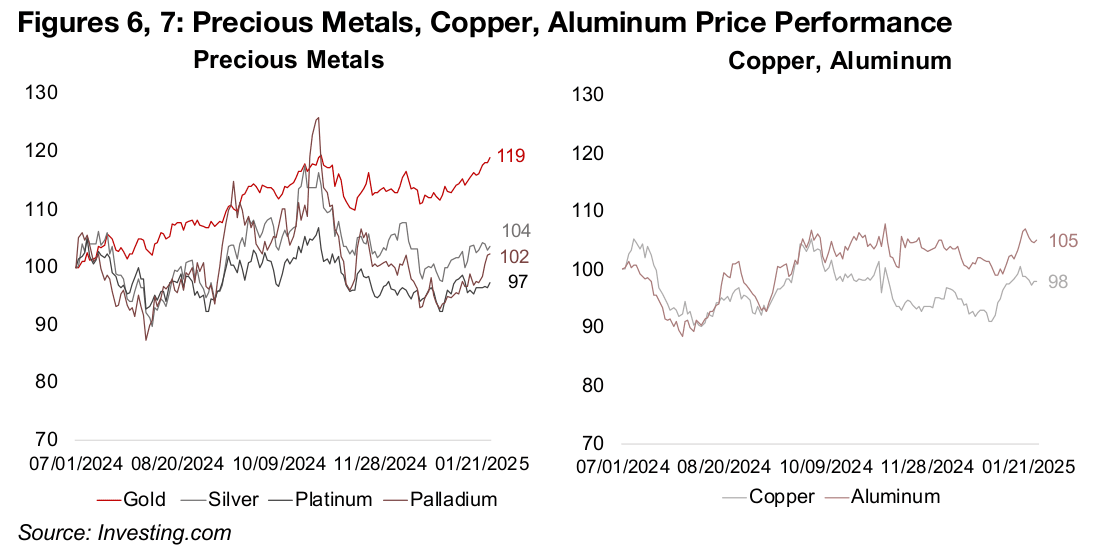
There has been limited movement since July 2024 for copper, up 5%, and aluminum, down -2% (Figure 7). With both being key bellwethers of the global economy, given broad demand for these metals across many sectors, this implies that markets have had a reasonably neutral outlook on world growth for several months. The two metals tracked each other quite closely from July 2024 to September 2024. However, the trend for copper flattened out and has mainly stayed near the highs for the year since, possibly driven by the continued expansion of the tech sector, and its relatively high weighting to electronics demand versus aluminum. Aluminum did trend down generally from October 20204 to December 2024, put has picked up to near flat since.
Steel-driven metals hit by industry slowdown, battery and other metals slide
The metals driven mainly by steel demand have also been down since July 2024 given
a slowdown in the sector. Much of this has come from relatively weak property and
infrastructure markets in China, which account for the majority of global steel demand.
However, there has also been a slowdown from the rest of world, which is a large
proportion of demand in aggregate, and had held up over H1/24.
By far the largest steel-driven metals market is iron, which is in the top four largest
metals markets in value terms along with gold, copper and aluminum. It has by far
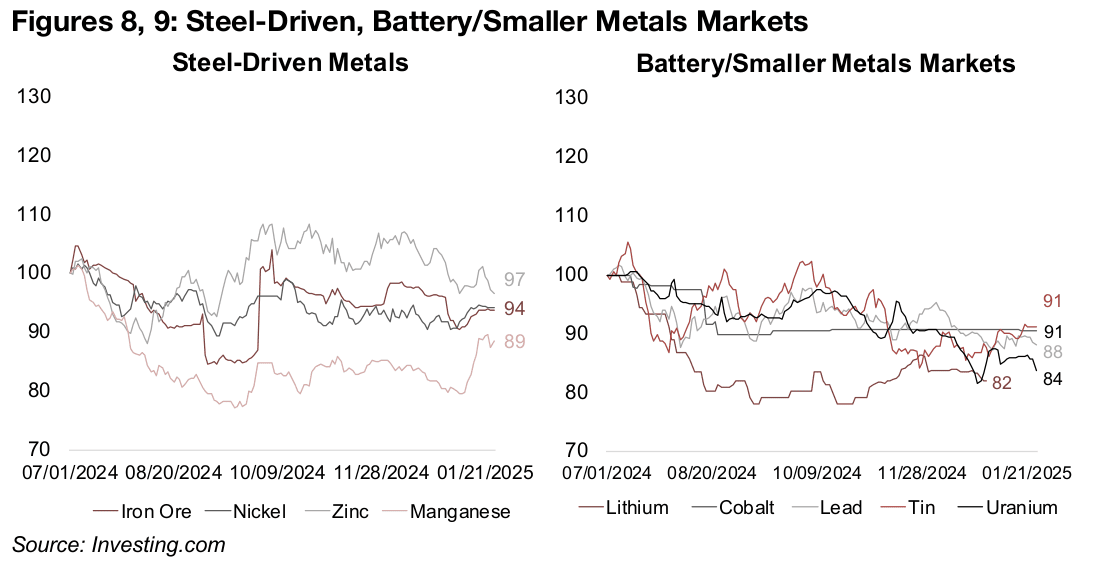
the largest proportion of its demand from steel, at 98% and has declined -6% since
July 2024 (Figure 8). Nickel, zinc and manganese have 65%, 60% and 75% of their
demand from the sector, and have also struggled, down -6%, -3% and -11%. While
China has already announced market stimulus measures this year, they could take
some time to boost their property and infrastructure markets, and in turn steel
demand. This could mean that growth in steel demand this year may need to come
from outside of China. However, this could require broad global economic growth
and the IMF is already forecasting a slowdown in real GDP for most major economies.
The battery metals and other smaller metals markets have struggled the most overall
since mid-2024. The lithium price has continued an over year-long slump and was
down 18% as of the most recently available data through to end-2024, as electric
vehicle demand growth has slowed and production capacity has risen (Figure 9).
Cobalt, which also has a large component of its demand from lithium batteries,
dipped in July and August 2024, but has flattened since, and is down -9%. The other
battery metal, lead, has overall trended down since July 2024, and is down -12%.
The uranium price has continued to reverse from a multi-year peak reached in early
2024 and is down -16%. While the long-term secular trend of increased global
support for nuclear power as a part of green energy plans likely remains intact, the
market seems to have viewed the short-term parabolic move in the metal as
unsustainable. The tin price is another metal that is still reversing from a major spike
from 2024, and while it declined through most of last year, it has picked up in January
2025 compared to this group, leaving it down -9% since July 2024.
Gold miner stock ETFs outpace rest of sector from mid-2024
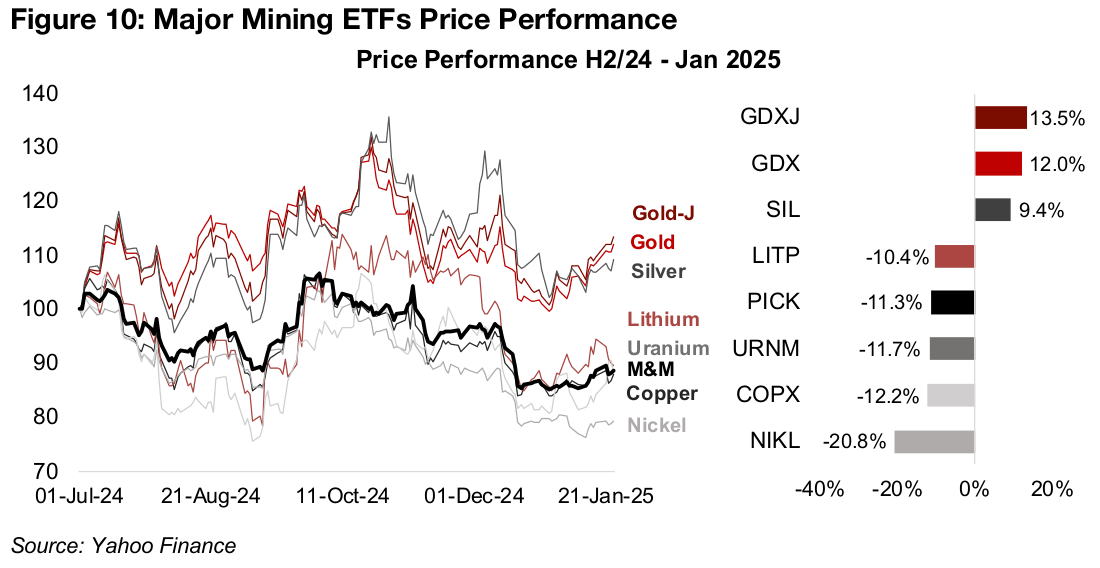
The gold price’s outperformance of the other major metals has seen the sector’s stock ETFs beat out other mining funds. The GDXJ ETF of gold juniors has led the group since July 2024, up 13.5%, just ahead of the GDX ETF of gold producers, gaining 12.0% (Figure 10). Even given the sluggish silver price, the SIL ETF of silver miners has been strong, gaining 9.4%. Most of the other major mining ETFs have seen similar substantial declines, with the LITP lithium miners ETF, PICK ETF of the largest Global Miners, URNM uranium miners ETF and COPX miners ETFs declining -10.4%, -11.3%, -11.7% and -12.2%, respectively. The biggest loss has come from the NIKL nickel miners ETF, down -20.8% as the sector is having issues with major global oversupply driven by a huge capacity expansion over the past decade.
Twenty-five years of silver versus gold and copper
Silver’s recent lagging of the gold price has led to the question of whether it will
eventually rise to close this gap, given that both are driven by monetary factors,
including the ongoing rate cuts by major global central banks. However, in contrast
to gold, the movement of which is nearly entirely attributable to monetary issues,
silver also has a large component of demand from industrial factors, similar to copper.
This makes silver a relatively rare hybrid in the metals space, with the market
sometimes focussing more on its monetary drivers, and seeing it track the gold price,
and at other times focussing on its industrial drivers and seeing it move more in
tandem with the copper price. However, there does not seem to be much consistency
in the way the silver has tracked gold or copper over the past twenty-five years,
making it difficult to estimate which of the two metals it will track and for how long.
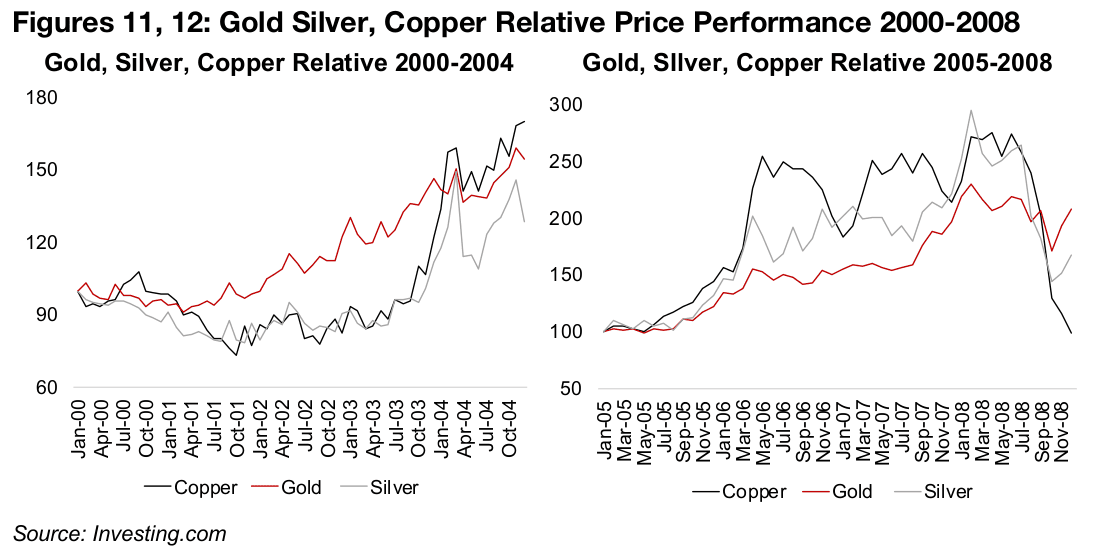
From 2000-2003 silver tracked very closely with the copper price. Both metals dipped
in the dotcom bust which started in 2000 following the late-1990s dotcom boom and
remained low well into 2003 (Figure 11). From 2004 to 2005 the global economy
started to pick up, seeing copper outperform, and silver starts to track gold more
closely (Figure 12). As the economy really booms from 2006 to 2007, silver’s
performance hovers between gold and copper, before it gaps up towards copper in
2008, just before the global financial crisis. While copper completely crashes into late
2008 and silver initially follows, it then ticks up along with gold given the huge
monetary expansion that follows in response to the crisis.
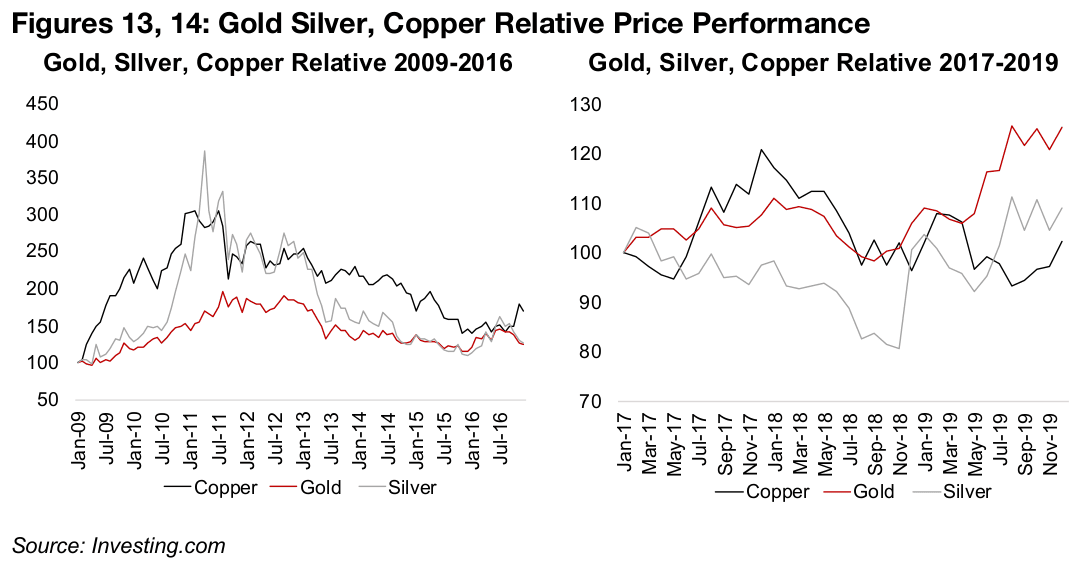
This underperformance of copper is brief as the huge monetary stimulus sees a major
rise in the metal from 2009 to 2010 (Figure 13). While silver and gold also gained
during this period, and moved quite closely in tandem, they lagged the copper price
significantly. Silver surges in 2010, even surpassing the copper price briefly in 2011,
and both of the metals track each other closely through to 2013. Even as additional
rounds of monetary stimulus come through from 2013 to 2016, inflation remains low
and silver declines, tracking closely with gold. From 2017 to 2018 there is a rare
period where the gold and copper move in tandem, but silver lags (Figure 14).
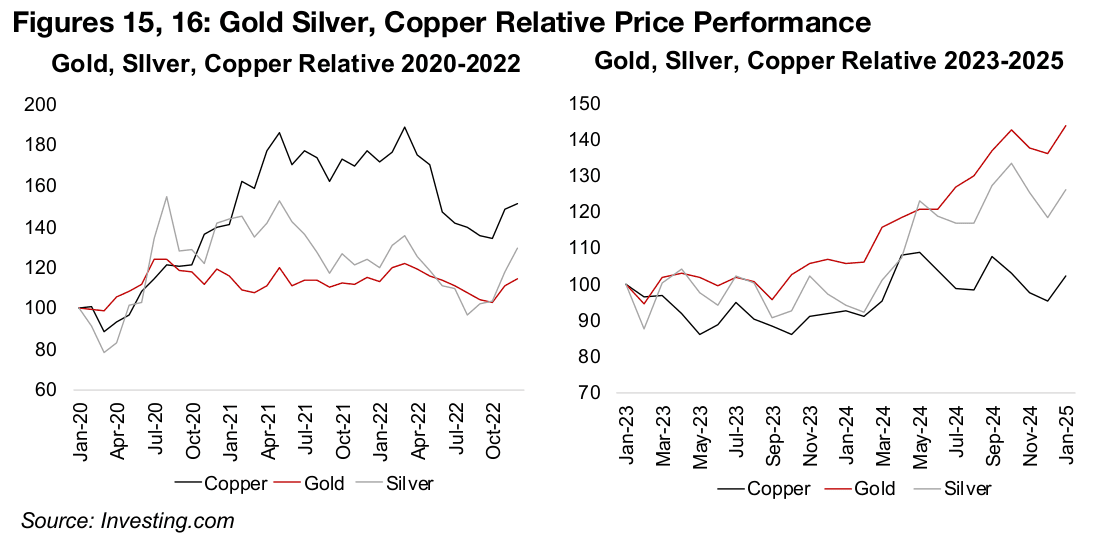
In late 2019, the first leg of the gold bull market begins, seeing the metal pull ahead
of both silver and copper. With the onset of the global health crisis there is a massive
monetary stimulus, which might have been expected to drive up both the gold and
silver prices. However, while the two move closely together from 2020 to 2023, they
remain relatively flat, and from 2020 to 2022 copper is the clear outperformer (Figure
15). The second leg of the gold bull market began in 2024, and this has also pulled
up silver overall, while copper has remained relatively flat (Figure 16).
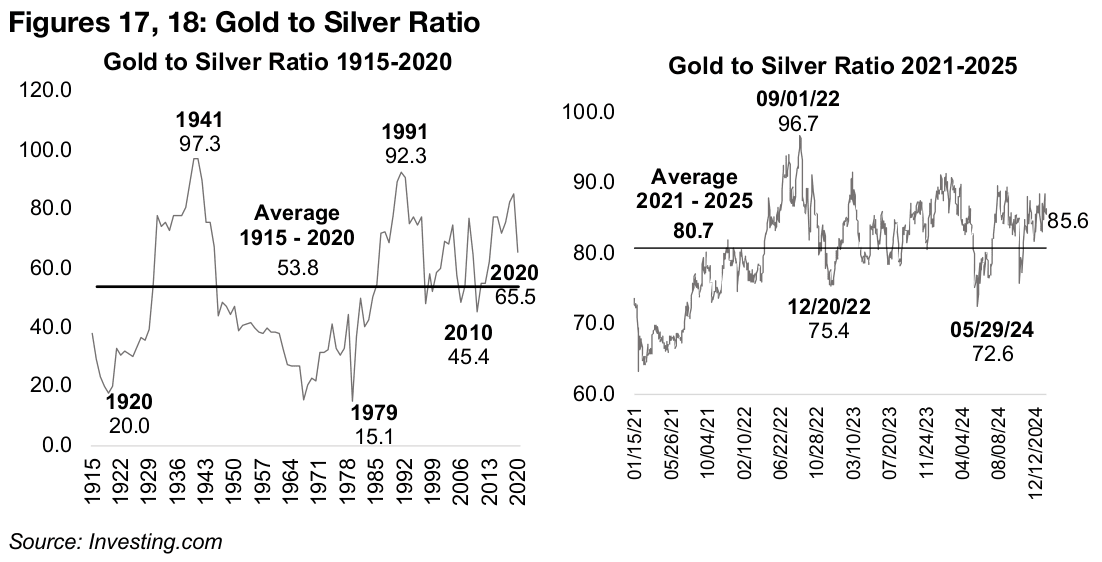
Overall, this shows that its remains unclear which of silver’s two drivers, monetary or industrial, will have the most effect on the metal in a given macroeconomic scenario. The gold to silver ratio may have somewhat better predictive power of the movement between the two metals, as the ratio tends to revert to the mean. The ratio has averaged 78.2x for the past ten years, and only slightly higher, at 80.7x, for the past four years, ranging between lows near 60 and highs of almost 100 (Figures 17, 18). With the ratio now 85.6x, mean reversion would indicate that either the silver price would need to rise, or the gold price decline moderately. However, long-term, the ratio dropped to lows near 15.0x, and the average from 1915-2020 was just 53.8x, which would imply much more room for silver to rise versus gold.
Large producers mostly rise and TSXV gold mixed
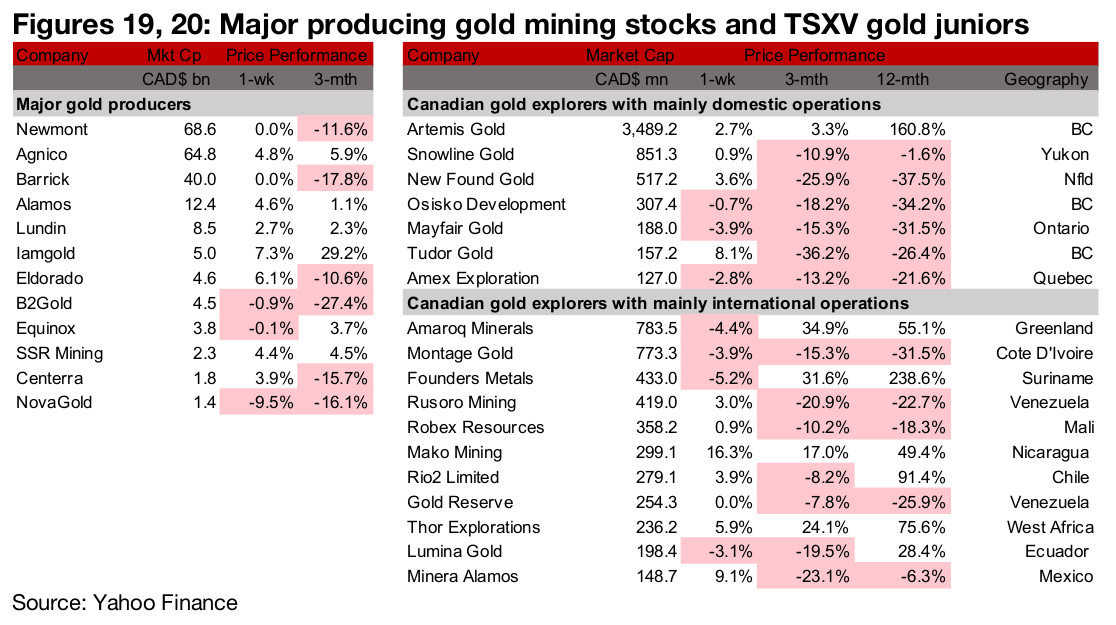
The largest gold producers mostly rose and TSXV gold was mixed (Figures 19, 20). For the TSXV gold companies operating domestically, Artemis reported advancement to the commissioning phase for Blackwater and New Found Gold appointed Mr. Keith Boyle as CEO (Figure 21). For the TSXV gold companies operating internationally, Amaroq was awarded the licence for Johan Dahl land (Figure 22).


Disclaimer: This report is for informational use only and should not be used an alternative to the financial and legal advice of a qualified professional in business planning and investment. We do not represent that forecasts in this report will lead to a specific outcome or result, and are not liable in the event of any business action taken in whole or in part as a result of the contents of this report.


