
June 12, 2020
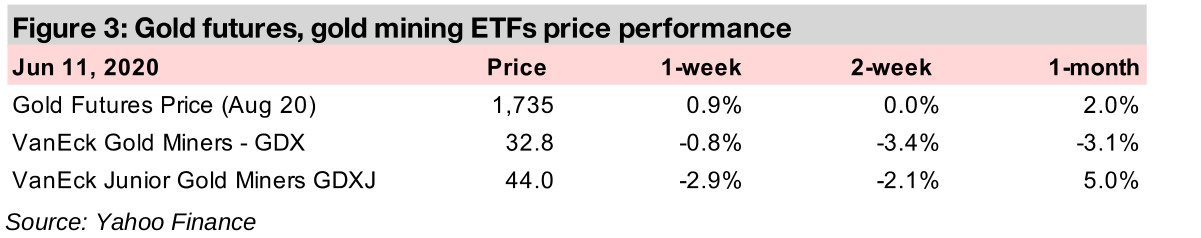
Gold rose 0.9% this week to US$1,735/ounce, off lows of US$1,689/ounce (Figure 1), and the third reversal off dips around US$1,700 in a month, as gold remains a preferred hedge against surging economic risk and a 75 year low in global growth.
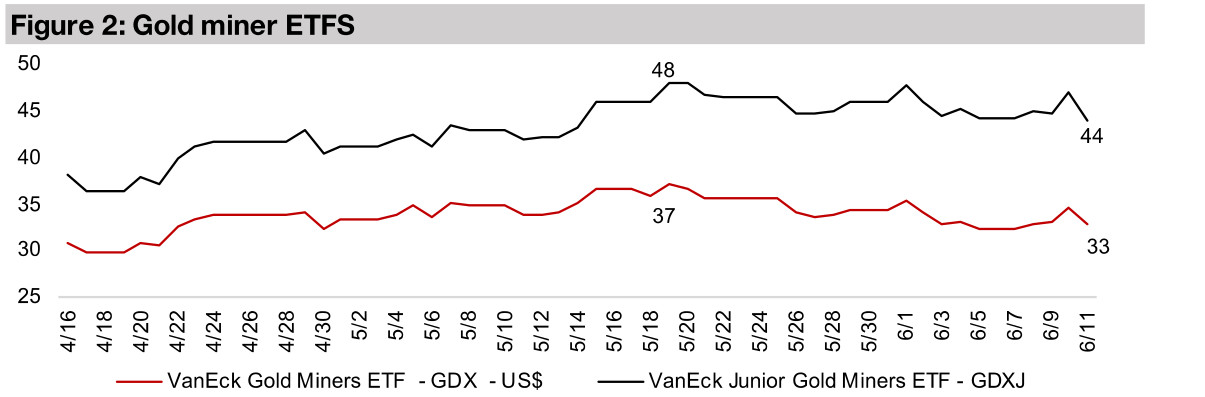
The large producing miners saw a mixed performance this week, and the GDX declined -0.8%, but the sector held up well overall versus the broader market, with the S&P declining -3.5% this week on continued economic and global health risks.
The Canadian junior gold mining stocks were hit more by the overall market decline than the producing miners this week, with the GDX down -2.9%, although a handful of names were still able to make gains, including Great Bear, In Focus this week.


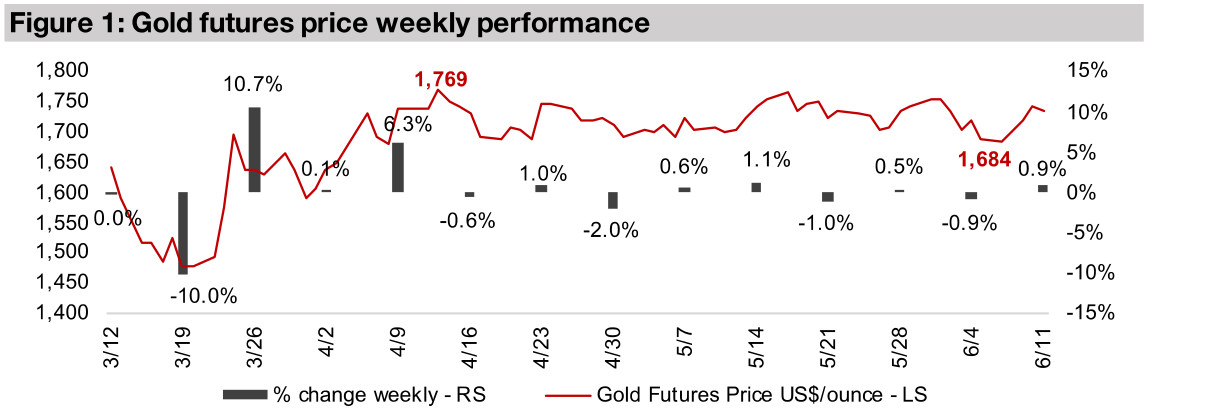
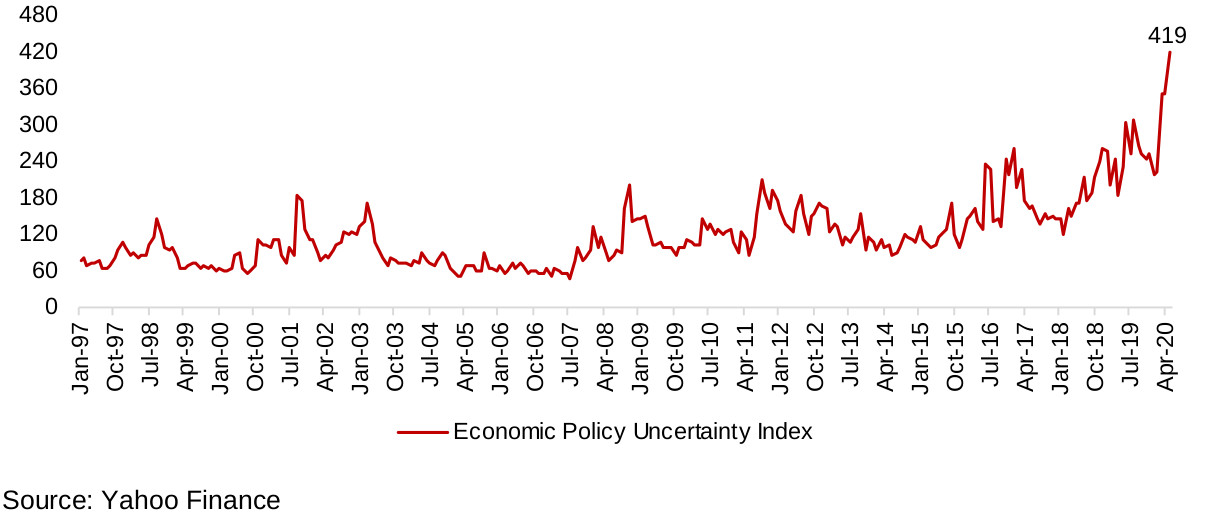
Gold was up 0.9% this week to US$1,735, rebounding off lows for the week of US$1,689 (Figure 1). This is the third time in a month that the gold price has dropped towards US$1,700 or below and reversed, suggesting considerable support at this level, while to the upside gold has not broken through US$1,770. This holding pattern seems to be because while risks remain severely high, they are well known to the market, and we have not seen them increase or decrease substantially over the past two months. One example quantifying just how high current risks are in a historical context is the global Economic Policy Uncertainty Index, which measures mentions of economic policy uncertainty in press reports, combined with policy uncertainty from economic forecasters, and other data points. After averaging 110 for over twenty years, from the start of the index in 1997 to 2018, the index started to rise in 2019, and has spiked to 419 in May 2020 from just 217 in January 2020 (Figure 4). If rising economic risk does in fact correlate to a strong gold price, this figure certainly points to support for gold at current levels, and potentially well above them. Some major investment banks are now targeting US$1,800/ounce or above for this year.
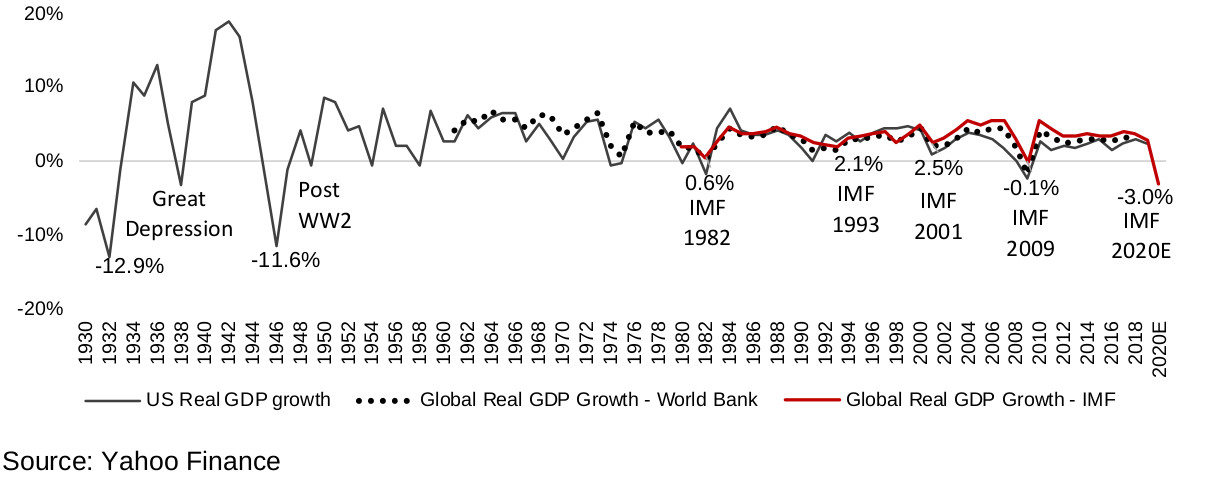
Meanwhile global real GDP growth in 2020 is now forecast to be at its lowest level since the 1930s and 1940s. The IMF now forecasts -3.0% real global GDP growth for 2020, a greater contraction than the recessions of 1982, 1993, 2001 and 2009 (Figure 5). While the IMF global GDP growth data go back only as far as 1980, and World Bank data only to 1961, if we use US growth as a proxy for global growth prior to 1961, the last time growth contracted by more than the 2020 forecast was the -12.9% decline in 1932 during Great Depression, or the -11.6% decline in 1946 following World War Two.
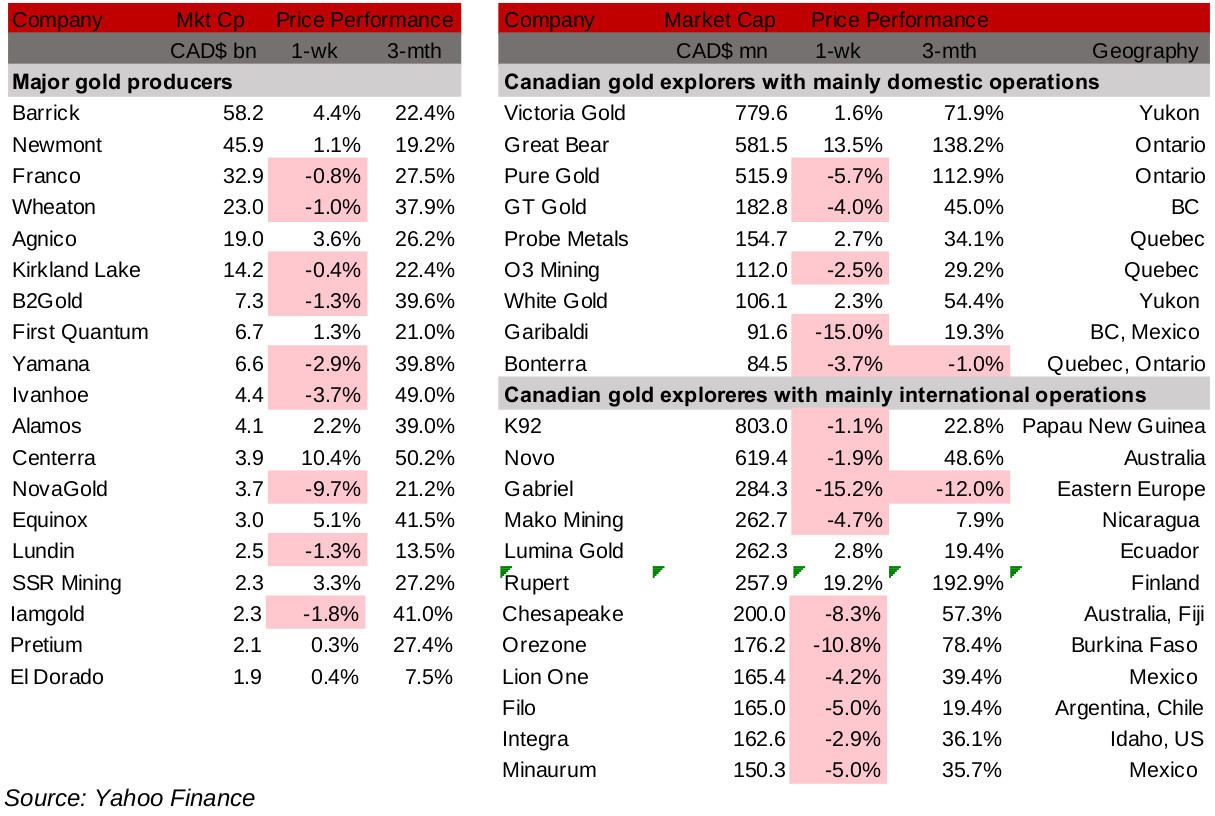
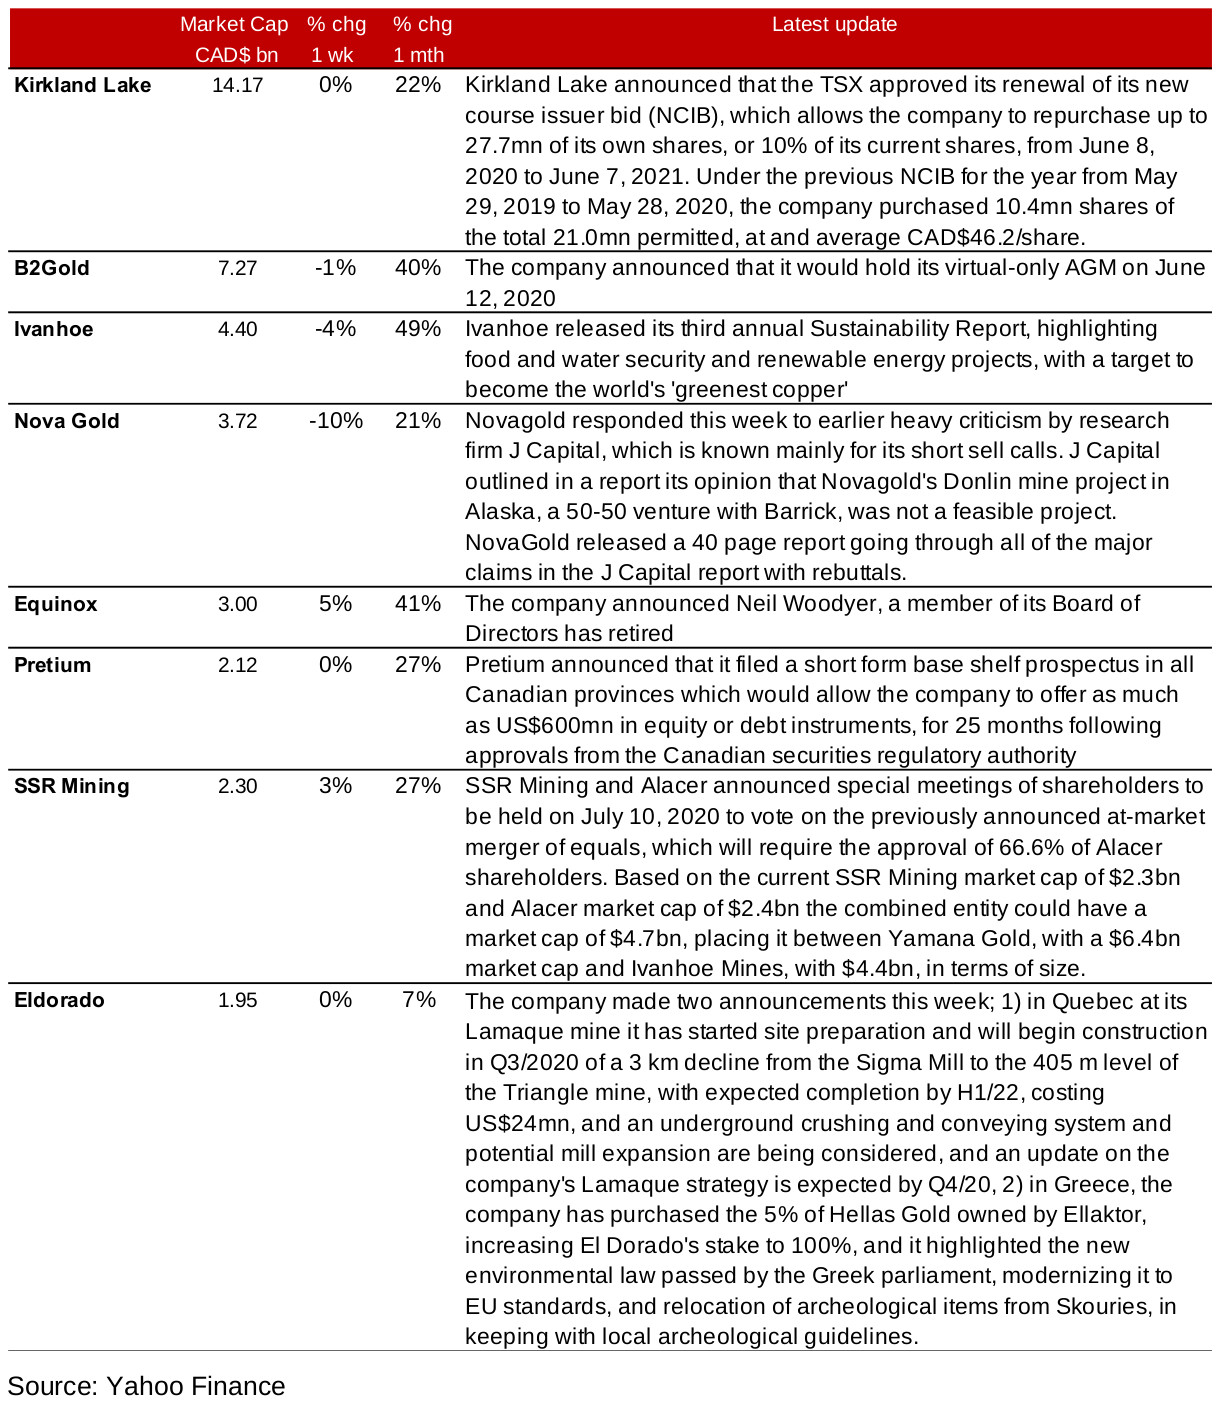
The major producing gold mining stocks saw a mixed week, and overall held up well versus the major decline in global stock markets at the end of the week (Figure 6). Major announcements from the producing miners included Kirkland Lake renewing its NCIB to allow it to make buybacks of up to 10% of its shares for the next year, Novagold's release of a forty page rebuttal of an aggressive attack on the viability of its Donlin project in Alaska by J Capital Research, Pretium's filing of a base shelf prospectus allowing it to offer $600mn in equity or debt instruments, SSR Mining and Alacer announcing special shareholders meetings for approval of their previously reported planned merger, and Eldorado starting the construction of a decline at Lamaque and reporting some regulatory advancements in Greece (Figure 8). Other news included an AGM update by B2Gold, the release of a sustainability report by Ivanhoe Mines and the retirement of a board member at Equinox.
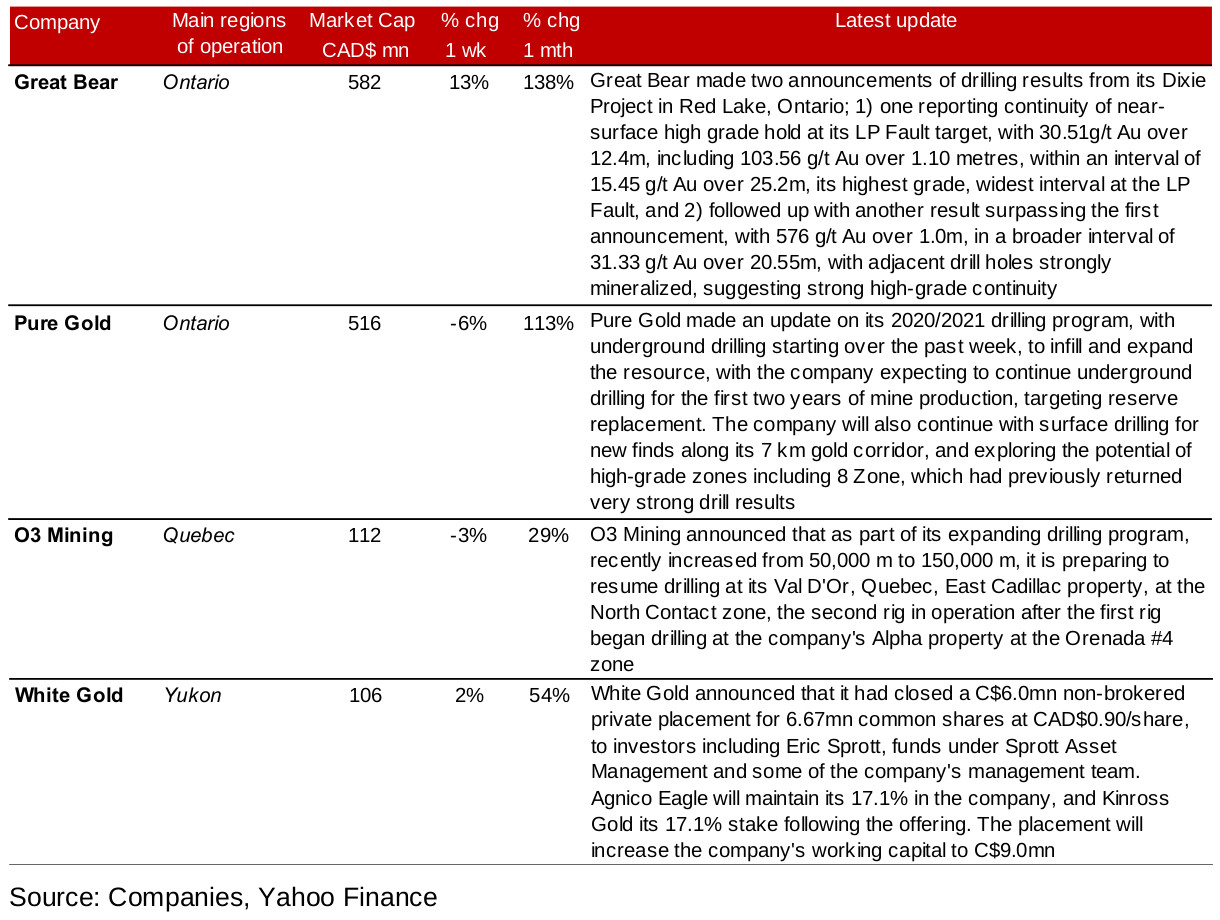
The Canadian operating junior gold mining stocks saw a mixed performance this week (Figure 7). Great Bear Resources saw the biggest gain of the group, up 13.5% as its reported its best drilling results so far at the LP Fault at its Dixie Project, only to surpass these results with an announcement of an even better second set of drilling results (Figure 9). Both Pure Gold and O3 Mining announced updates to their drilling plans, although no new drilling results were released, and both saw moderate declines, by -6% and -3%, respectively, likely pressured more by the broader stock market decline this week than reactions to their press releases. White Gold ticked up 2% as its announced that it had completed a non-brokered private placement.
The larger cap foreign operating Canadian junior mining stocks mainly declined this week (Figure 7). Only Rupert Resources saw substantial gains this week, up 19.2% on a set of strong drilling results from its Pahtavaara mine (Figure 10). Other major announcements included Novo's purchase of exploration licenses for Mt. Elsie in Western Australia, Lumina Gold's revised PEA for its Cangrejos project, with a substantially increased NPV, and Minaurum's closing of a non-brokered private placement, but only Lumina saw moderate share price gains, while the other two stocks fell. Other news included Mako's appointment of a new member to its board of directors, and Integra provided details of its AGM.
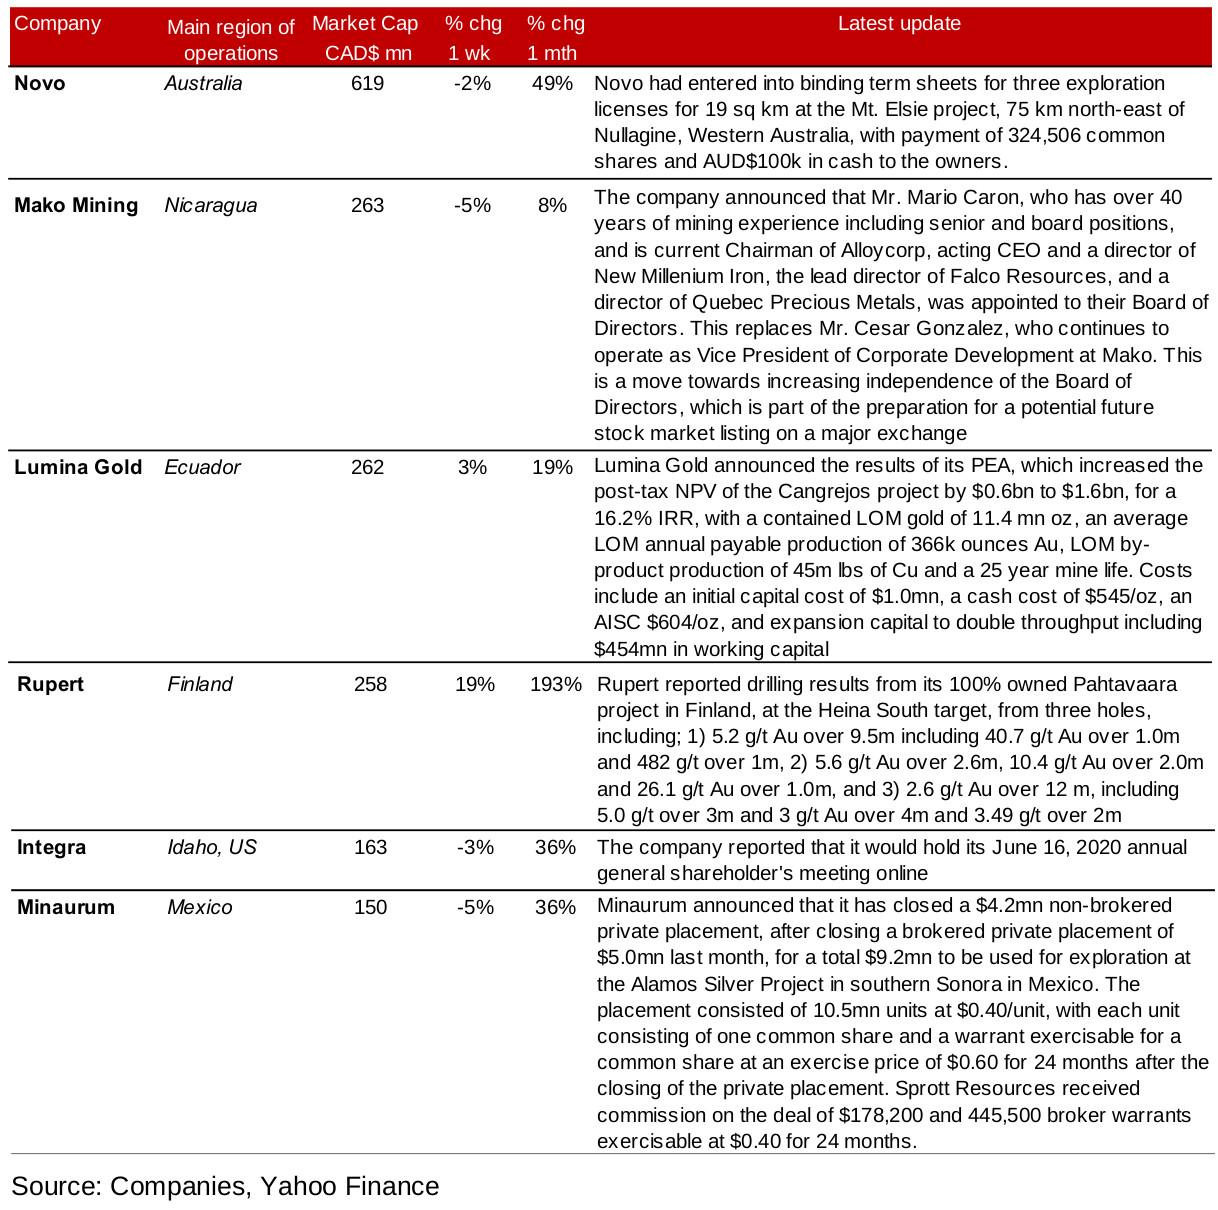
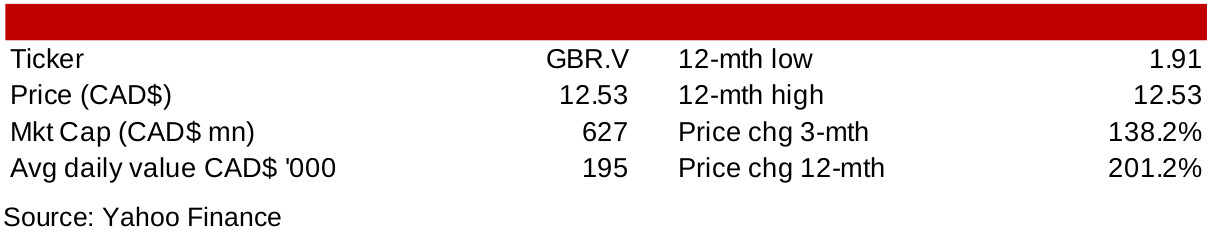
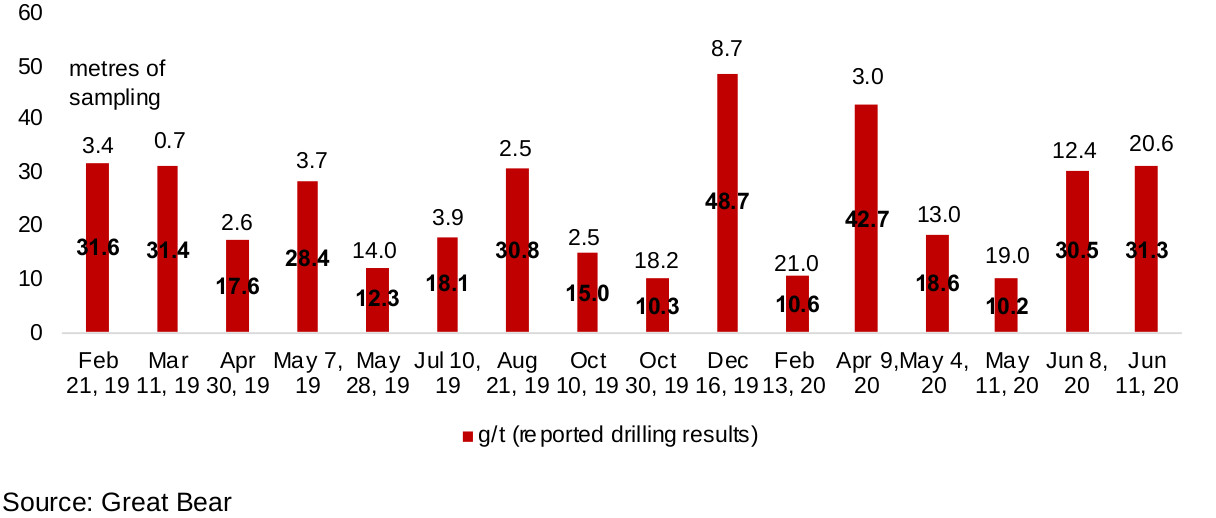
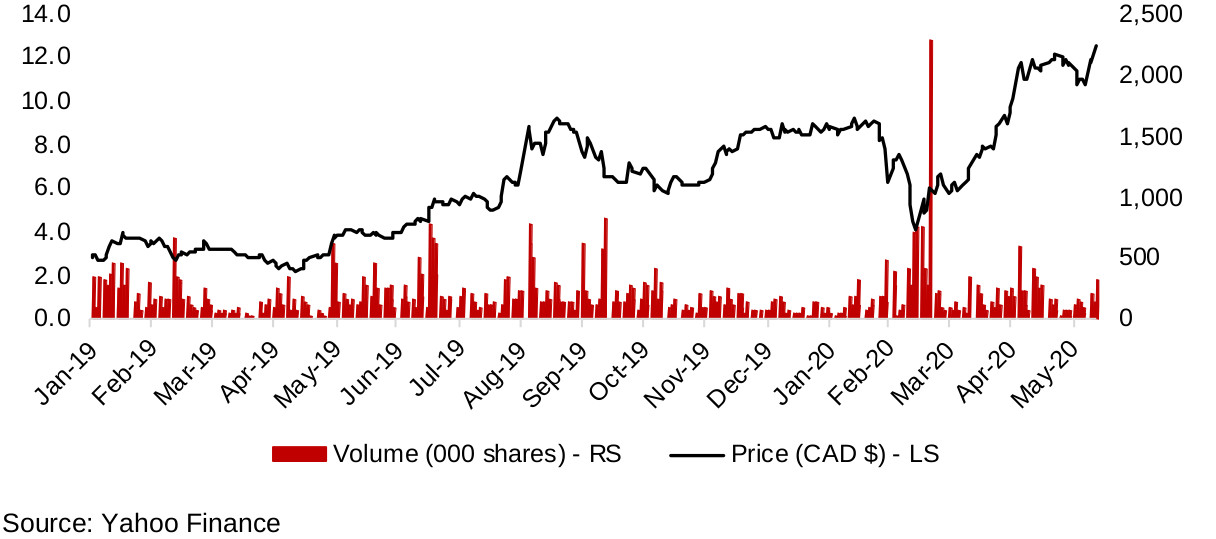
Great Bear Resources continues to be one of the strongest performing larger cap Canadian junior mining stocks, gaining 138.2% over the past three months, and 201.2% over the past 12 months. The company's stock was up 13% this week on the announcement of two sets of drilling results, the first showing its strongest result to date at its Dixie Project's LP Fault zone in Red Lake, Ontario, only to follow this up within the week with an even better drilling result. The first announcement, on June 8, 2020, reported drilling results of 30.51g/t Au over 12.4m, including 103.56 g/t Au over 1.10 metres, within an interval of 15.45 g/t Au over 25.2m, which was at that point the company's highest grade, widest interval at the LP Fault (Figure 12). However, within a few days, on June 11, 2020, the company reported an even better interval, with 576 g/t Au over 1.0m, in a broader interval of 31.33 g/t Au over 20.55m. Also, importantly, for both finds, the company reports that they are seeing increasing evidence a high-grade continuity in the LP Fault.
The Red Lake district continues to see rising interest from gold exploration firms, given the continued success of the two major plays there, Great Bear, and Pure Gold Mining, which have both seen substantial share price gains over the past year. While Pure Gold Mining is at a more advanced stage of development, and is already targeting its first gold pour this year, its market cap is CAD$516mn compared to Great Bear's CAD$582mn, because the continued strong drilling results and increasing evidence of high continuity at Great Bear's Dixie project suggests a larger potential resource. For more on these two operators, and other smaller juniors that are exploring in the area, see our Red Lake District Overview report.
Disclaimer: This report is for informational use only and should not be used an alternative to the financial and legal advice of a qualified professional in business planning and investment. We do not represent that forecasts in this report will lead to a specific outcome or result, and are not liable in the event of any business action taken in whole or in part as a result of the contents of this report.
Author
Ben McGregor authors the Weekly Roundup at CanadianMiningReport.com, providing sharp analysis of the metals and mining sector. With a talent for spotting trends, Ben distills complex market shifts into clear, engaging insights on TSXV junior miners. His weekly updates cover gold, copper, uranium, and more, blending data-driven perspectives with a knack for identifying opportunities. A vital resource for investors, Ben’s work navigates the dynamic junior mining landscape with precision.