October 21, 2024
Gold Price Forecasts Surge
Author - Ben McGregor
Silver spikes and iron ore struggles
Silver spiked even more than gold, up 6.7%, likely on a combination of supply weakness and a catch up with gold, given the metal’s monetary drivers, while iron ore has continued to struggle on demand side issues particularly in China.
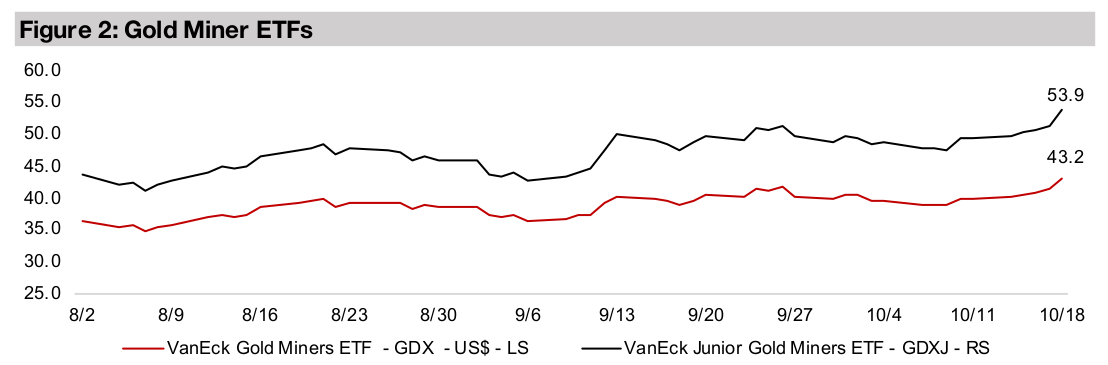
Gold stocks jump on metal gain while equities edge up
Gold stocks jumped with the GDX up 7.7% and GDXJ rising 8.8% on the metal’s gain and a moderate rise in large cap equity markets, with the S&P 500 adding 0.6% and Nasdaq up 0.3%, while small caps outperformed with a 1.9% gain in the Russell 2000.


Gold Price Forecasts Surge
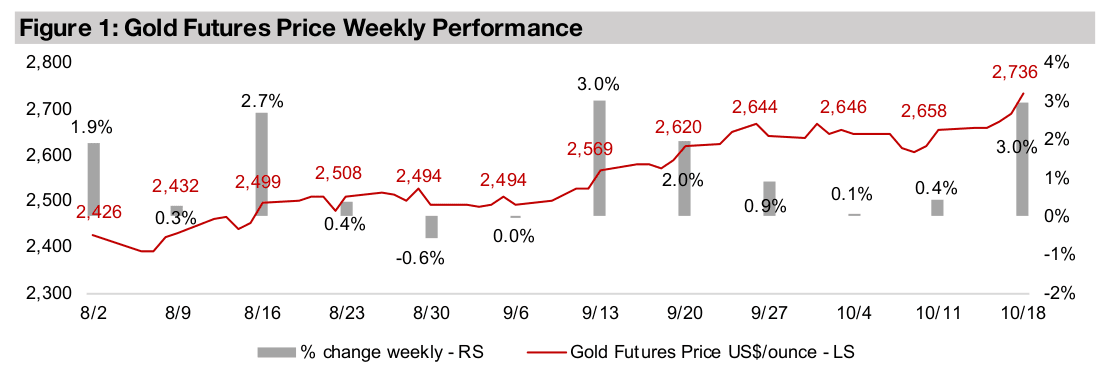
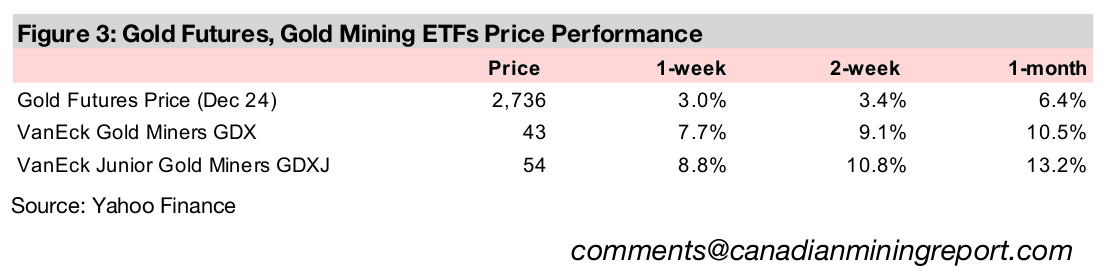
The gold price rose 3.0% to US$2,736/oz, breaking strongly through the
US$2,700/oz level for the first time ever, on limited major economic news, but with a
range of drivers continuing in the metal’s favour. Gold stocks surged by a numerically
aesthetic amount, with the GDX up 7.7% and GDXJ gaining 8.8%. This came even
as large cap US equity markets were actually subdued, with the S&P 500 rising 0.6%
and Nasdaq only edging up 0.3%. However, small caps outperformed, which likely
assisted in propelling the gold juniors, with the Russell 2000 up 1.9%.
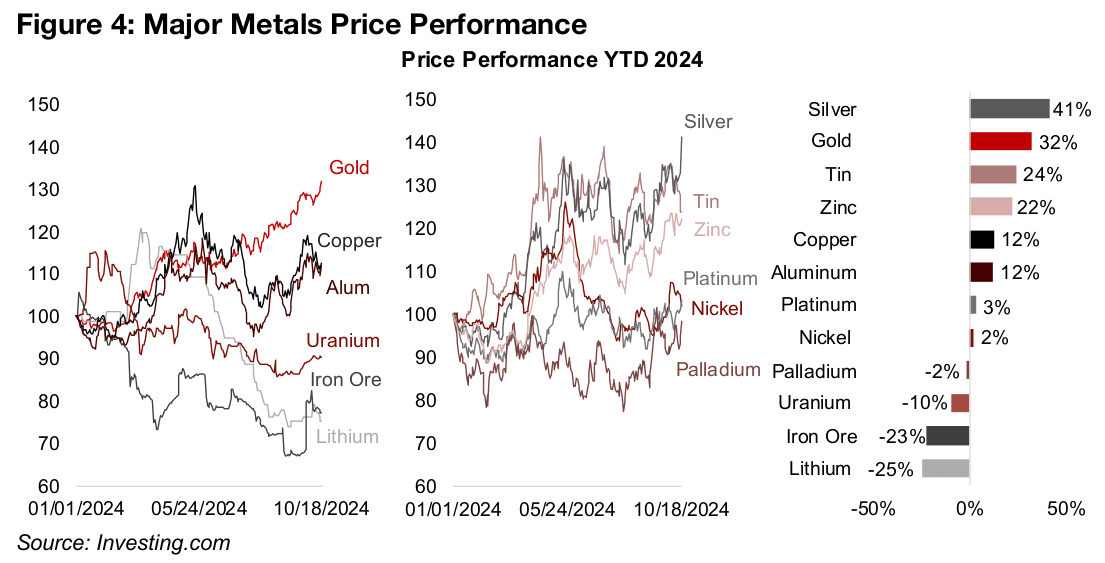
While gold’s gains put it up 32% for the year, it is still only the second best performer
after silver, which surged 6.7% this week to a 41% year to date gain (Figure 4). With
copper sliding -2.4% for the week and aluminum flat, silver’s jump did not seem to
be driven by a broader pickup in global industrial demand, but more from supply
weakness and a catch up with gold on monetary factors. Iron ore and lithium remain
the big underperformers, down -23% and -25%, respectively, with both affected
especially by China, with lithium facing falling EV sales growth and rising supply of
processed metal from the country and iron ore lower on a construction slowdown.
Gold’s move indicates strong Q3/24 and has driven target upgrades
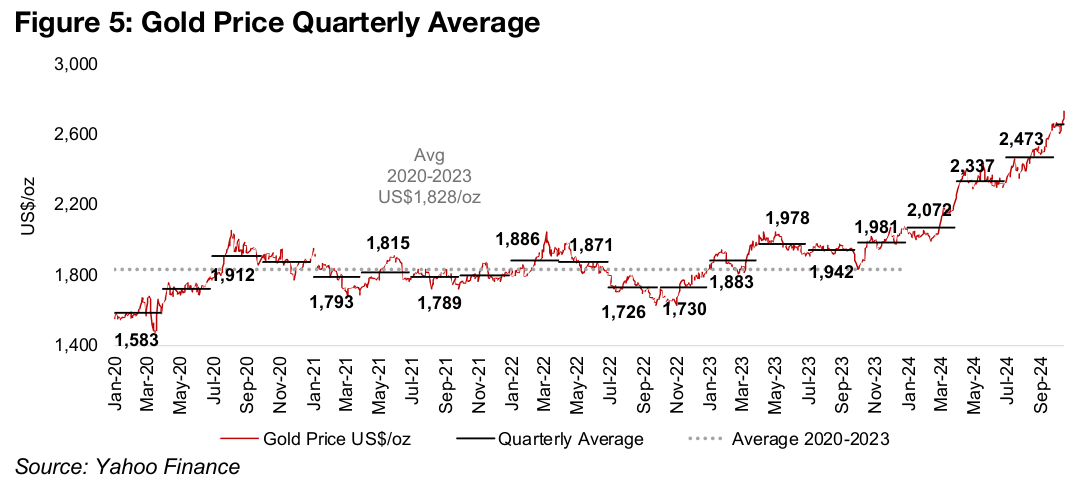
Gold has continued an increasingly parabolic move, with the Q3/24 average at US$2,473/oz, adding US$136/oz from the previous quarter after rising US$265/oz in Q2/24 (Figure 5). It was really only first quarter this year when it finally broke out of a stubborn average around US$1,828/oz from 2020-2023, ranging from US$1,726/oz in Q3/22 to US$1,981/oz in Q4/23. Gold companies already had a very strong Q2/24 on the price rise and production gains, and with the price certainly continuing up, and production likely still robust year on year, Q3/24 could be another strong quarter.
There have been substantial upgrades to gold price targets in recent months, with major jumps especially from mid-2024, when the highest estimate of the major investment banks was just US$2,365/oz (Figure 6). They have become much more bullish since, with not one, but three banks, Citigroup, Macquarie and Goldman now forecasting US$3,000/oz gold by 2025, about US$650/oz above their mid-2024 gold targets and even the lowest estimate, from Standard Chartered, is still US$2,625/oz.
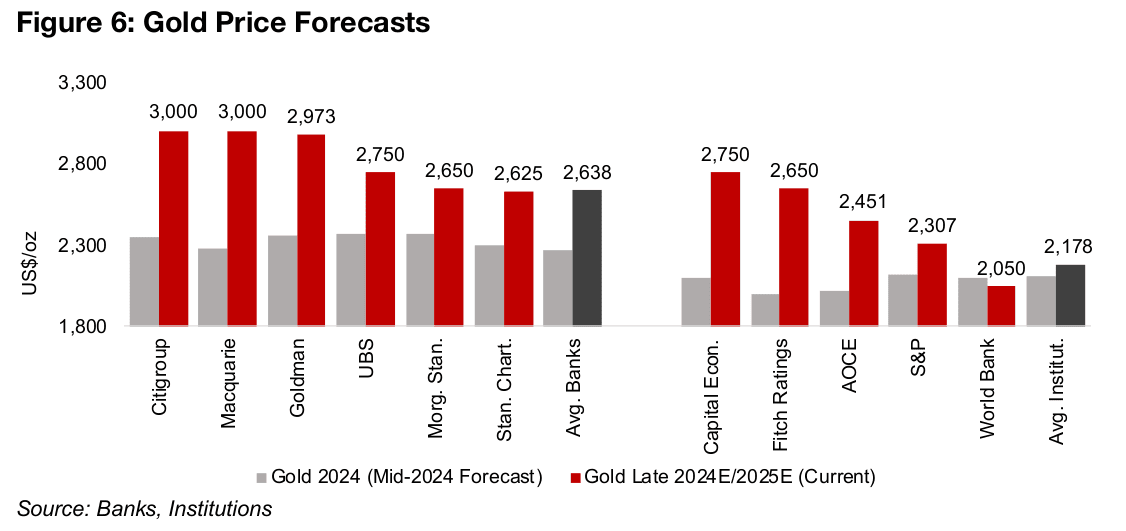
While the institutions and rating agencies have also made upgrades, their US$2,178/oz average is far below the banks’ US$2,638/oz, and they may again lag the realized gold price as they have for several years. However, this has been dragged down especially by a low World Bank target of US$2,050/oz, an older forecast from April 2024 that is likely to rise in the new outlook this month. The institutions are also not all cautious, with the highest estimates at US$2,700/oz and US$2,650/oz.
Money supply expansion remains a key gold driver
Gold’s rise continues to raise the question of just how far the price can go and
whether it has entered a bubble phase. Clearly several investment banks see at least
another US$300/oz to come given US$3,000/oz targets, and historically they have
not tended to substantially overestimate the gold price. Whether the price could still
be considered ‘reasonable’ if it hits this level comes down especially to how much
central banks continue to cut rates and expand the money supply, in our view.
We see this as the root driver of gold long-term with other factors like real yields or
the US$ important short-term, but to a large degree a function money supply shifts.
The value of the global gold stock tends to be a steady proportion of the global money
supply, with most central banks viewing it as an important currency and key
component of reserves. An increase in fiat currency therefore tends to drive an
increase in the gold holding value mainly through a rise in the price as production
growth is low, at about 2.0% per year. If the money supply rises enough, therefore,
US$3,000/oz may not be bubble territory at all, and could be fundamentally justified,
and any overexuberance by the market could see the price jump well above this level.
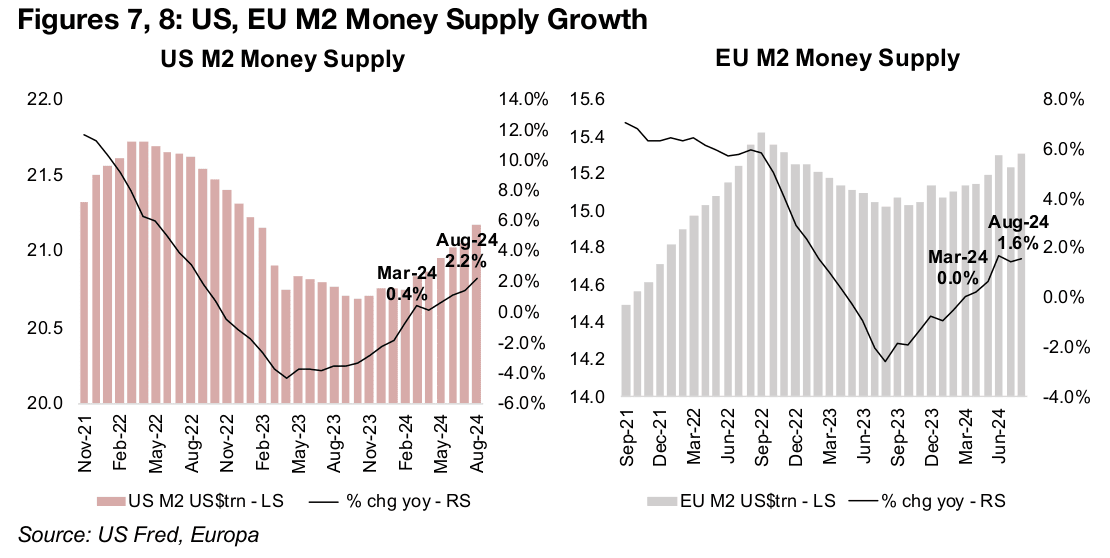
The money supply of the both the US and European Union (EU) has been rising year
on year now for well over six months. A contraction in money supply growth for both
bottomed in mid-2023 and an expansion started in March 2024, and has increased
to 2.2% in the US and 1.6% for the EU as of August 2024 (Figures 7, 8). Further
expected rate cuts for both regions should continue to expand the money supply,
although the pace of these cuts is still debatable. China, which has the largest money
supply in the world, is also clearly looking towards a continued monetary expansion
with its stimulus measures.
Other major global central banks beyond these three have also been in a rate cutting
phase that started this year, which is widely expected to continue into 2025 and
should also contribute to boosting the global money supply. With a gold production
growth estimate of just 3.0% for 2024, this implies that the gold price may need to
rise to maintain the ratio of the value of the global gold stock to the global money
supply, and could explain some of gold’s recent strength.
Gold ETF inflows at four-year highs
One indicator of whether gold has started to become a bit frothy is ETF inflows, which
tends to represent retail interest, with institutions generally investing in the metal
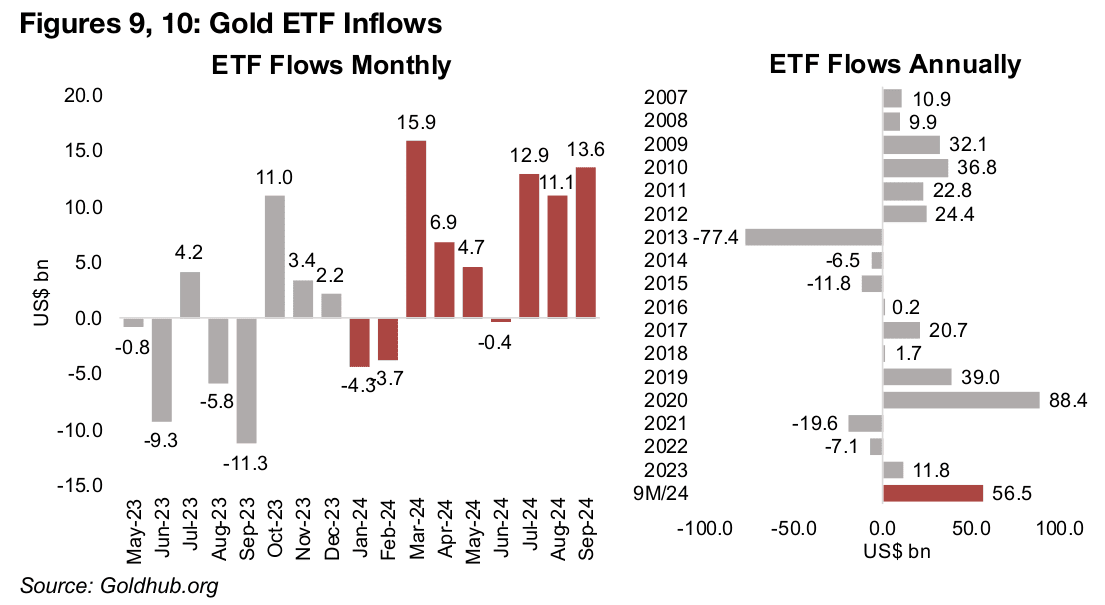
through other vehicles. There has clearly been a pickup in the past three months, with
inflows of US$12.9bn, US$11.1bn and US$13.6bn in July, August and September
2024, respectively. (Figure 9) This drove up inflows to US$56.5bn for the first nine
months of 2024, far ahead of the past three years, with inflows of US$11.8bn in 2024
and outflows in 2022 and 2023 of US$-19.6bn and US$-7.1bn (Figure 10).
The benchmark for a boom year for gold ETF inflows is 2020, at US$88.4bn, far above
any year in the past two decades, and if additions continue at the Q3/24 rate, this
year could be close to matching this previous peak. However, the strong inflows
could well continue into 2025 as there remains strong fundamentals driving gold as
we have outlined. Therefore, while the inflows do show that the market is heating up,
we still do not see it nearing a point of boiling over. The factors that would cool down
the market would be a plunge in political risk and a return to low rates with extremely
low inflation, similar to the mid-2010s, which seems very unlikely over the next year.
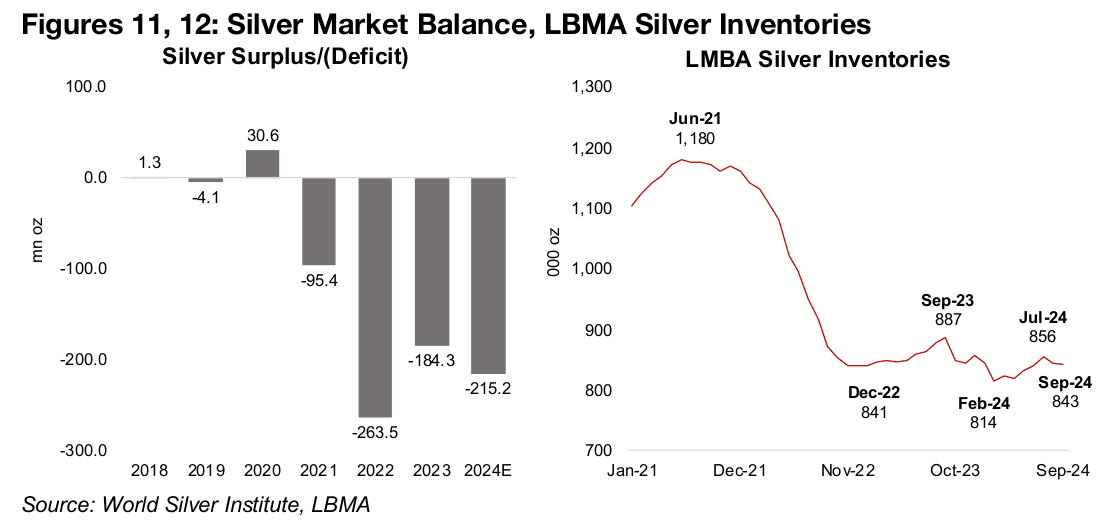
Major silver deficit expected, gold to silver ratio reverts to average
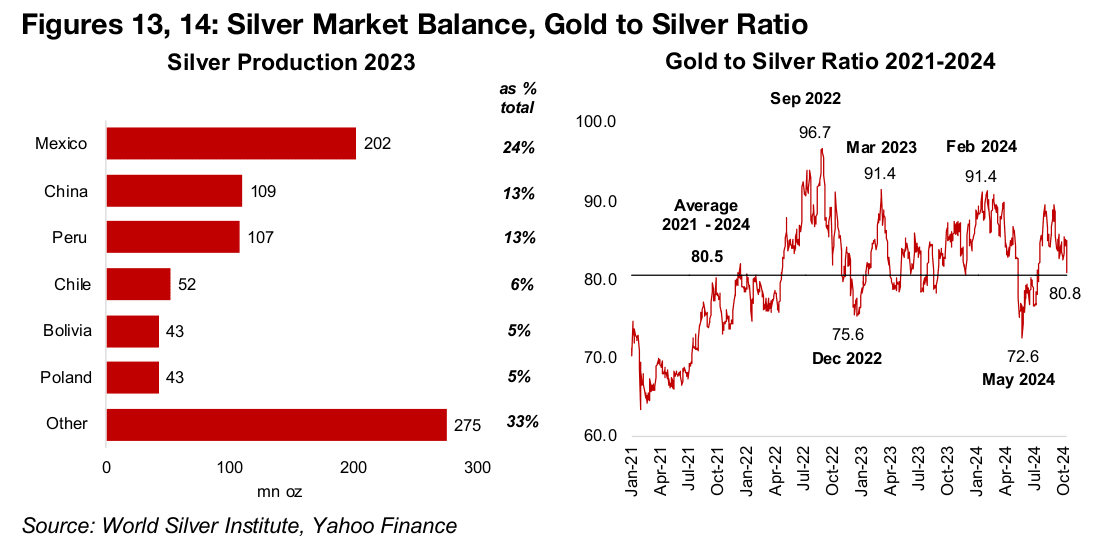
The jump in the silver price has likely been driven especially by continued supply side issues, with the fourth consecutive year of major deficits expected in 2024 (Figure 11). LMBA silver inventories dropped to 843 mn oz in September 2024 from the peak for the year of 856 mn oz in July 2024, with the range since 2023 more than 300 mn oz below the level in 2021 (Figure 12). While the most recently reported output from the largest producers Mexico, Peru and China was strong year on year, this was from July 2024, and growth could have slowed since (Figure 13). Also, even if production from these countries has remained robust, they are just over 50% of global silver production and there may have been a slowdown from the rest of the world.
Silver’s move has seen the gold to silver ratio fall to 80.8x, or almost to the 80.5x
average since 2021 (Figure 14). Silver can be considered a hybrid, driven both by
monetary factors like gold, but also by the industrial cycle, similar to copper, and it
can track either of these more closely depending on the point in the economic cycle.
For now, clearly the monetary factors are taking precedence. With the ratio more in
balance now, it is less clear which of the two metals may outperform from here, and
they may even both ascend in tandem. Of course there still remains the risk an
industrial slowdown that could drag down silver along with the copper price.
In recent months we had noted that gold’s ratio versus some commodities, including
other silver, oil and the broader commodities index had become elevated versus
historical averages. We saw a higher probability then of a rise in these other
commodities as more likely to bring these ratios into balance, than a decline in gold,
and at least for the silver price, this has been the case. However, the gold to oil and
broader commodities index ratios have continue to rise to levels well above their
averages since 2021.
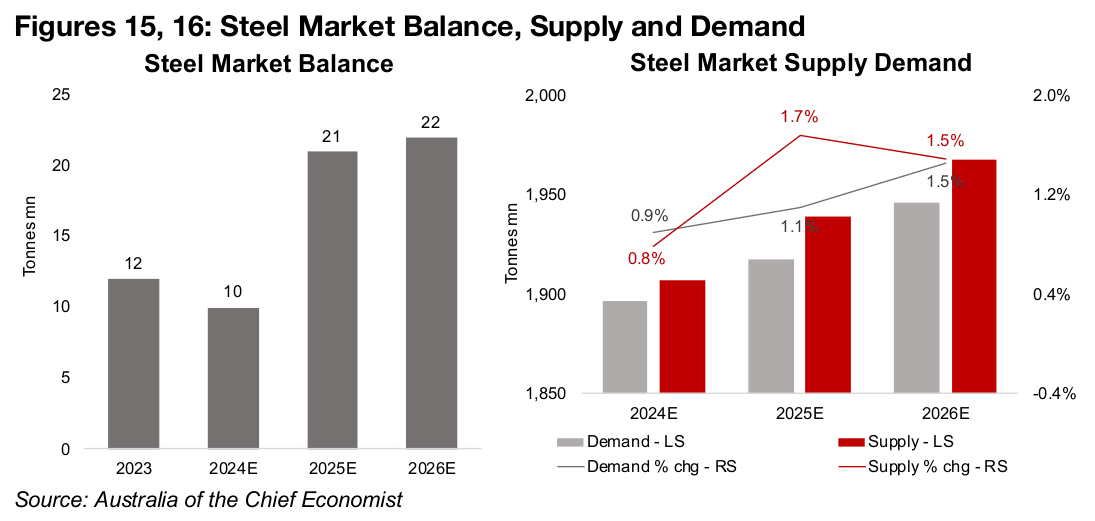
Iron ore under pressure from weak China construction demand
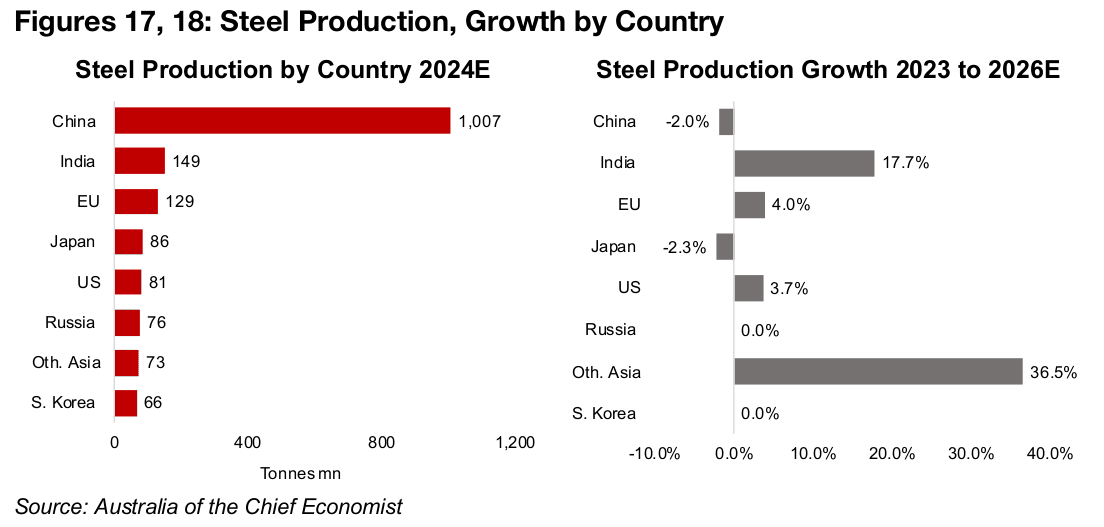
The iron ore price has been under pressure especially from weakness in the construction industry in China. This reduces steel demand, which is the main end use for iron ore, with China by far the largest global market for both. The steel market is forecast by Australia’s Office of the Chief Economist (AOCE) to be in a slight surplus in 2024, which would widen in 2025 and 2026, and could continue to pressure iron ore prices (Figure 13). Global steel supply is forecast to jump 1.7% versus only a 1.1% rise in demand in 2025 by the AOCE, with both to rise 1.5% in 2026 (Figure 16). While China is by far the largest producer of steel, at 60% of the world total (Figure 17), the supply expansion is not expected to come from the country but instead India and Other Asia, with output to rise 17.7%% and 36.5% from 2023-2026E (Figure 18).
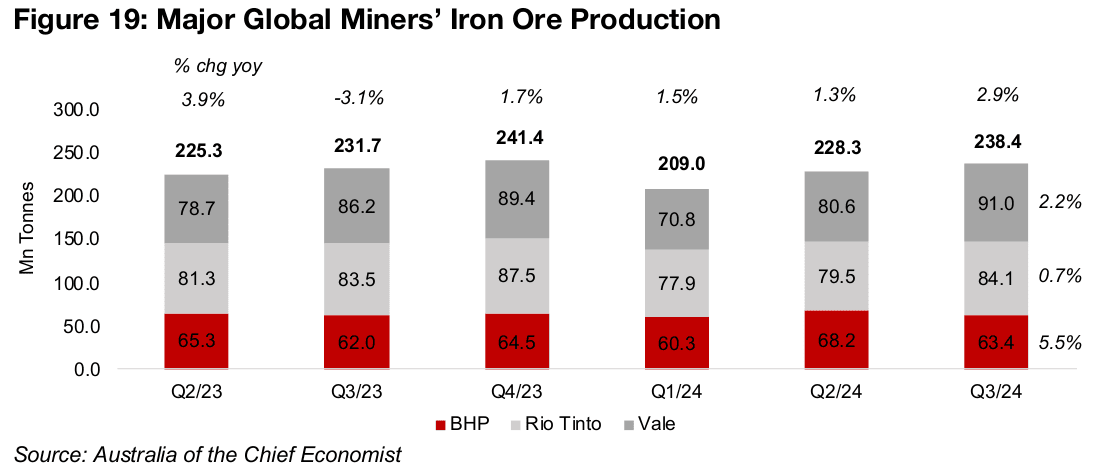
Iron ore production for Q3/24 from majors BHP, Rio Tinto and Vale does not indicate
that the situation may be improved by declining supply, with their aggregate output
up 2.9% year on year, the highest since Q2/23 (Figure 19). This continued pressure
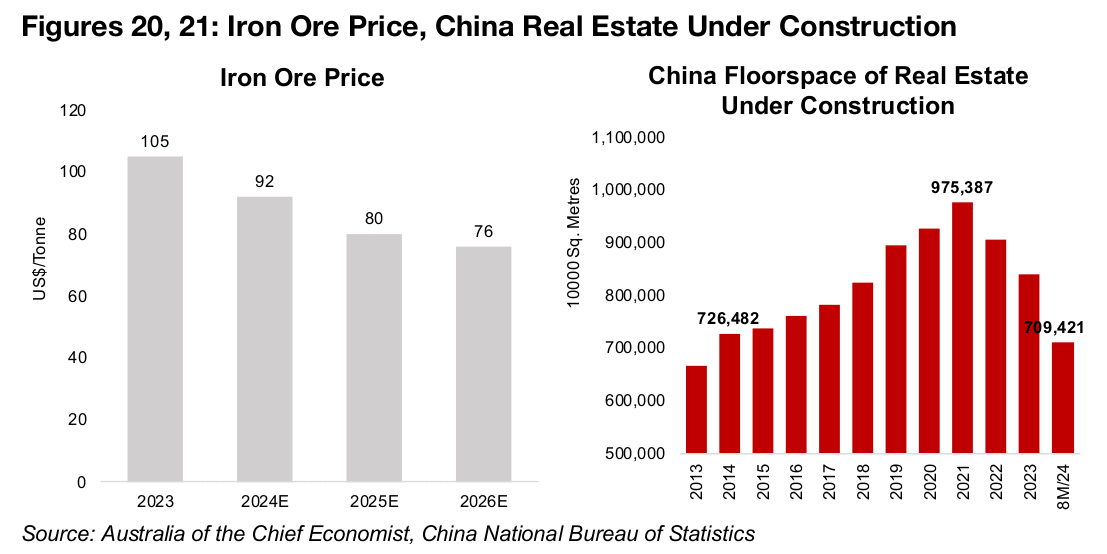
on the sector has led the AOCE to forecast a weakening of iron ore from US$92/tonne
in 2024 to US$80/tonne in 2025 and US$76/tonne in 2026 (Figure 20).
This implies the AOCE does not expect China’s recent stimulus to boost its flagging
property market and drive a strong recovery in steel and iron ore demand over the
next two years. One key indicator for the sector in China is Floorspace of Real Estate
Under Construction, which has continued to decline in 2024, to just 709,421 units of
10,000 sq. metres, from 838,364 at the end of 2023 (Figure 21). This is well down off
the highs of 975,387 in 2021, and now back to levels around 2014 of just 726,482.
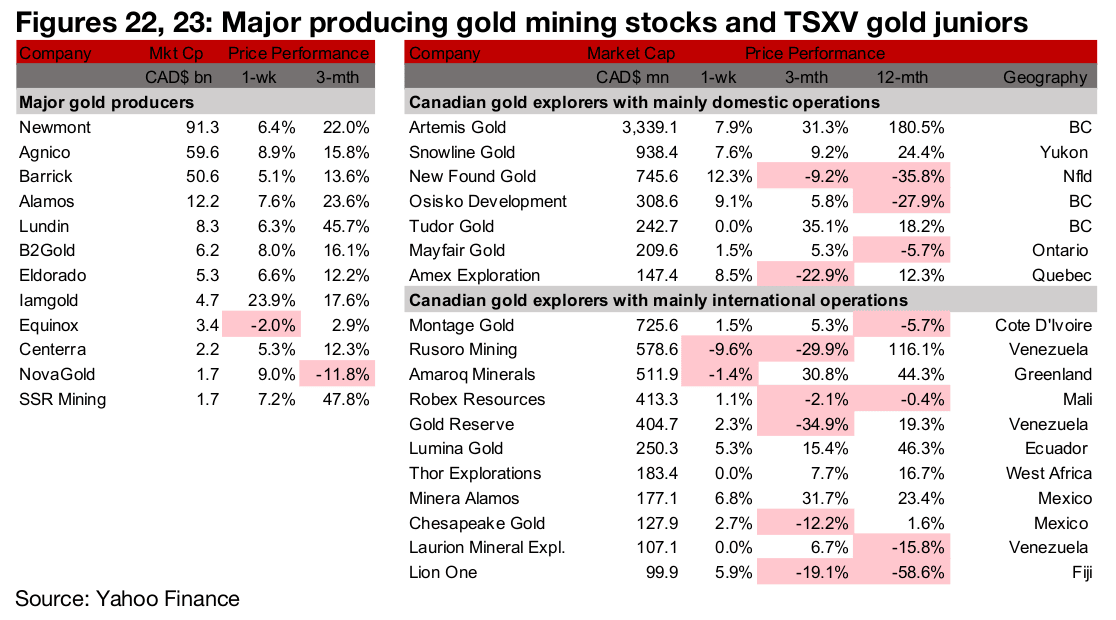
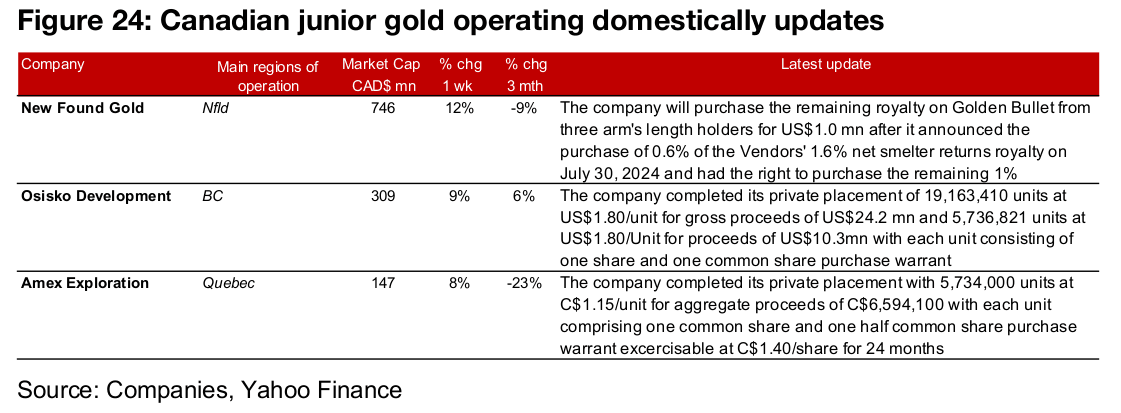
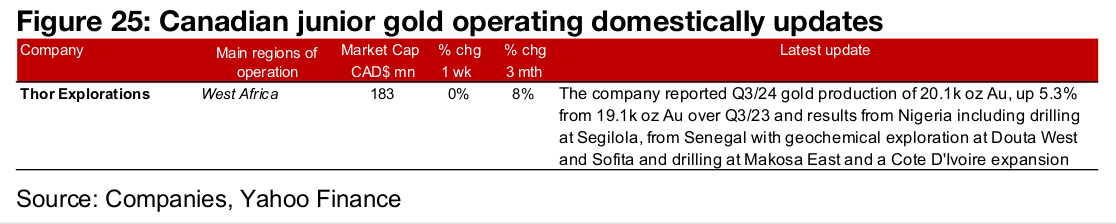
Major producers and TSXV gold almost all gain
Almost all the major gold producers and TSXV large gold were up on the continued rise in the metal price (Figures 22, 23). For the TSXV gold companies operating domestically, New Found Gold announced it would purchase the remaining royalty on Golden Bullet and Osisko Develpoment and Amex Exploration completed their private placements (Figure 24). For the TSXV gold companies operating internationally, Thor Explorations reported Q3/24 production and an update on its regional exploration activities (Figure 25).
Disclaimer: This report is for informational use only and should not be used an alternative to the financial and legal advice of a qualified professional in business planning and investment. We do not represent that forecasts in this report will lead to a specific outcome or result, and are not liable in the event of any business action taken in whole or in part as a result of the contents of this report.