July 23, 2021
Gold passes the market-dip test
Author - Ben McGregor
Gold holds up in stock market dip earlier this week
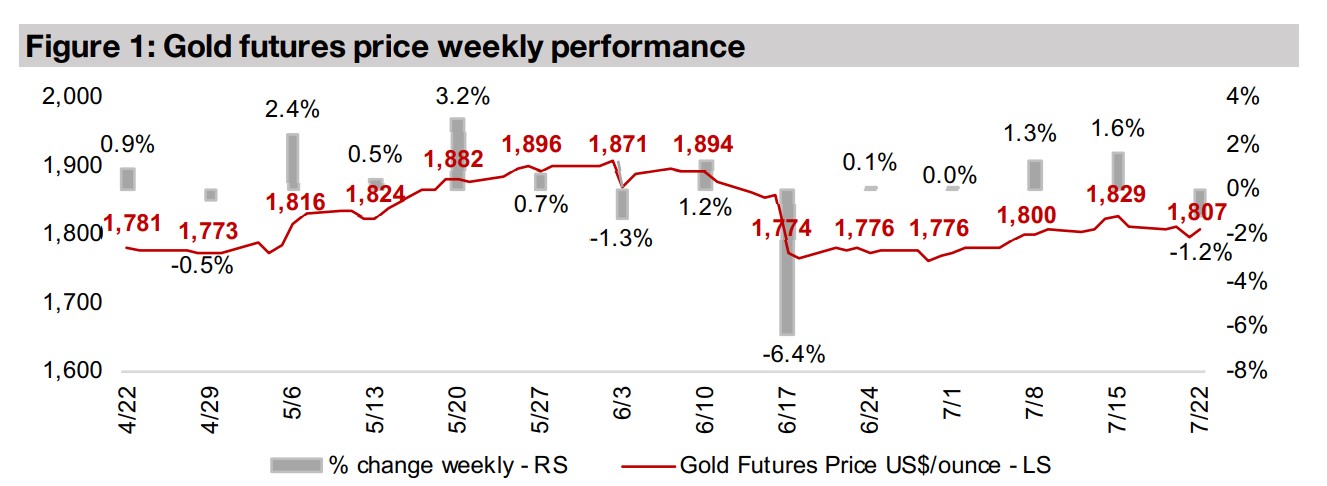
While the gold price declined -1.2% this week to US$1,807/oz, we believe the more important move was earlier in the week, when gold held up quite well even during a dip in stock market, and gold stocks declined less than other metals stocks.
A look at the 'other' mid-tier TSX-listed gold stocks
This week we look a group of TSX-listed mid-tier gold miners that we haven't already covered in our prior regional pieces mainly because they are mainly multi-asset and multi-region and did not fit exactly into the previous groups covered.

1) Gold passes another 'market dip test'
Gold down for the week, but holds up well during market dip
Gold declined -1.2% this week to US$1,807/oz, in a bumpy week with a dip in stock
markets early on because of concerns over rising global health crisis cases in the
U.S., and then a market recovery. We believe that the decline in markets on July 19,
was actually a more important indicator for gold than what happened for the rest of
the week, as it was a 'test' of how the sector would move in a downturn. Dips have
have been rare over the past year, with markets heading up almost continuously since
the H1/20 market decline. Figure 4 shows the performance of various sectors of the
market on July 19, 2021, which we view as a litmus test for how markets would react
in a more extended sell-off. We saw signs of a flight to safety, with a move to bonds,
with the US Treasury Bond Index up 0.6% on the day, and the US dollar, which rose
0.2%, and gold as the next best performer, declining just -0.3%.
For the equity markets, both the S&P 500 and MSCI World saw 1.5% declines.
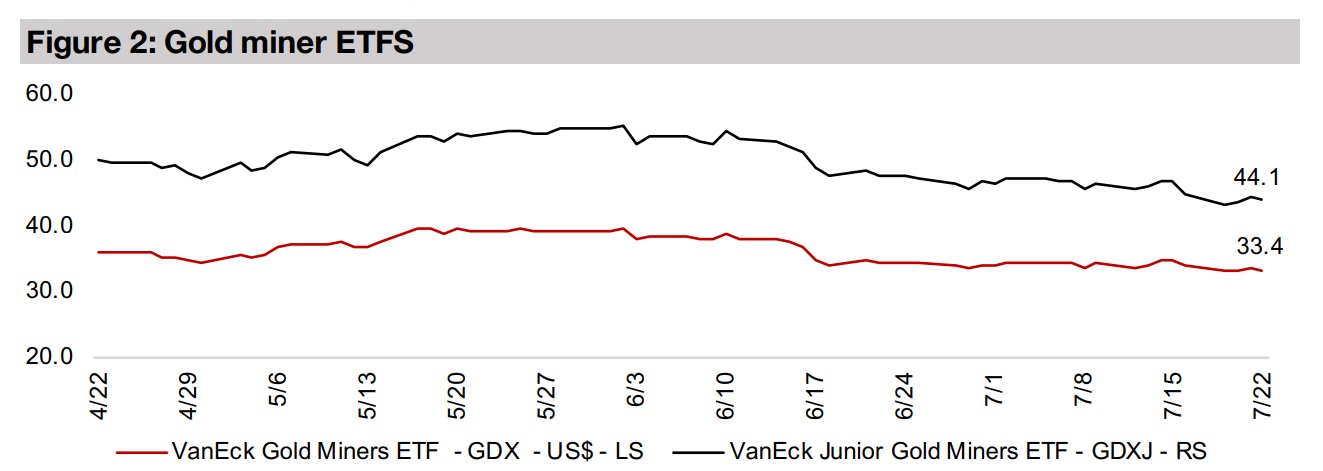
Looking at metals stocks, the producing gold miner ETF GDX was down -2.2%, more
muted than the other major metals ETFs. Silver was down -2.5% and copper declined
-2.8%, considerably more than gold. The main market concern on July 19, 2021
appeared to be that rising global health crisis cases could affect the economic
recovery, and investors were looking to sectors that might be affected from such an
outcome. Between gold, silver and copper, copper has had the biggest run this year,
as it is heavily geared to the economic cycle. Silver is also partly driven by similar
economic cycle factors as copper, but, like gold, also has as a driver its function as
a monetary metal, while gold tends to be driven mainly by monetary factors. Given
this, if the fear was of an industrial decline, then the order of performance is as
expected, with copper down the most, silver down less and gold down the least.
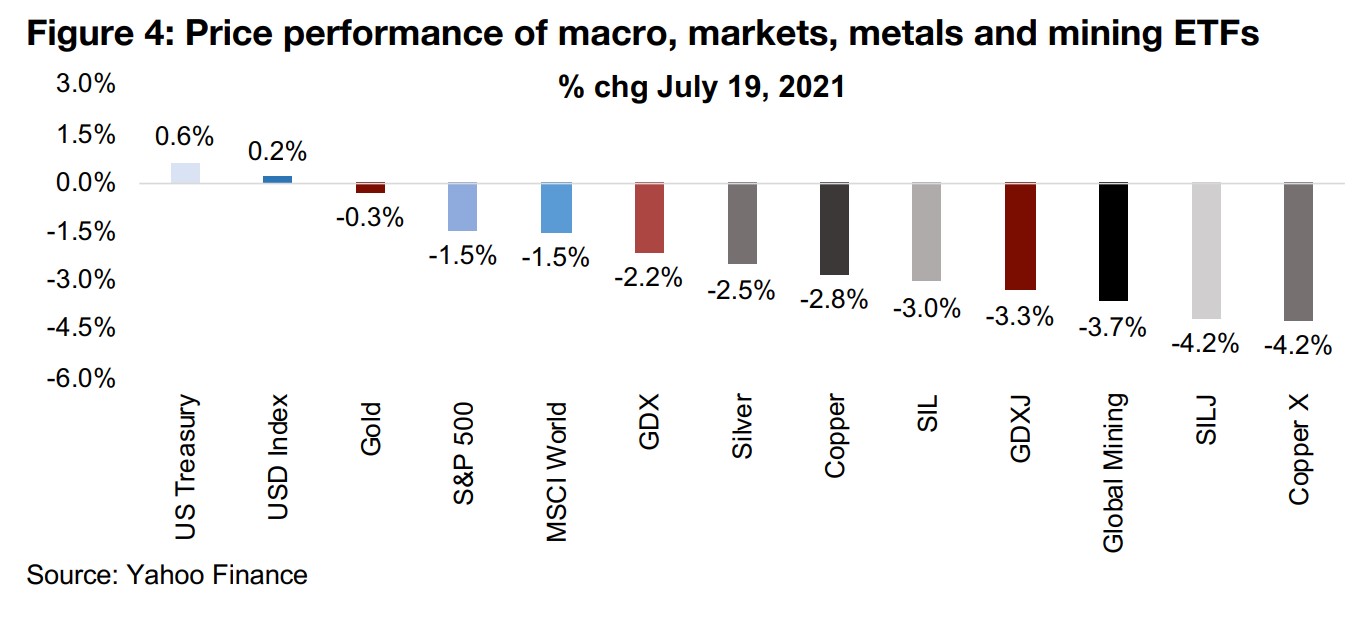
This is also reflected in the performance of the producing miner ETFs, with GDX down
the least, the silver producing miner ETF SIL down 3.0%, and the copper producing
miner ETF Copper X down -4.2%. Given that July 19, 2021, saw investors briefly
selling down riskier holdings, we would expect to see the junior mining ETFs face
more pressure than the producers. This is because juniors tend to be much riskier,
with many having no production or proven and probable resources to support their
valuations. Many just have a drilling program and some early results and the promise
of an eventual Resource estimate (and many have not even made it that far). Things
again played out as expected here, with GDXJ, the gold junior miner ETF down -3.3%,
and SILJ, the silver junior miner ETF down -4.2%. The ishares MSCI Global Metals
and Mining Producers ETF declined -3.7%, more than the gold and silver producing
miners, given its weighting to copper and other base metals that would have faced
pressure on the 'downturn in the industrial cycle' theme on the day.
Gold did well in the July 19, 2021 dip, similar to what we saw in March 2020, when it
also stayed quite flat, and proved that it was a good asset in a flight to safety. Gold
stocks got hit a bit more than the overall indices, but less than other major metals.
We note that there will always be this risk to gold stocks in a market downturn, even
if the gold price does hold up. This is because other factors come into play, especially
for juniors, which face the risk of having to raise new capital to continue exploration
activities (from 2013-mid-2019, for example, it became much more difficult for junior
miners to raise capital). Therefore, even if we can safely hold gold in a decline, we
can expect that gold stocks, and especially the juniors, to face pressure in a decline.
We should be aware of these issues, and ready to pull the trigger and reduce holdings
if a downturn becomes extended, and look for lower prices to buy back in.
2) The 'other' TSX-listed mid-cap gold miners
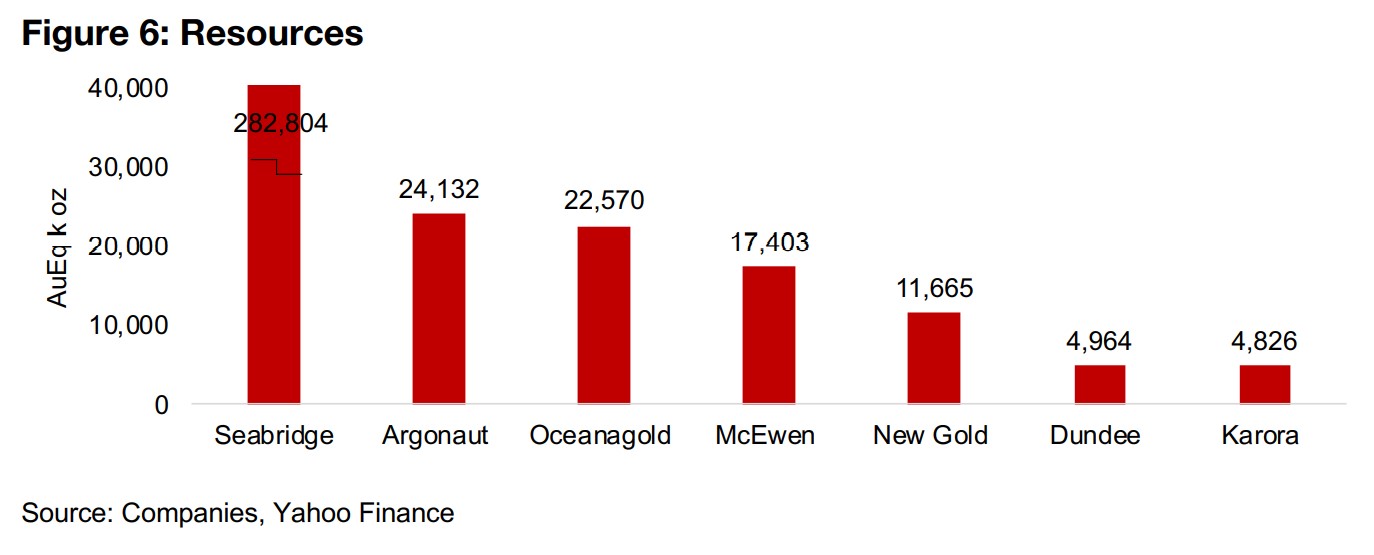
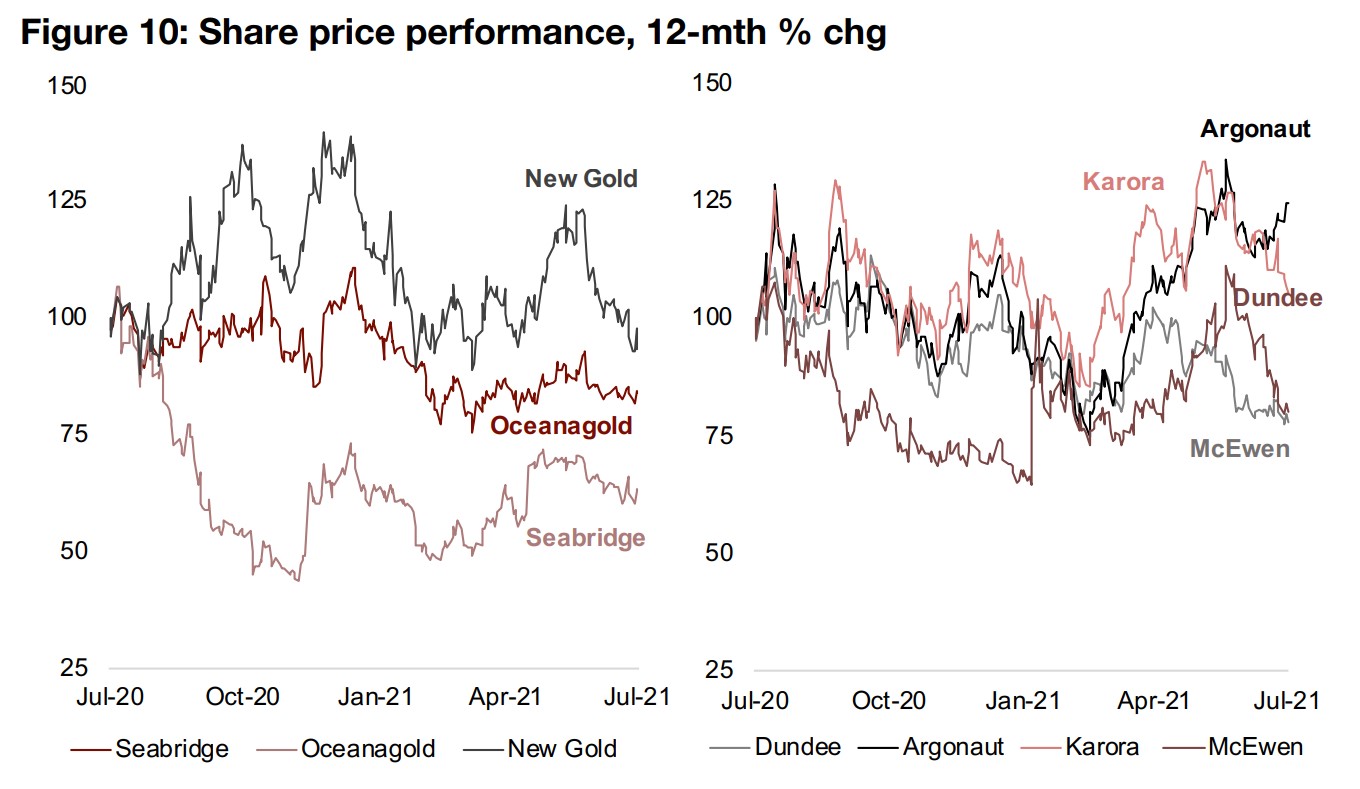
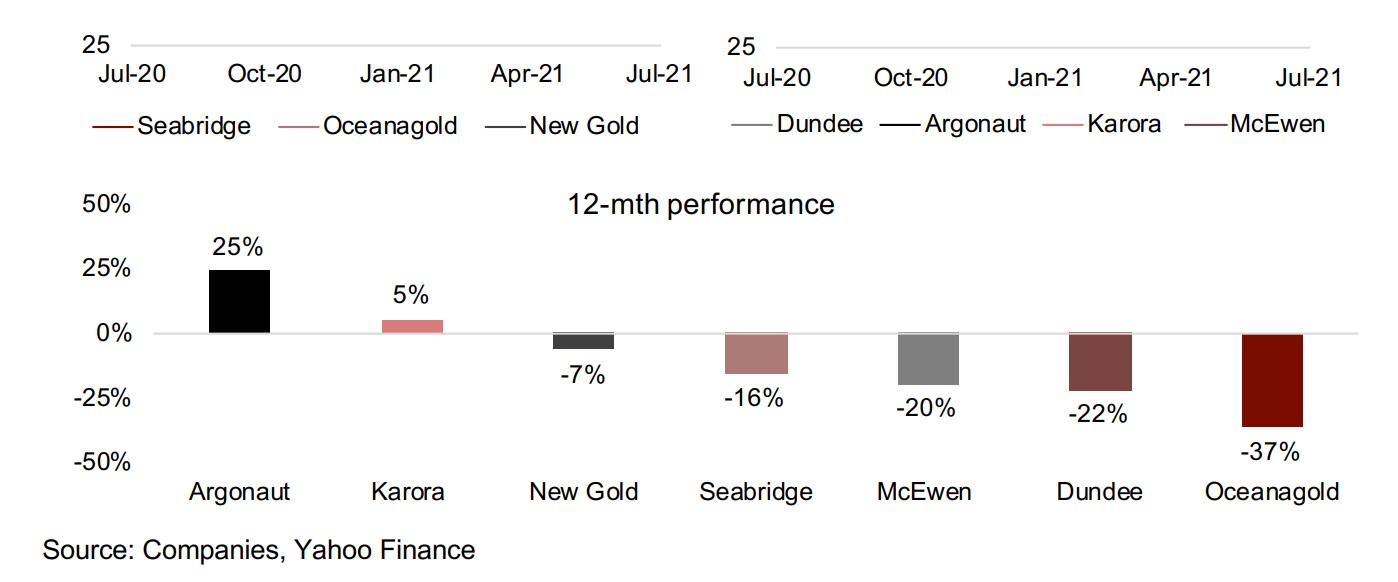
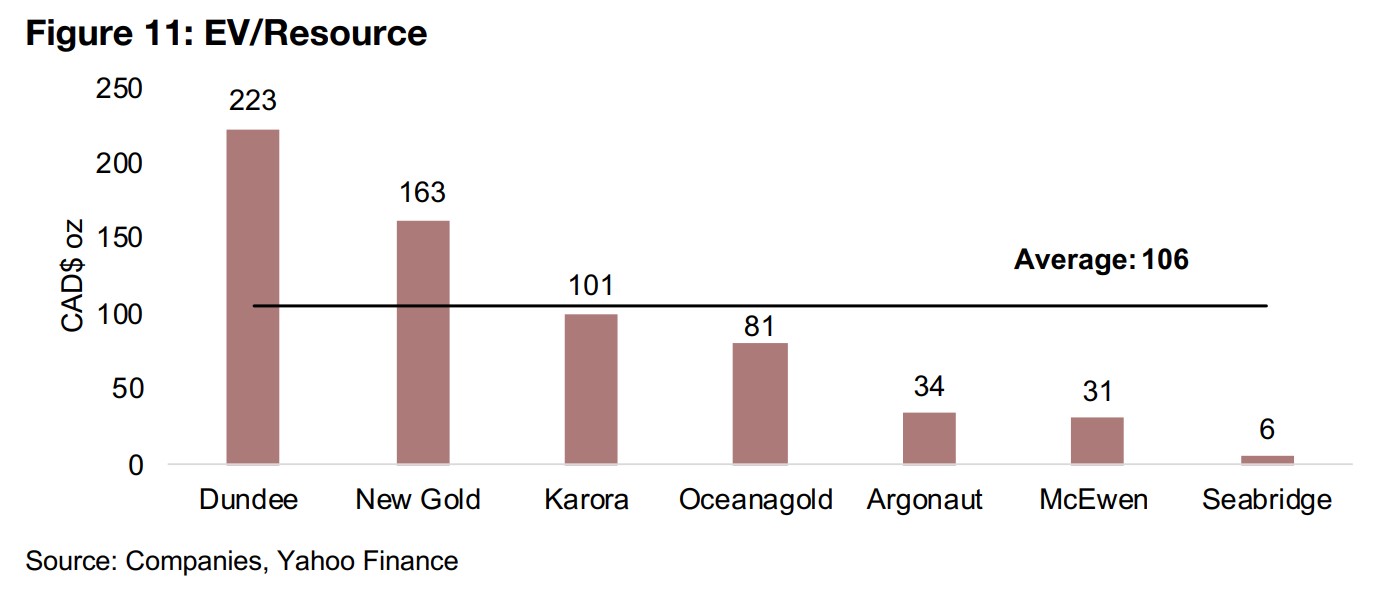
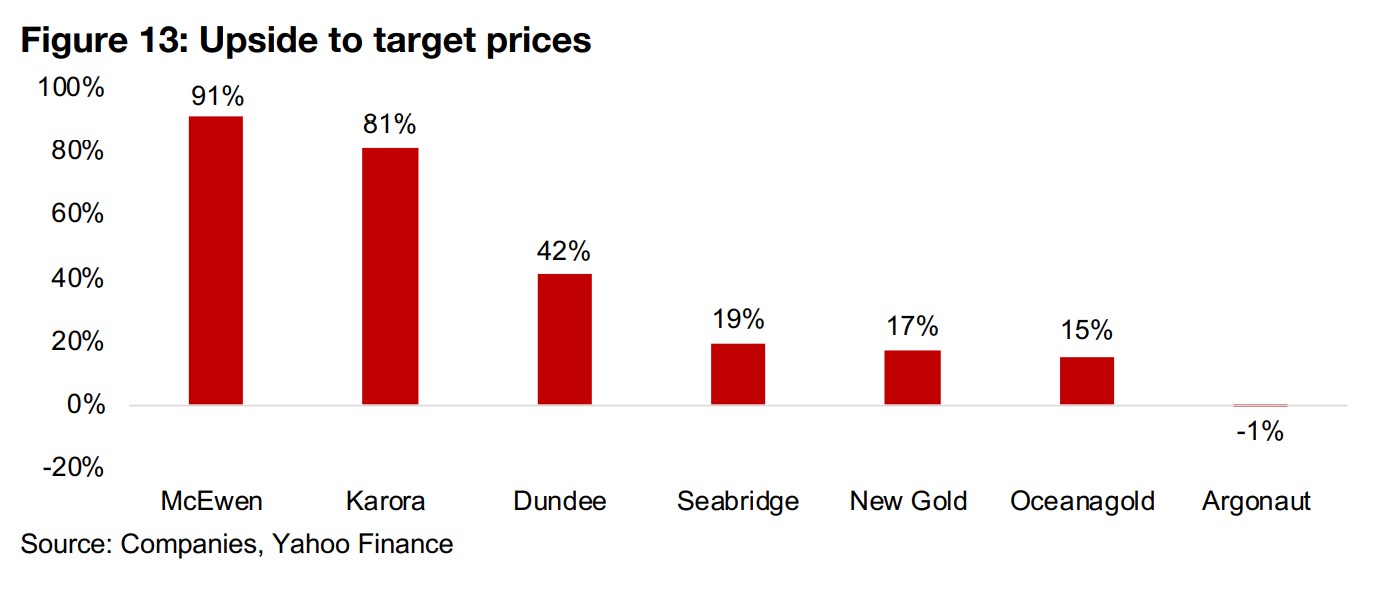
The largest in this 'other' group is Seabridge, with a potential giant resource This week we look at 'other' TSX-listed mid-cap gold miners, which did not fit in our previous regional pieces on TSX-listed, gold-focused companies operating in North America, Latin America and Africa. This mainly because they are operating either outside of the regions we have covered, or assets in multiple regions. These companies are summarized in Figure 5, with most already in production except for Seabridge, which has a huge potential resource, comprising gold, silver and copper, and dwarfing the group at 282mn ounces AuEq (Figure 6), with its large KSM project at the PFS stage. Given the huge potential, Seabridge has the highest market cap of the group, although it share price is down -16% as the market awaits for more delivery on its promise (Figure 10). Its EV/Resource is by far the lowest of the group, at just CAD$6/oz AuEq the market sees a long derisking process ahead, although its Price/Book is the highest at 2.64x, and the stock has a moderate 19% upside to its target price (Figure 13).
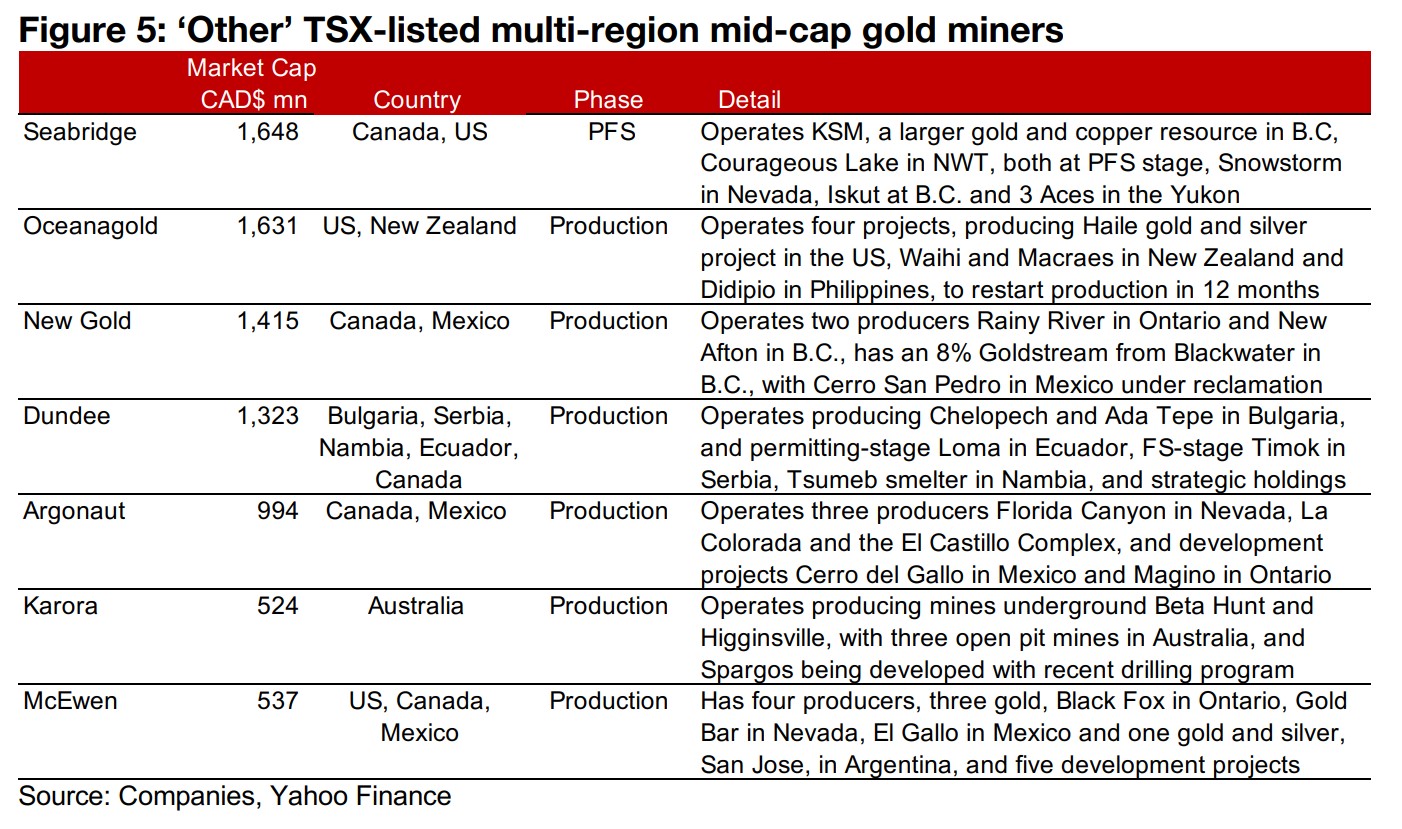
Oceanagold has four main projects, New Gold has two main projects
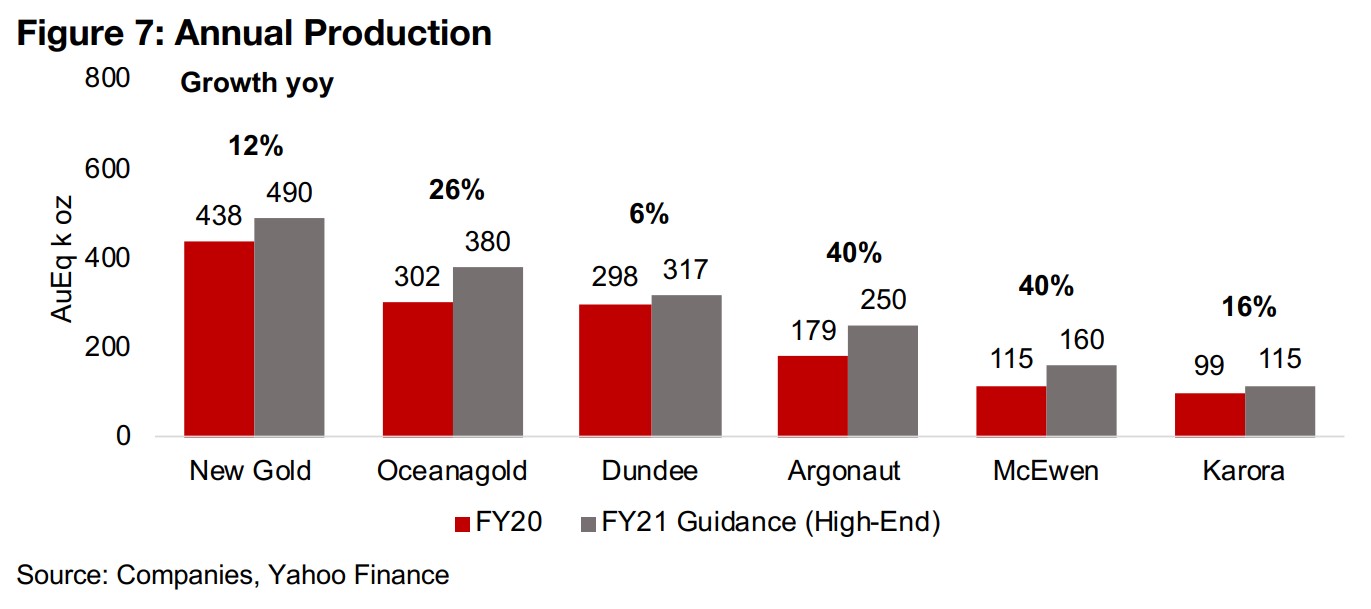
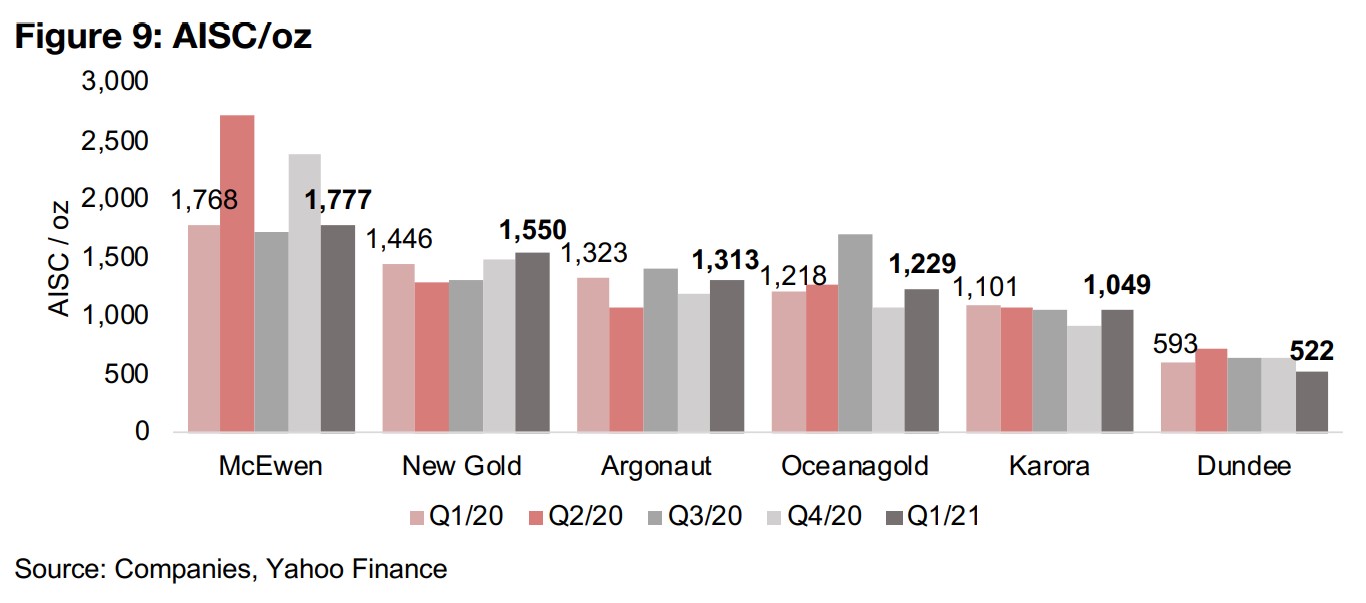
The next two largest companies by market cap and production are Oceanagold, with four projects, three in production and one expected back in production by next year, and New Gold, with two producing projects. While New Gold has 11,665k oz in Resources, towards the lower end of the group, it is expected to have the highest output of the group this year, at 490k oz, up 12%, based on company guidance (Figure 7). Oceanagold, with 22,570k oz in Resources, is expected to have the second highest production, at 380k oz, up 26% yoy. New Gold is a higher cost mine at $1,550/oz Au as of Q1/21, compared to Oceanagold, at $1,229/oz Au (Figure 10).
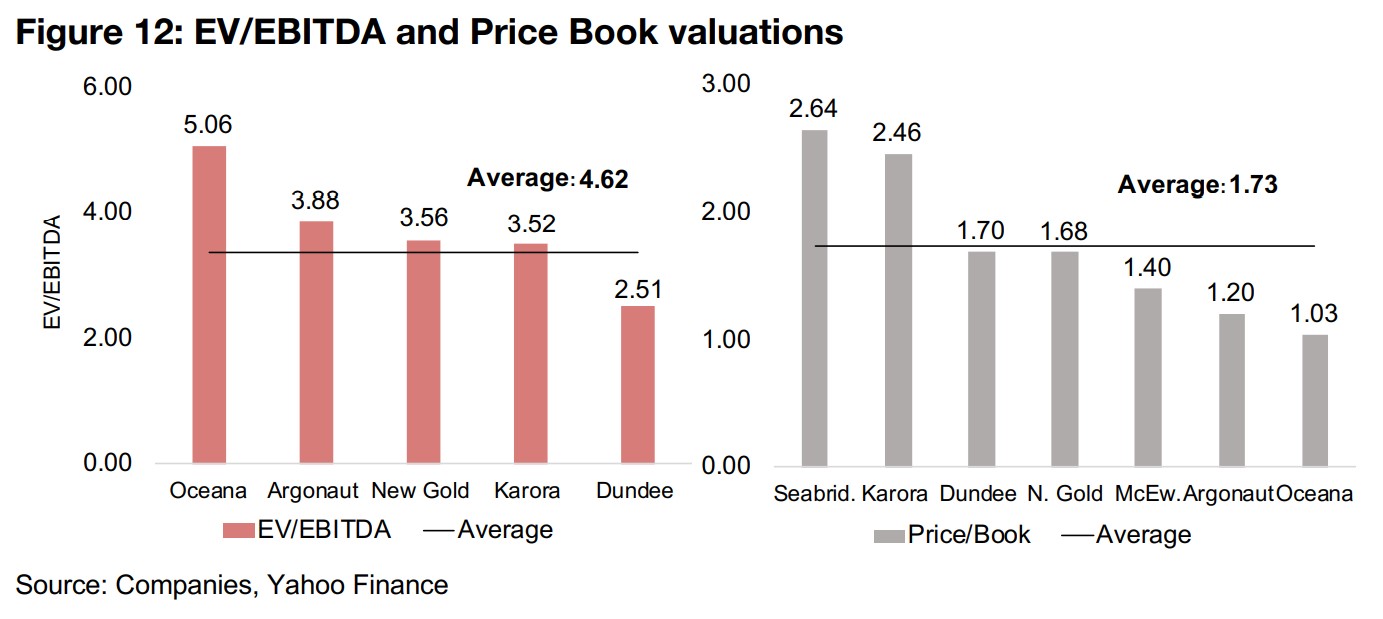
The share price of New Gold declined just 7% over the past year, with Oceanagold the worst performer of the group, down -37%. The valuation indicators give a mixed picture for Oceanagold, with its EV/Resource at $CAD 81/oz Au around the middle of the group, its EV/EBITDA of 5.06x at the highest, and its Price/Book of 1.03x at the lowest. In contrast, New Gold, while having a slightly higher EV/Resource versus the group of $CAD 163/oz Au, has an EV/EBITDA of 3.56x, and Price/Book of 1.68x, right around the middle. The market is expecting similar moderate upside for both this year, with a 17% upside to the target price for New Gold and 15% for Oceanagold.
Dundee and Argonaut are both multi-project, multi-regional producers
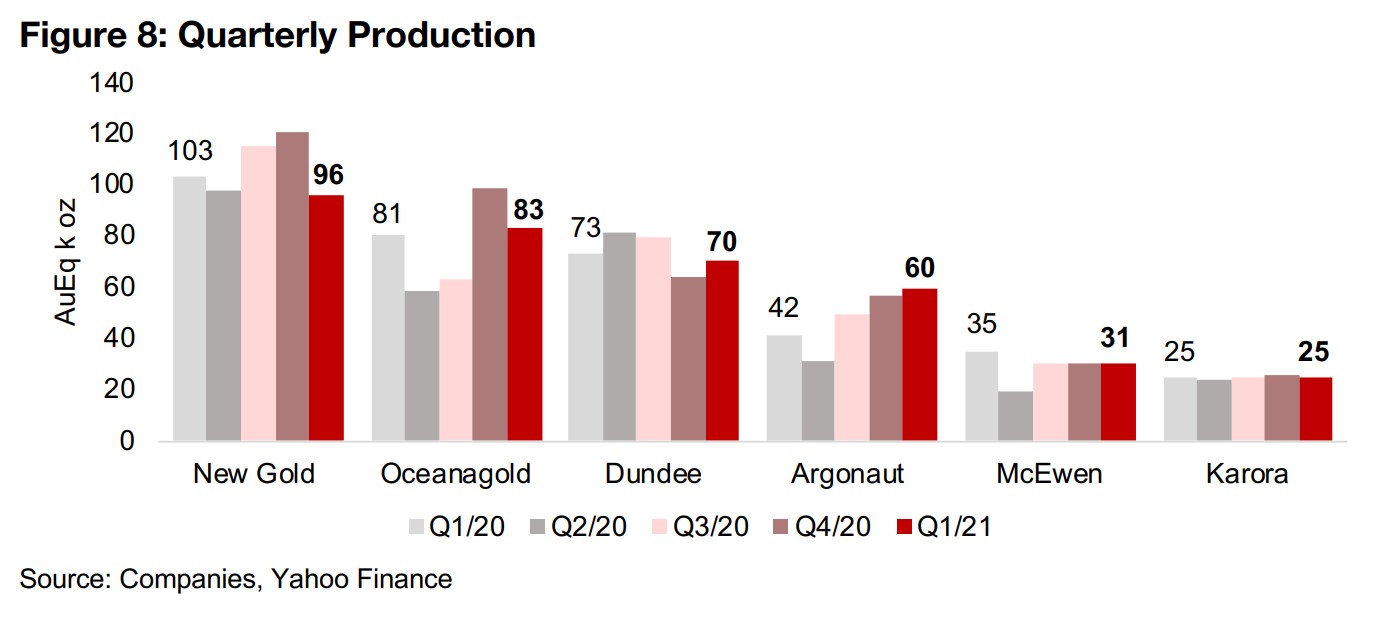
Dundee and Argonaut are both producers with multiple projects across multiple regions. While Dundee has the second lowest Resources of the group, at 4,964k oz Au, it has the third highest expected production, up 6% at 317k oz Au for 2021. Argonaut has the second highest Resources, at 24,132k oz Au, and fourth highest production, up 40% to 250k oz Au. Argonaut's cost per ounce is around the middle of group, at $1,313/oz, and Dundee's very low versus the group, and most global mines, at just $522/oz. This justifies the market paying by far the highest for Dundee on an EV/Resource basis, at $223/oz Au, compared to just $34/oz Au for Argonaut. Argonaut's share price has increased 25% compared to a -22% decline for Dundee, and on EV/EBITDA, the market is paying more for Argonaut at 3.88x, versus 2.51x for Dundee, but on Price/Book more for Dundee at 1.70x compared to Argonaut at 1.20x. The market is expected 42% upside to its target price for Dundee and views Argonaut as around fully valued, with -1% downside to its target.
Karora and McEwen both operating multiple producing mines
Karora and McEwen are both operating multiple producing mines and are the smaller two of the group by market cap, with McEwen with 17,403k oz Au in Resources, and Karora the smallest of the group with 4,826k oz Au. They are expected to have the lowest production of the group, with McEwen at 160k oz Au, up 40% for 2021, and Karora at 115k oz Au, up 16%, with McEwen the highest cost producer of the group, at $1,777/oz AISC in Q1/21 and Karora second lowest, at $1,049/oz. The share price of Karora is up 5% and McEwen down -20% this year, and Karora trades around the group average on EV/Resource, at $101/oz Au, and McEwen at just $31/oz Au. On Price/Book, Karora is the second highest of the group, at 2.64x, and McEwen below the group average, at 1.40x. The market is expected the highest upside of group for these two stocks, with 91% upside to the target price for McEwen, and 81% for Karora
Producers almost all decline on gold dip, market volatility
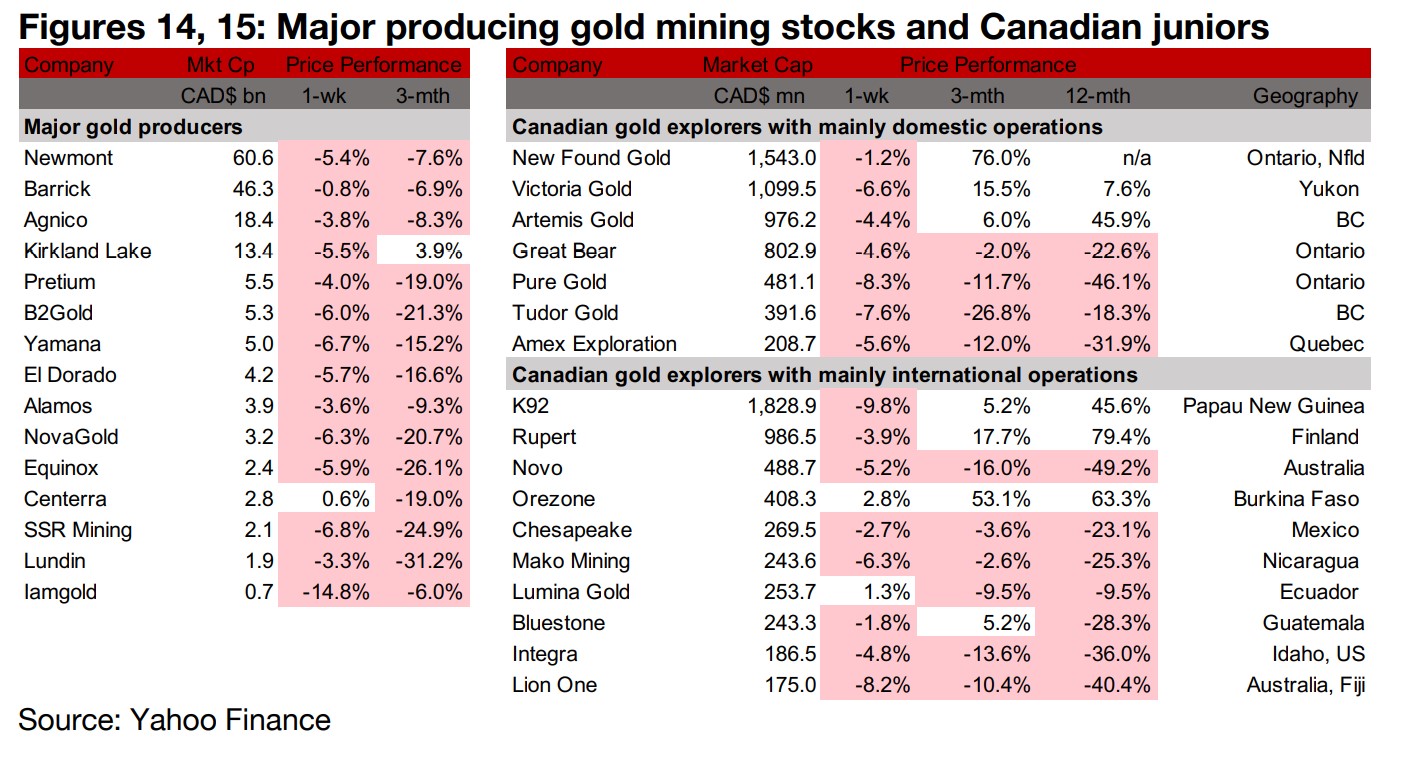
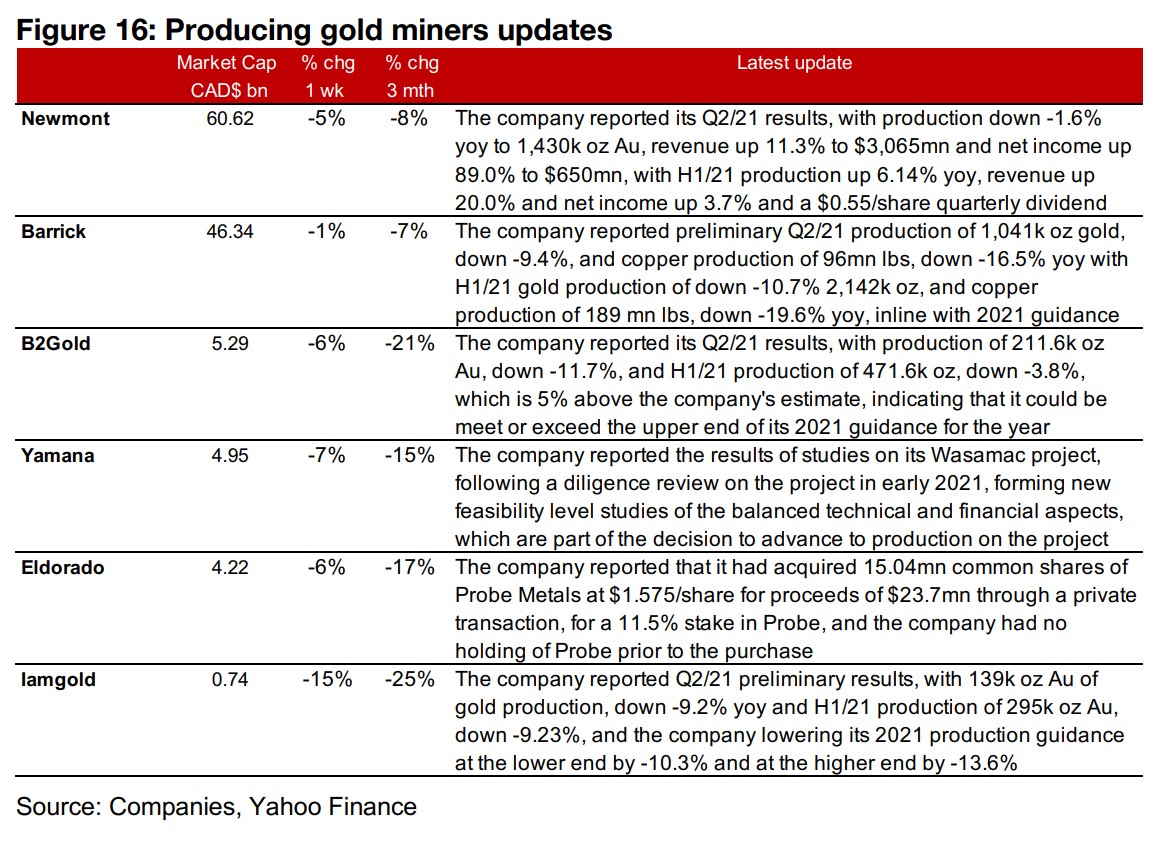
The major gold producers nearly all declined this week on the dip in gold and market volatility (Figure 14). The Q2/21 results season started with Newmont reporting full Q2/21 results, and Barrick, B2Gold and Iamgold reporting preliminary Q2/21 production and sales. Yamana reported the results of studies on the Wasamac project as part of a decision to advance to production and Eldorado reported that it had purchased its first stake in Probe Metals, and now holds 11.5% of the company (Figure 16).
Canadian juniors nearly all down with pressure on gold and markets
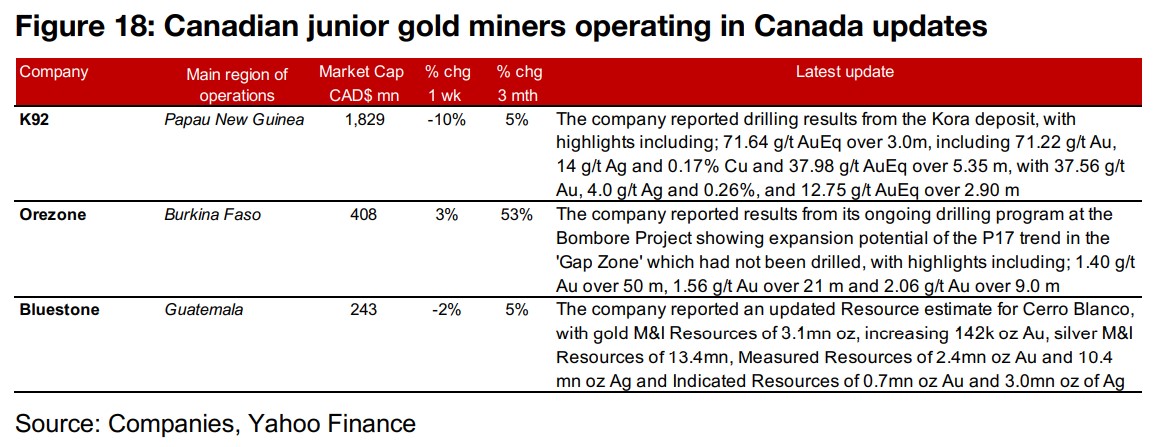
The Canadian juniors were nearly all down this week (Figure 15). For the Canadian juniors operating domestically, Artemis received a permit for early construction works at Blackwater from the B.C. government and Probe Metals filed an updated Resource estimate for Val d'Or East (Figure 17). For the Canadian juniors operating mainly internationally, K92 reported drilling results from Kora, Bluestone reported an updated Resources estimate for Cerro Blanco, and Orezone reported drilling results from Bombore (Figure 18).

Disclaimer: This report is for informational use only and should not be used an alternative to the financial and legal advice of a qualified professional in business planning and investment. We do not represent that forecasts in this report will lead to a specific outcome or result, and are not liable in the event of any business action taken in whole or in part as a result of the contents of this report.


