September 16, 2024
Gold Jumps On Expected Fed Rate Cut
Author - Ben McGregor
Gold jumps as US expected to join monetary easing
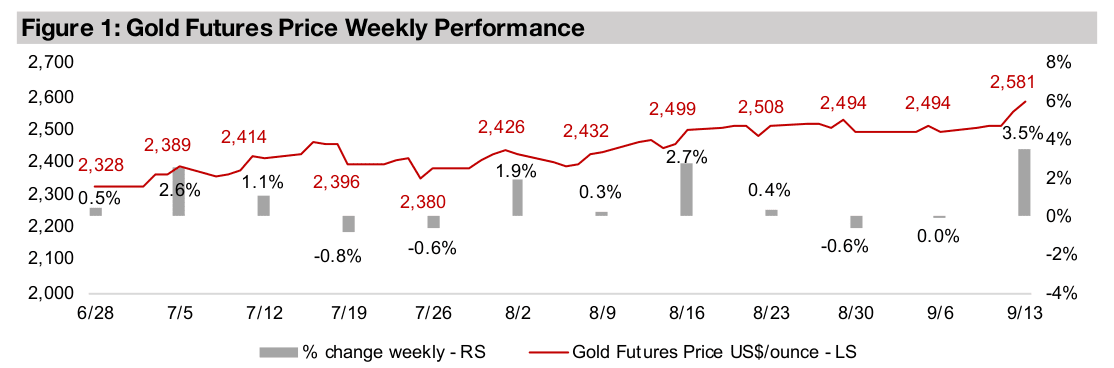
Gold rose 3.5% to US$2,581/oz on hopes the US would join the monetary easing underway by most major central banks, with Europe cutting rates a second time and US inflation data boosting the probability of a first Fed cut at this week’s meeting.
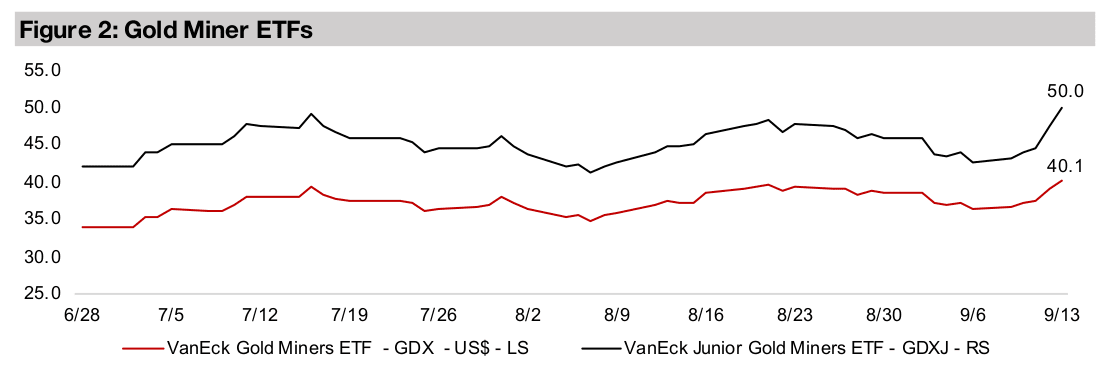
Gold stocks rocket on metal gain and equities rebound
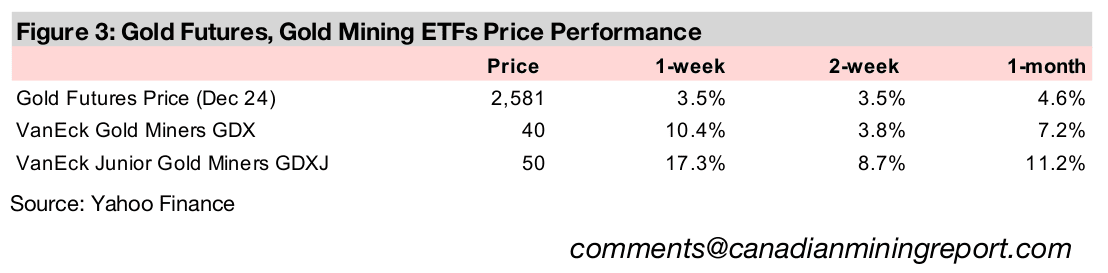
Gold stocks rocketed on the gain in the metal and equities rebound, with the GDX up 10.4% and extreme 17.4% rise in the GDXJ outpacing even what might be expected given a 3.5% boost in the gold price and 4.3% increase in the Russell 2000.


Gold Jumps On Expected Fed Rate Cut
Gold jumped to US$2,581/oz, up 3.5% and gaining nearly US$100/oz in just a week,
buoyed by US inflation data and a rate cut in Europe, but also an underlying wide
base of fundamental economic and political factors continuing to support the metal.
Last week we outlined two scenarios for gold, with the first seeing the metal settle in
a range centered around US$2,250/oz, which is near the average so far this year. In
the second scenario it would reach a range based around an average US$2,500/oz,
involving runs up toward even US$2,600 or US$2,700/oz. This week suggests that
the latter scenario could be developing, and this is supported by several major
investment banks forecasting a gold price average around US$2,500/oz for 2025.
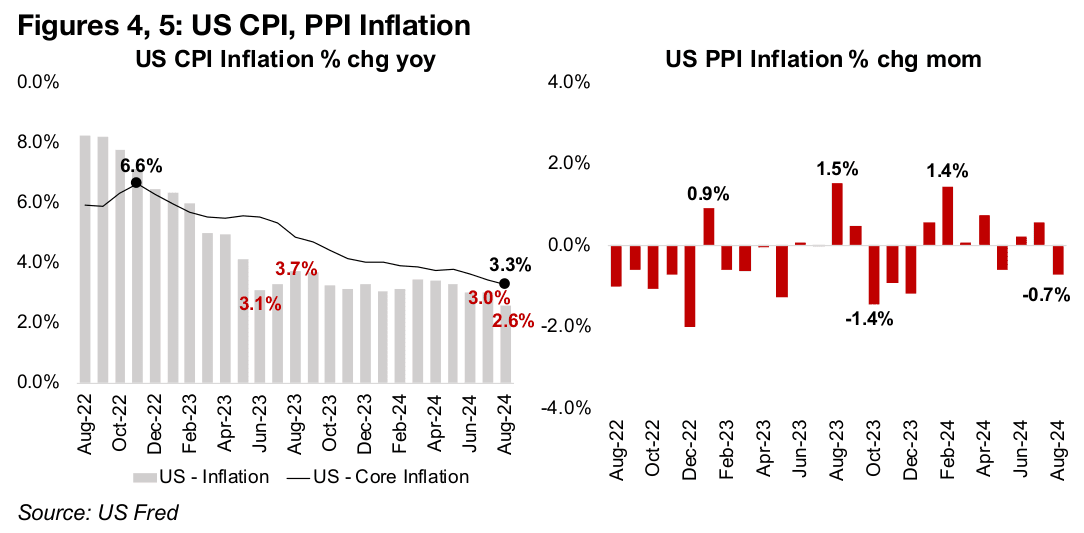
US CPI inflation declined in August 2024 with the headline number falling below 3.0%
for the first time in several years, to 2.6%, and core inflation continuing down to just
3.3%, while US PPI inflation for August 2024 was down -0.7% month on month
(Figures 4 5). While the CPI was higher than expected and PPI inline with consensus
estimates, overall the data showed that the US inflation situation continues to improve.
This boosted the probability for a 25 bps cut by the Fed at its September 18, 2024
meeting above 80%. The European Central Bank already made its first cut in June
2024 and followed up this week with a second 25 bps cut in the base rate to 3.50%.
This drove a sharp rebound in markets from last week’s crash, with the S&P 500 rising
3.8%, the Nasdaq up 5.0% and Russell 2000 gaining 4.3%. The gold stocks rocketed,
with the GDX up 10.4% and GDXJ up 17.4%, with the latter especially outpacing
what could be expected even from a 3.5% rise in gold and strong small caps. While
this might seem at first encouraging, the huge swings of the past month, and surge
in defensive assets like gold and gold stocks are not signs of a healthy bull market,
which tends to have a consistent gradual rise and underperformance of safe havens.
High rates pressuring finances of high debt countries
While the shift towards easier monetary policy by most global central banks, which
the Fed looks set to join as early as this week, is a core driver underlying the gold
price heading into 2025, there are several other factors aligned in support of the metal.
Some are shorter-term monetary drivers related to potential rate cuts in the US,
including a decline in the US dollar and a flattening of real yields, with high real yields
making the opportunity cost of holding gold higher. There are also the continued
strong purchases of gold by global central banks and heightened political risk.
While we have covered all of these in depth over the past year, there is a relatively
new factor that has come to the fore because of the rise in global interest rates over
the past year. This is the pressure of high rates on global government finances,
especially for countries with high levels of debt. While rates are clearly starting to
come down, they are still relatively high, and the pace of cuts will likely remain gradual
given that inflation still remains above the targets of many central banks, including
the Fed and the European Central Bank. These rate cuts also imply an expansion of
the money supply, which correlates with a rise in the stock of debt, and therefore
suggests that the heavy global debt loads of some countries may continue to worsen.
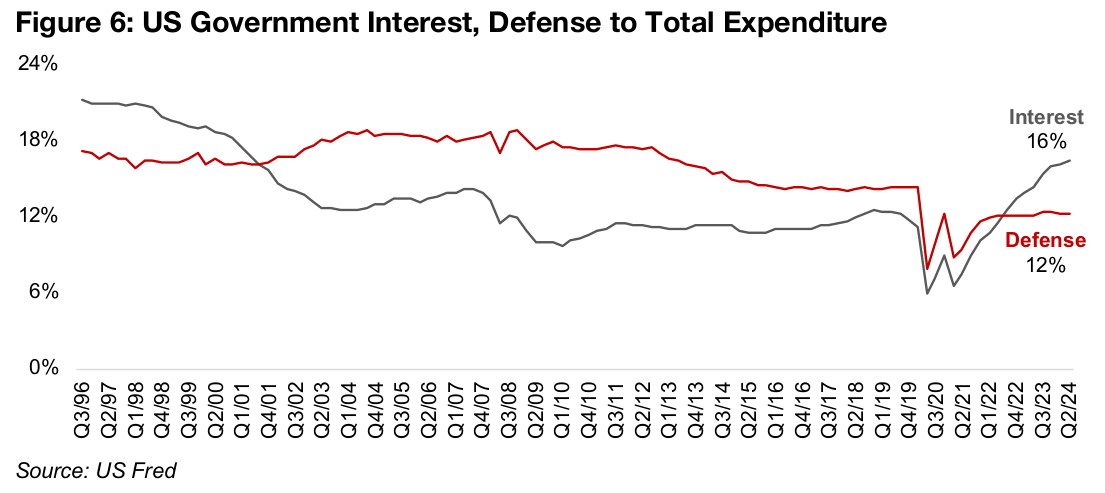
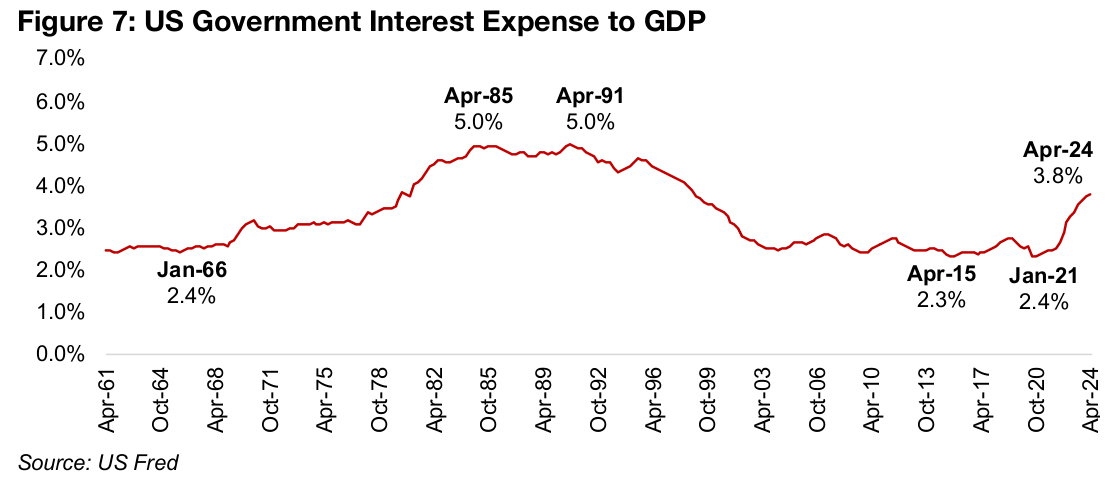
In the US, the effect of the high rates can be seen in the surge of interest payments on debt as a percentage of current federal government expenditure, which has jumped to 16% as of Q2/24, from only around 6% in early 2020 (Figure 6). This has seen interest on debt jump even above defense expenditure, at 12% in Q2/24, which was consistently a higher percentage of government spending than interest for nearly twenty years from 2001 to 2019. The US government interest expense to GDP ratio also shows the major increase in pressure on the country’s finances from high rates, rising to 3.8% for Q2/24 after averaging just 2.5% from 2005 to 2021, and not that far off historical peaks at 5.0% in 1985 and 1991 (Figure 7).
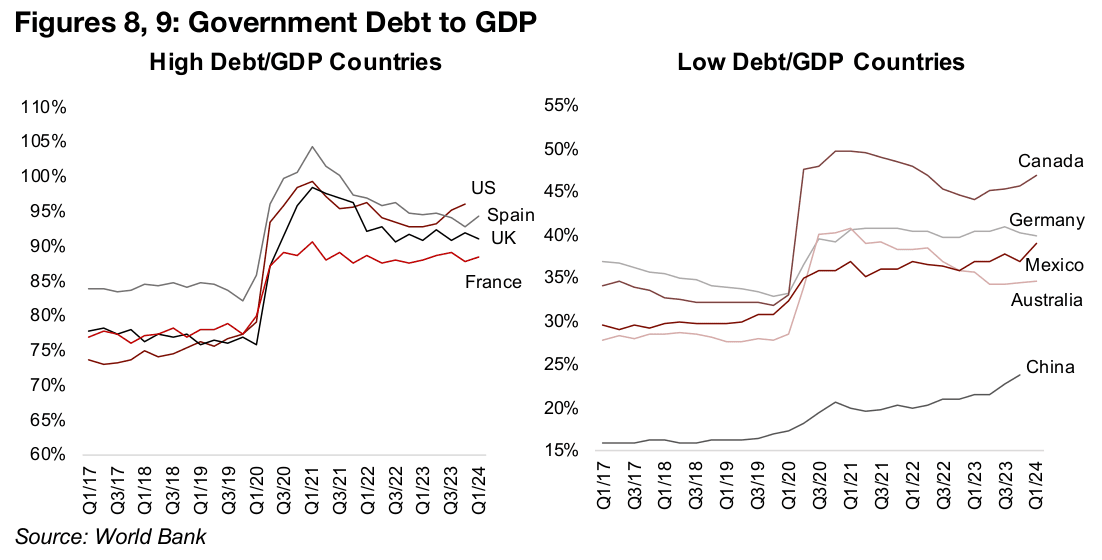
Of the major global economies, along with the US, the UK, France and Spain will also
have had pressure put on their government finances from rising rates given relatively
high levels of debt to GDP. The current debt/GDP for these countries ranges between
85% to 95%, up from 75% to 85% before the global health crisis (Figure 8). While
Canada, Germany, Mexico, Australia and China have much lower debt to GDP ratios,
all have seen substantial increases since 2020 (Figure 9).
There is no major risk these countries will default on their debt, or see their currencies
collapse from hyperinflation, medium-term. However, markets could start hedging
even only gradually deteriorating fiscal positions and a full-blown crisis would not be
required to see them shift towards safer assets. This could include increasing
allocations to gold and be yet another factor continuing to drive up the metal.
Beware the disinversion of the yield curve
Another relatively new sign of rising risk for markets that could encourage the
increase of gold holdings for protection has been the disinversion of the yield curve.
Usually the yield curve is positive, with longer duration bonds paying higher than
shorter duration bonds, to account for the higher risk over time. However, the yield
curve can become inverted, with rates on shorter duration bonds higher than on
longer duration bonds. This is generally considered a negative signal for markets,
which are in effect anticipating that interest rates will be lowered in the future, usually
in response to negative economic outcomes.
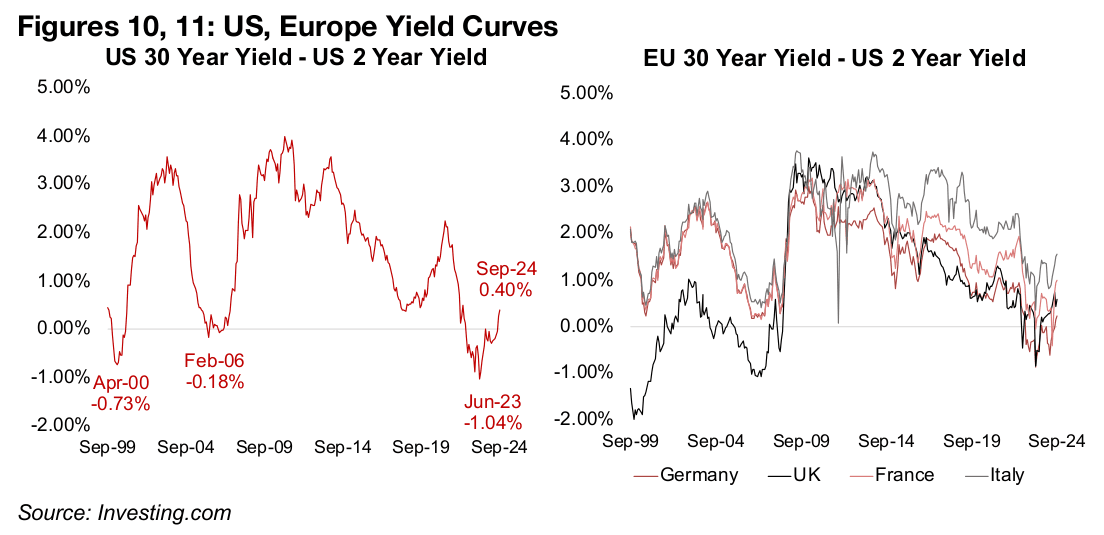
While the inverted yield curve itself is often the focus of concern, it is actually the
period just after this, when the curve disinverts, which can be the more immediate
sign that economic difficultly is imminent. This was the case in 2000 and 2007 with
US and European yield curves turning positive after a period of disinversion, which
was soon followed by market crashes (Figures 10, 11). The yield curves in the US and
EU have again disinverted just over the past few months, which could prove once
again to be a major warning signal for markets heading into 2025 and drive markets
towards defensive assets including gold.
Canadian mining shipment value jumps over H1/24
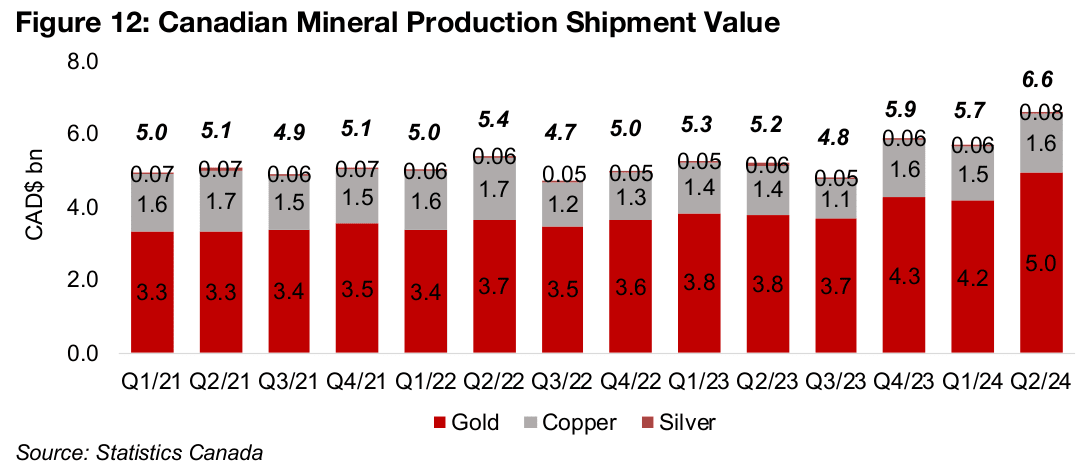
Gains in the gold sector this year were the major driver of Canadian mineral production shipment value over H1/24. The combined gold, copper and silver shipment value in H1/24 was CAD$12.4bn, up 17.8% yoy, with gold accounting for the majority of this, at CAD$9.1bn, or 74%, and rising 19.5% (Figure 12). Copper shipments also saw substantial gains to CAD$3.1bn, up 13.4% yoy, and while silver was just a sliver of the total at CAD$0.14bn, or 1.1%, it saw the strongest gains, up 20.3%.
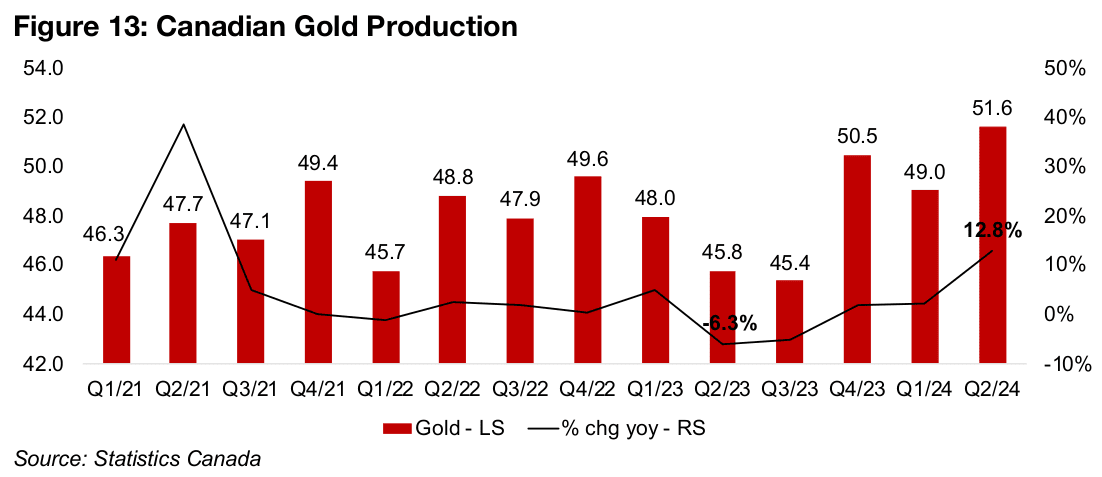
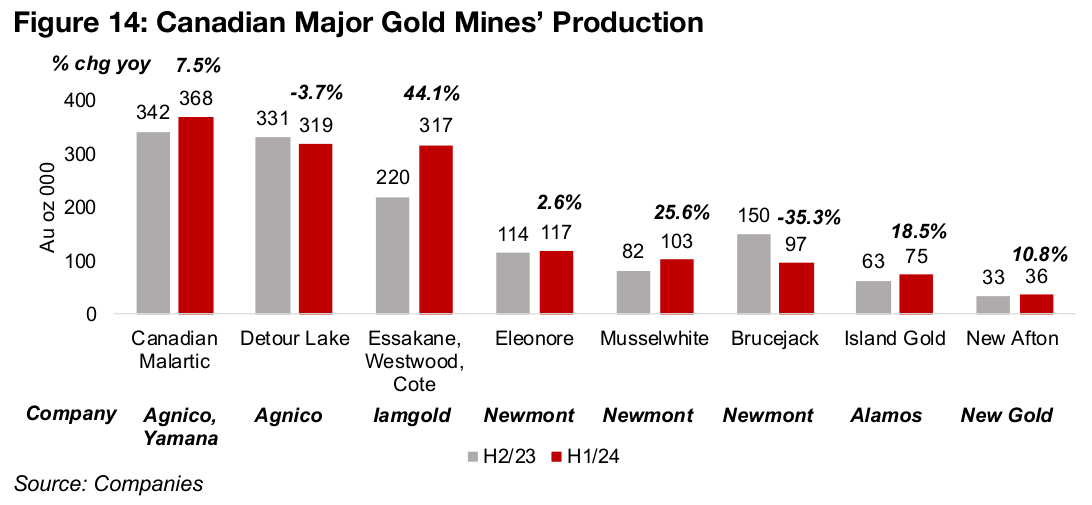
While the rise in the metal price was a major factor in the gain in the gold shipment value, expanded production has also been key, especially in Q2/24, with gold output up 12.8% to 51.6k kilograms (Figure 13). This has been driven by increases at many of the country’s largest mines, with output at Canadian Malartic, Iamgold’s three mines Essakane, Westwood and Cote, Musselwhite, Island Gold and New Afton up 7.5%, 44.1%, 25.6%, 18.5% and 10.8%, respectively. The only major decline was from Brucejack, down -35.3%, with changes at other major mines moderate, with Detour Lake down -3.7% and Elenore up 2.6% (Figure 14).
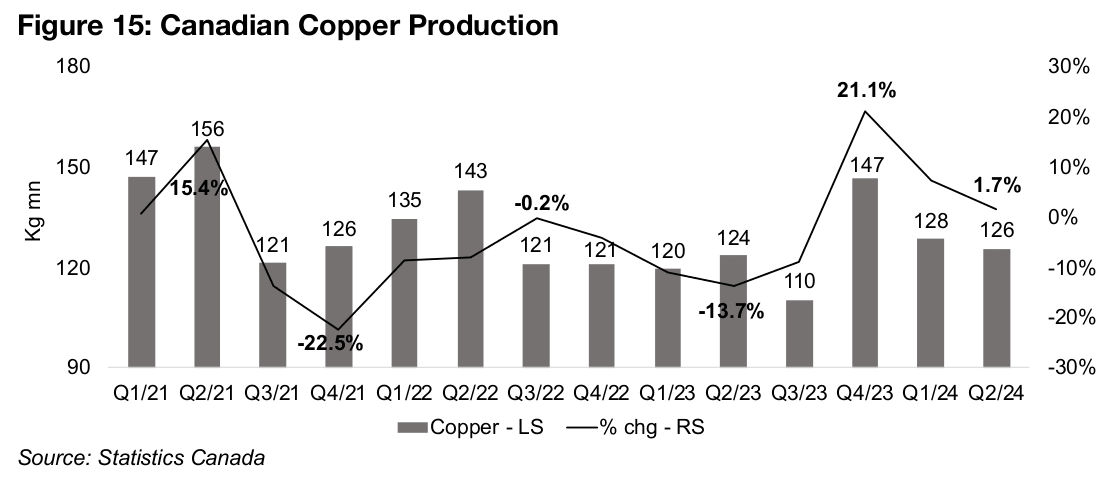
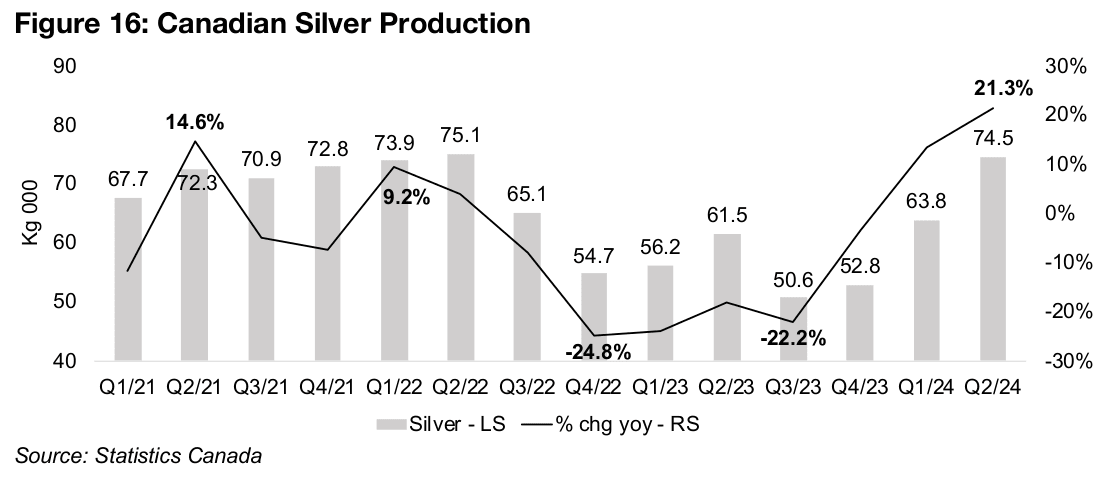
The rise in the copper shipment value was driven more by the gain in the metal price over H1/24, with production up just 4.5%, having slipped back to just over 125mn kg in both Q1/24 and Q2/24 following a jump to 147mn kg in Q4/23, up 21.2% yoy (Figure 15). Silver production growth was even higher than for gold over H1/24, up 17.6%, rising 13.5% in Q1/24 and 21.3% in Q2/24, with the growth rate having risen in each of the past four quarters (Figure 16).
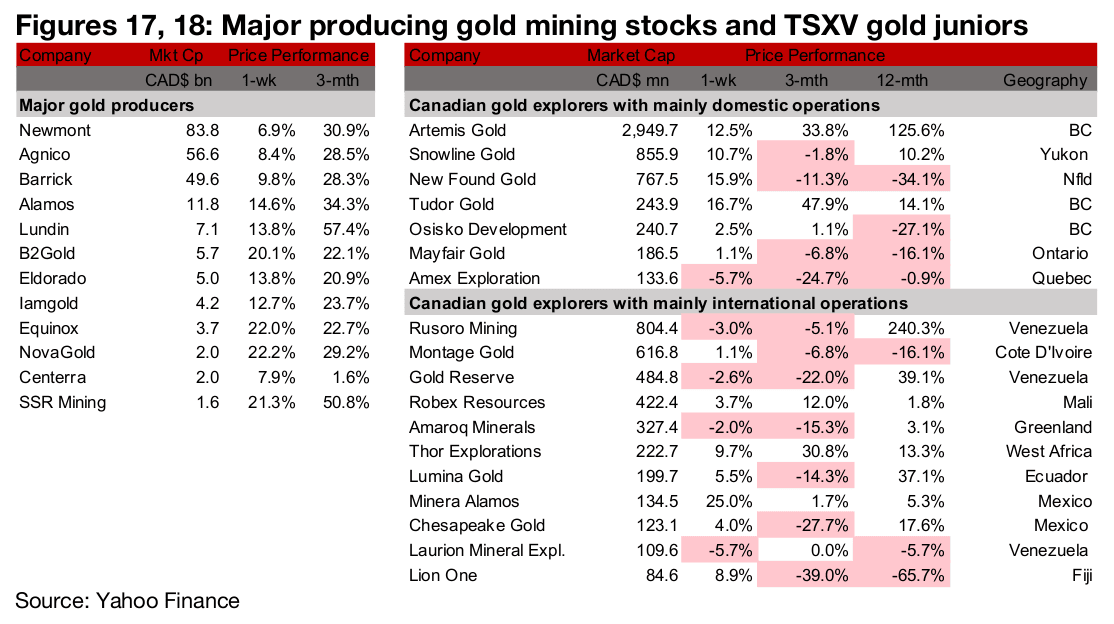
All the major producers and most of TSXV gold gain
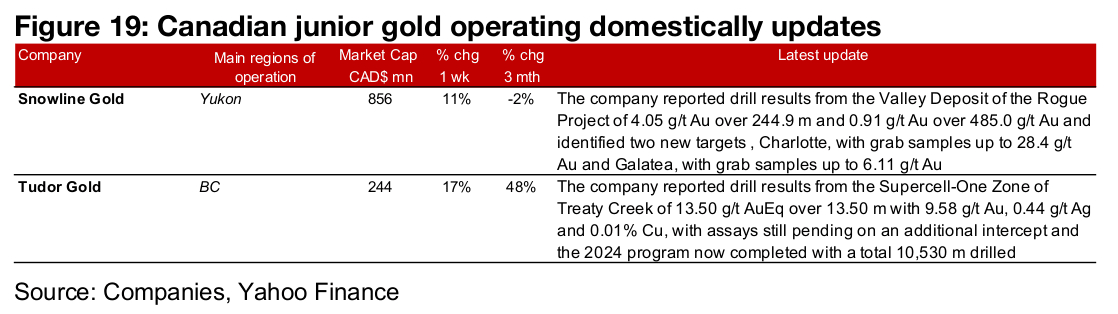
All of the large gold producers rose, with most up in by double digits, and TSXV gold mainly gained (Figures 17, 18). For the TSXV gold companies operating domestically, Snowline Gold reported drill results from the Valley Deposit of the Rogue Project and Tudor Gold released drill results from the Supercell-One Zone of Treaty Creek (Figure 19). For the TSXV gold companies operating internationally, there were no major news releases.
Disclaimer: This report is for informational use only and should not be used an alternative to the financial and legal advice of a qualified professional in business planning and investment. We do not represent that forecasts in this report will lead to a specific outcome or result, and are not liable in the event of any business action taken in whole or in part as a result of the contents of this report.