July 16, 2021
Gold gains for second week as inflation continues to rise
Author - Ben McGregor
Gold picks up again after holding flat for two weeks
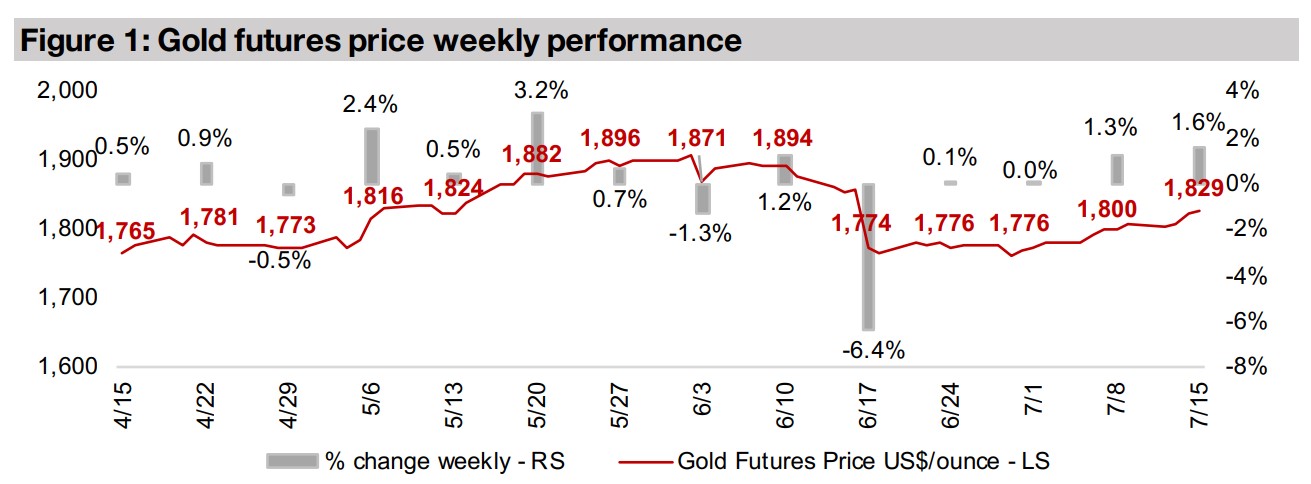
The gold price rose 1.6% this week to US$1,829/oz, rising for a second consecutive week, as the market may be moving into gold as an inflation hedge, with CPI Inflation in the US around its highest levels in forty years.
A look at the large TSXV-listed gold, silver and copper junior miners
This week we look the largest TSXV-listed gold, silver and copper juniors, their performance over twelve months and their relative price to book valuations, showing the star performers of the past year, and those stocks that have lagged.

1) Gold picks up again as inflation continues to rise
Gold continues to rise for second week
Gold picked up 1.6% this week to US$1,829/oz, its second week of gains, as US
inflation surprised to the upside again, as it has for the past several months. We
expect that the inflation theme will continue to be the main driver of gold for some
time. The market continues to weight the potential for inflation to start to get out of
control, and the hedging benefits of buying gold in reaction to this, with the potential
for the Fed to make announcements of measures to curb inflation, which tends to put
pressure on the gold price. We believe that the market is not convinced that the Fed
will be able to keep inflation under control given the major monetary expansion of the
past year, and this will continue to drive interest in holding gold. This is not to say
that gold may not see declines periodically on announcements from the Fed, as we
have seen already this year, but we believe that the fundamentals continue to support
gold, and any concrete Fed action to curb inflation is still far off, giving inflation plenty
of room to run in the meantime.
US inflation could be headed for its highest level in nearly forty years
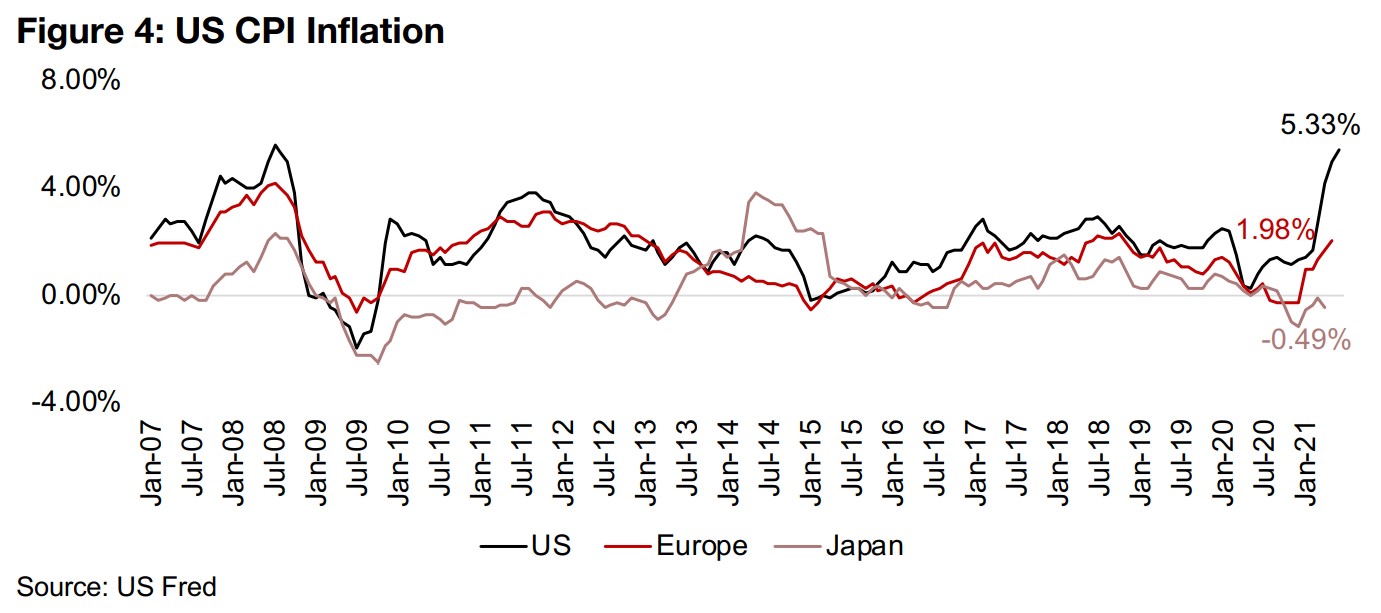
US inflation rose again this month to 5.33%, which now puts it near some of the highest levels since an extended period of reasonably low inflation began around 1983 (Figure 4). Prior to that, in the 1970s and early 1980s, there had been two major spikes to 12.2% in November 1974 and 14.6% in April 1980. But after the Fed intervened with huge interest rate hikes in 1981, inflation dropped substantially, and it has really never gotten out of control since. There have been four peaks in the inflation since, excluding the current rise, to 6.25% in December 1990, to 3.73% in June 2000, to 4.74% in September 2005 and 5.31% in August 2008. So the current rise is the second highest of the 'Great Moderation' of inflation since 1983, and if it continues up, it will be heading for the highest level in nearly forty years.
Used car price rise is a key driver of US inflation...
However, the Fed and some analysts view this inflation as only a temporary phenomenon, being driven by major supply chain disruptions and a low base effect caused by the global health crisis. Some analysts have even singled out a spike in used car prices as driving about a third of the increase. Used car sales are believed to be spiking with the US starting to open up after over a year on lockdown. This has been driven by pent up demand from consumers looking to travel again, with a combination of the summer season, an improving employment market and stimulus checks driving demand for used vehicles. Meanwhile, new car supply has dropped considerably as global supply chains for their production have been interrupted, shifting consumers to the used car market.
...but we believe that the massive monetary expansion is still the root cause
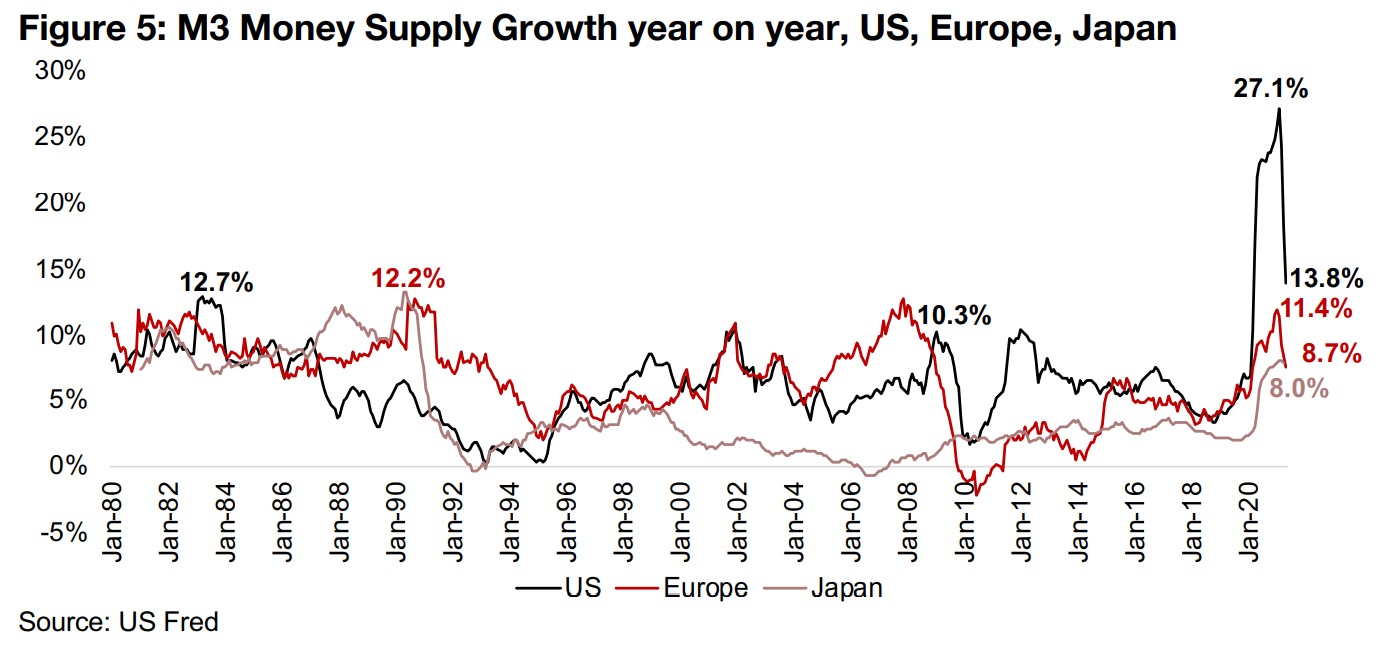
While we acknowledge that these may be the immediate cause of prices increases, we still see the underlying root cause as a massive monetary expansion over the past year. We question whether any of these supply chain issues would be driving near forty-year highs in inflation without the absolutely massive increase in the money supply in the US, which is still rising at 13.8% year on year as of the most recent May 2021 data (Figure 5). While this is down from a peak growth of 27.1% in February 2021, it is still at the highest level in forty years. We also note that there is a lagged effect from an increase in the money supply, and the increase from recent months may take up to a year or more to flow through to inflation data, and the effect of the current expansion could carry over well into 2022. So while the 'temporary inflation' theories are likely factors in the current inflation, we believe that the impact from the monetary tsunami may be underestimated, and that even as the temporary drivers calm down, with supply chains back to normal and the base effect is over (which is probably around Q4/21), that inflation could continue to remain elevated.
Removing stimulus and cutting rates remains dangerous
It will be interesting to see what the Fed does if inflation does not subside. We believe
that it is far too dangerous for aggressive rate cuts which would likely crash the
economic recovery and stock markets, with valuations at all-time highs. The Fed may
therefore be forced to let inflation run. Even their currently planned rate hikes, which
will come in 2023 at the earliest, may prove too limited to really curb an inflation that
really getting control.
For gold, a moderate to high inflation should be a strong driver and the gold price
would likely decline only if inflation comes down, and a non-inflationary expansion
somehow occurs, similar to the 2013-2018 period, which we view as unlikely. If the
Fed is far more aggressive on stimulus reduction and rate hikes than anticipated, the
resultant likely economic and market crash could send investors into gold on safe
haven buying. The outcome for gold stocks would be mixed, with pressure from a
sell-everything moment in equity offset by the upward move in gold.
However, this would likely drive the Fed right back to its easy money ways, offering
gold further support. For now, we expect that inflation will continue to surprise to the
upside, keeping the wind at gold's back, and for gold stocks, the average price of
US$1,800/oz this year provides strong margins for most producers, and in turn,
provides incentives for producers and other investors to back to the exploration
activities of junior gold mining operations.
2) Gains and valuations for largest TSVX juniors
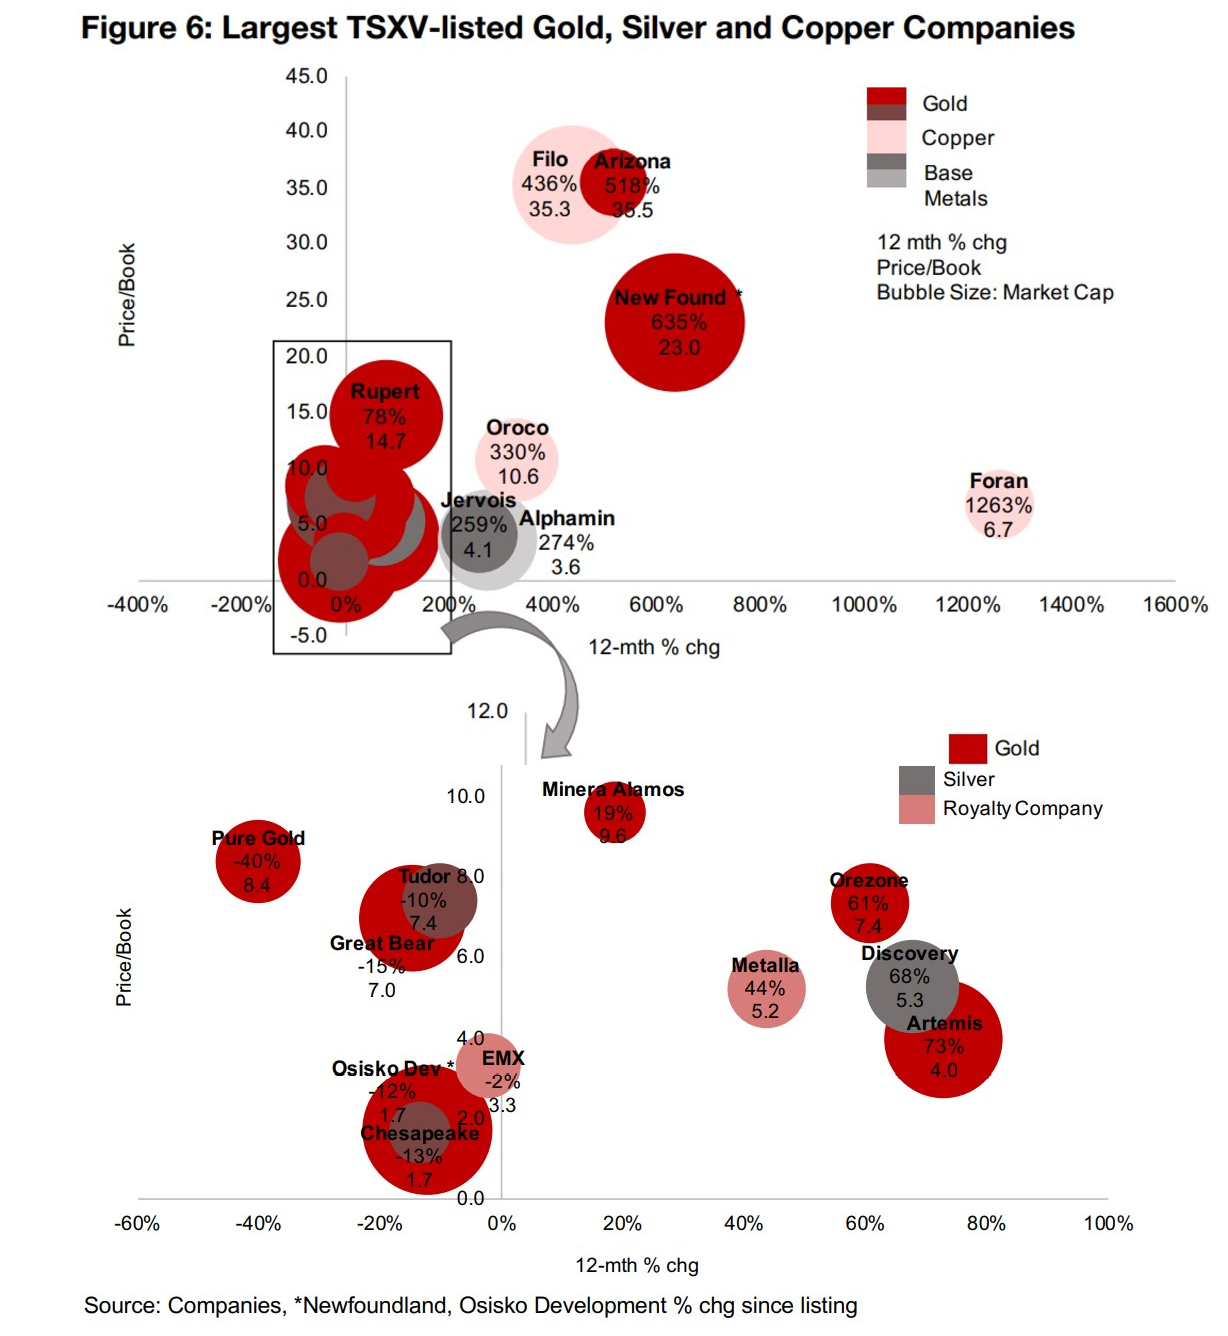
Huge rise over the past year for New Found, Arizona, Filo and Foran
This week we look at the current largest TSXV-listed gold, silver and copper juniors,
and their price performance over the past twelve months and their price to book
valuations, to outline the big movers, the laggards, and which are potentially over and
undervalued. Most are gold miners, but some of strongest performers are copper
companies, driven by a rise in the copper as gold and silver prices have lagged.
Four of the companies have significantly outpaced the rest of the market, with these
gains driving up the price to book valuations of three to by far the highest of the group.
The largest in terms of market cap is New Found Gold, which is seeing extremely
strong drilling results from its Queensway project, up 635% since its listing in August
2020, and trade at a P/B of 23.0x (Figure 6). Arizona Metals, which has seen strong
results from the Kay gold-copper-zinc project, it up 518%, reaching a P/B of 35.5x.
The other two are copper miners; Filo Mining has seen strong exploration results from
Filo Del Sol, sending its share price up 436% and P/B to 35.3x, while the strongest
performer of the group has been Foran, with strong results from its McIIvenna project,
sending it up 1263%, although its P/B has only risen to a moderate 6.7x.
Strong gains from Oroco, Alphamin and Jervois
Three other companies have seen over 200% gains, but trade at relatively low valuations, all of which are base metals juniors. Oroco has seen promising very early-stage exploration results at its Santo Tomas copper project, with drill programs just approved, rising 330%, with a P/B of 10.6x, Alphamin, operating Mpama, the highest grade tin mine in the world, is up 274% this year, with a P/B of 3.6x, and Jervois, operating the ICO cobalt-copper gold mine, is up 259%, and trades at a P/B of 4.1x.
Gold juniors Artemis, Orezone and Minera Alamos see decent gains
Other gold juniors have seen decent gains, but below 100%. Artemis Gold is developing the large and advanced stage Blackwater gold project, with financing and permitting activities currently ongoing, and is up 73%, with a P/B at 4.0x. Orezone is operating Bombore, with mine construction ongoing, up 61%, with a P/B of 7.4x. Minera Alamos has three gold projects at advanced stages and is up 19% this year, with a P/B at 9.6x.
One silver company in group, Discovery, and two Royalties companies
There is only one silver company in the group, Discovery Silver, operating the Cordero
project, which has seen strong drilling results, and is up 68%, with a P/B of 5.3x.
There are two royalties companies in the group, Metalla, which has been aggressively
expanding its portfolio, and is up 44%, with a P/B of 5.2x, and EMX, which has a very
large portfolio of royalties diversified across both global regions and metals, which is
down -2%, and trading at a P/B of 3.3x.
Tudor, Chesapeake, Osisko Development and Pure Gold see declines
Four of the companies have declined over the past year. Tudor Gold, operating the
Treaty Creek project, is down -10%, with a P/B of 7.4x. Osisko Development,
operating the Cariboo gold project, is down -12% from its January 2021 listing.
Chesapeake Gold has declined -13%, as it attempts to improve the economics of its
large Metates project using a new technology. Both Osisko Dev and Chesapeake
trade at a P/B of just 1.7x, the lowest of the group. Two companies operating in Red
Lake, Ontario were major gainers in 2020, but Great Bear has declined -15%, with a
P/B of 7.0x, and Pure Gold has declined -40%, with a P/B of 8.4x.
Producers all rise on increase in gold
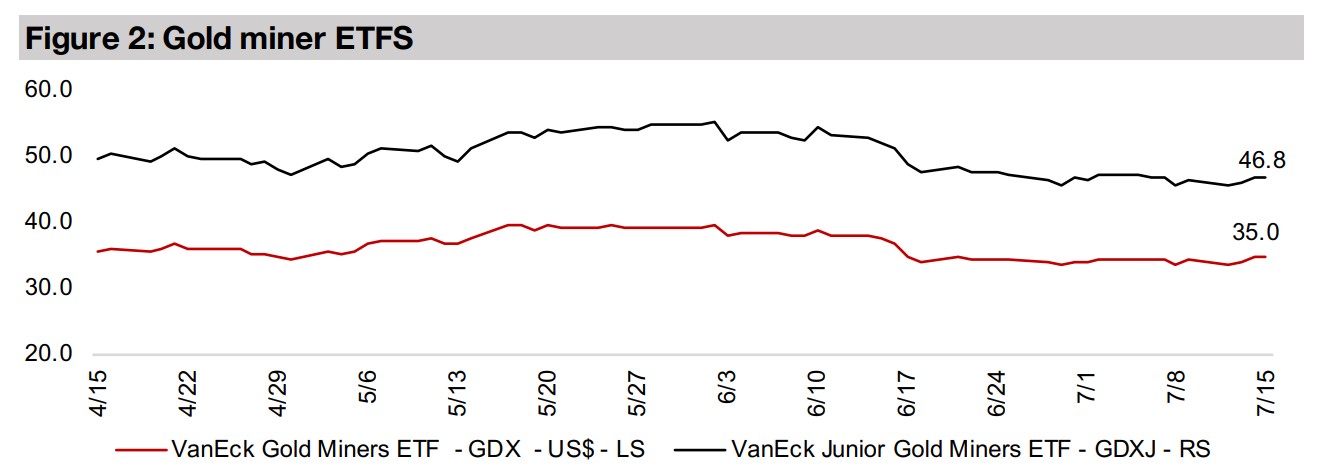
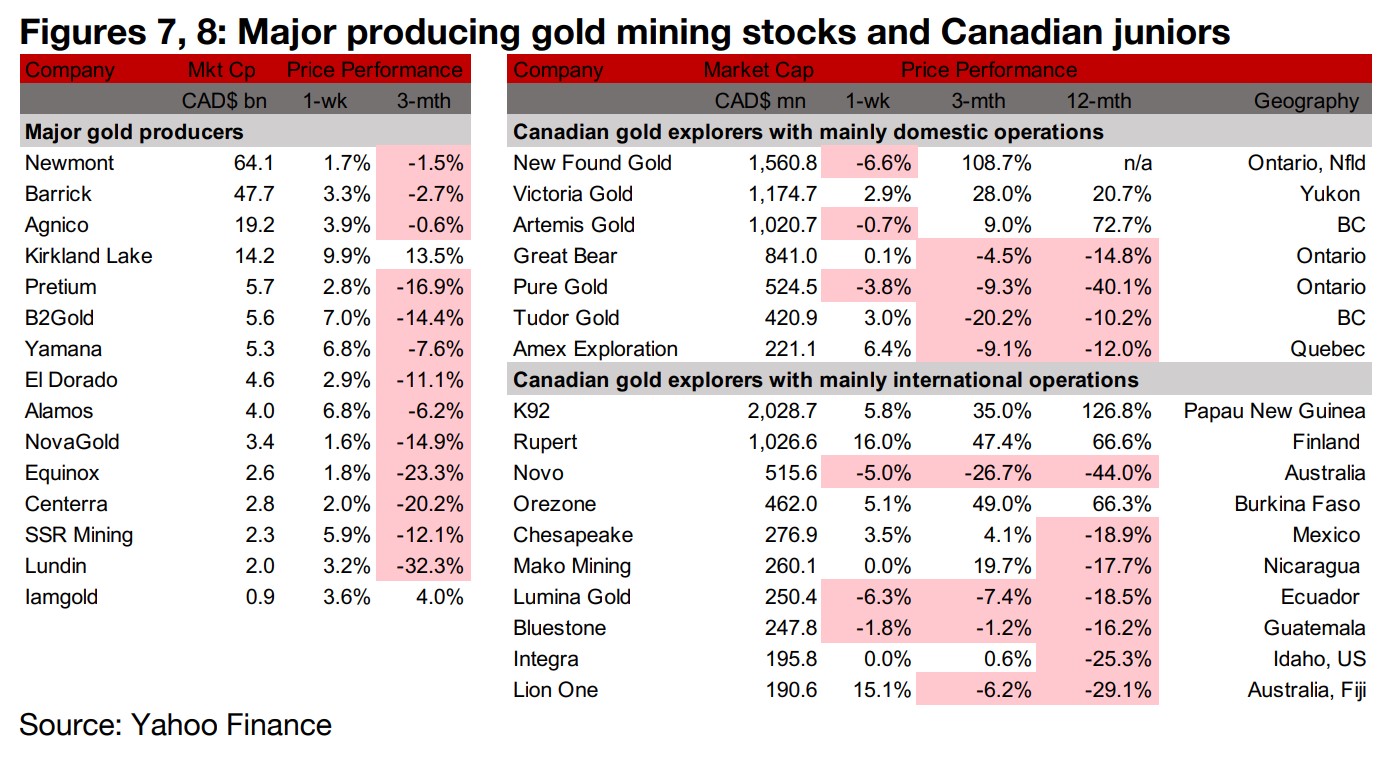
The major gold producers all rose this week on the continued increase in gold (Figure 7). News flows included Barrick providing an update on operations in Cote D'Ivoire and Kibali in the DRC and Agnico-Eagle providing a H1/21 exploration update including the discovery of a new mineralized horizon south of East Gouldie. Kirkland Lake, Eldorado and Lundin reported Q2/21 production and Alamos reported results from Young-Davidson, extending gold mineralization outside of existing Mineral Reserves and Resources (Figure 9).
Canadian juniors mixed as gold rises
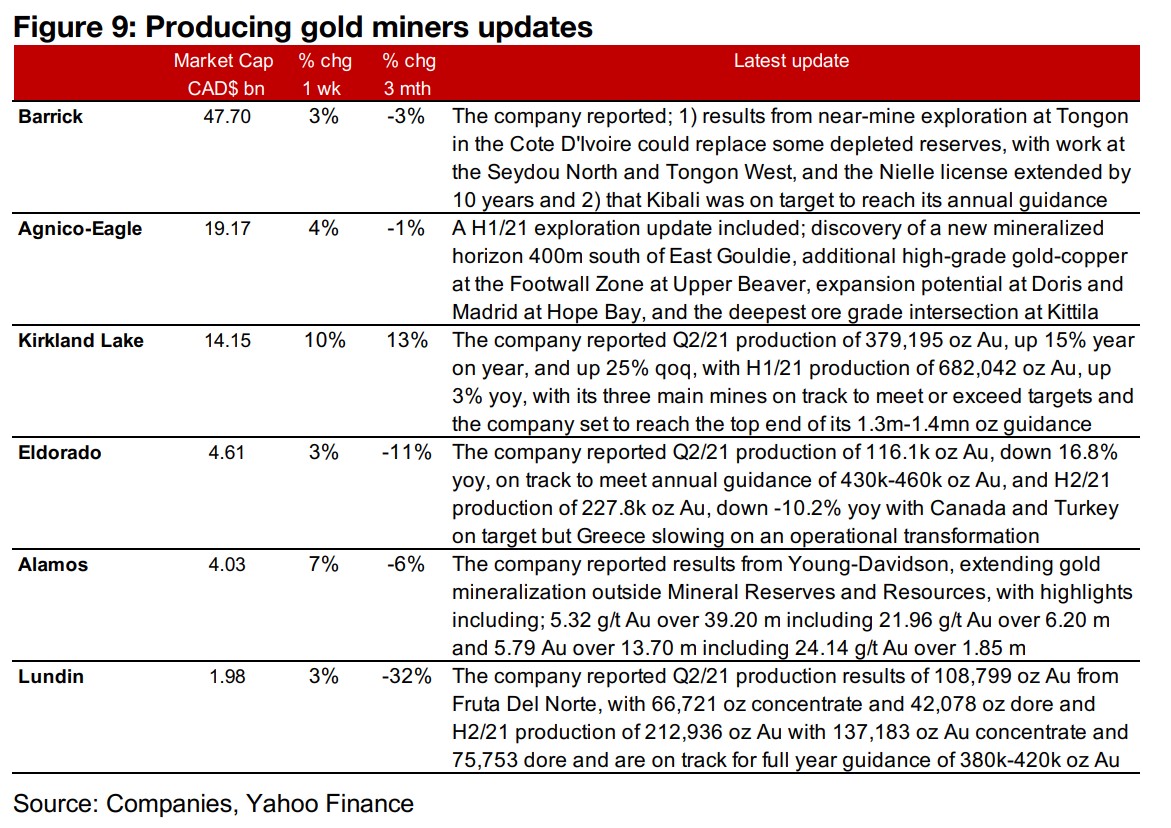
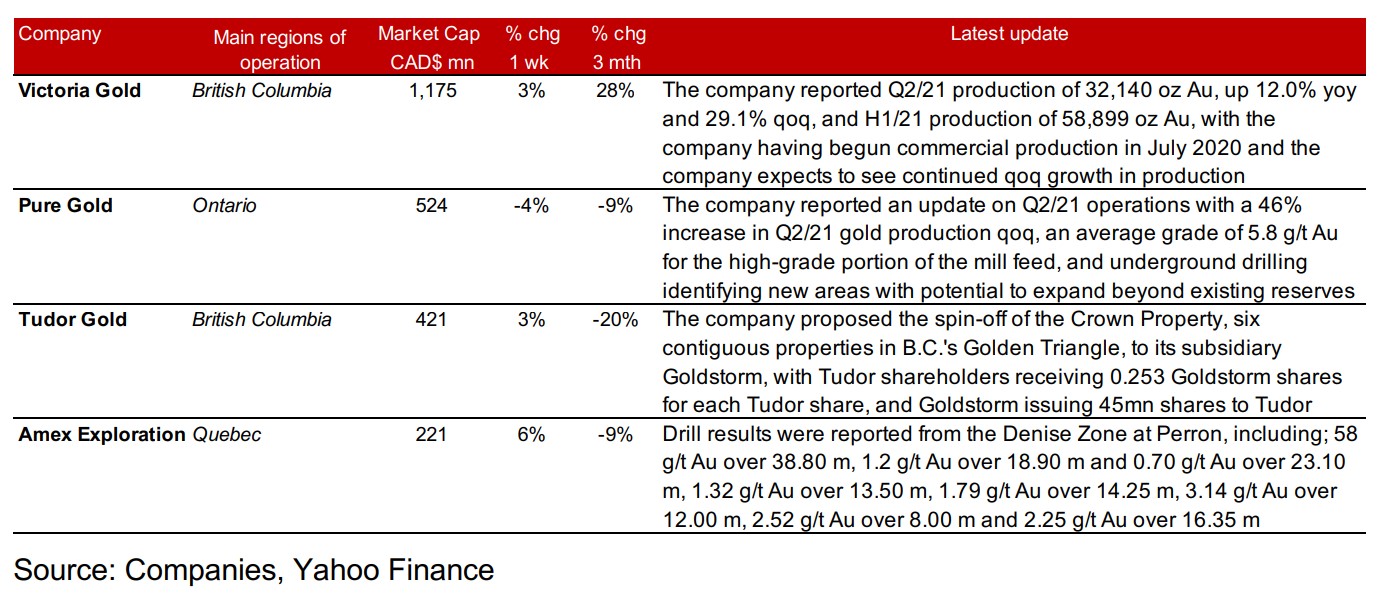
The Canadian juniors mixed this week as gold continue to rise (Figure 8). For the Canadian juniors operating domestically, Victoria Gold and Pure Gold reported updates on Q2/21 operations, Tudor proposed a spin-off of its Crown property and Amex reported results from the Denise Zone at Perron (Figure 10). For the Canadian juniors operating mainly internationally, Novo reported an update on Q2/21 operations at Beatons Creek and Mako Mining provided an update on production at San Albino, with commercial production effective from July 1, 2021 (Figure 11).
Figure 10: Canadian junior gold miners operating in Canada updates

Disclaimer: This report is for informational use only and should not be used an alternative to the financial and legal advice of a qualified professional in business planning and investment. We do not represent that forecasts in this report will lead to a specific outcome or result, and are not liable in the event of any business action taken in whole or in part as a result of the contents of this report.


