February 10, 2025
Gold Bull Market May Be Maturing
Author - Ben McGregor
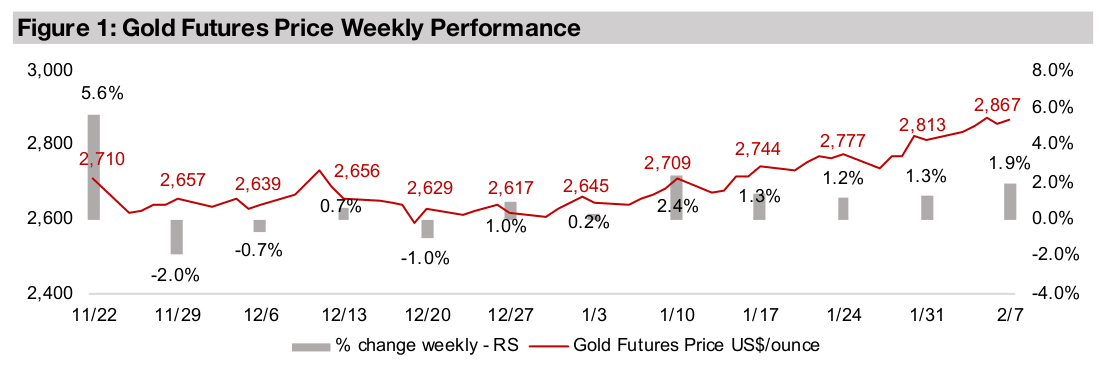
Gold heading for two straight months of gains
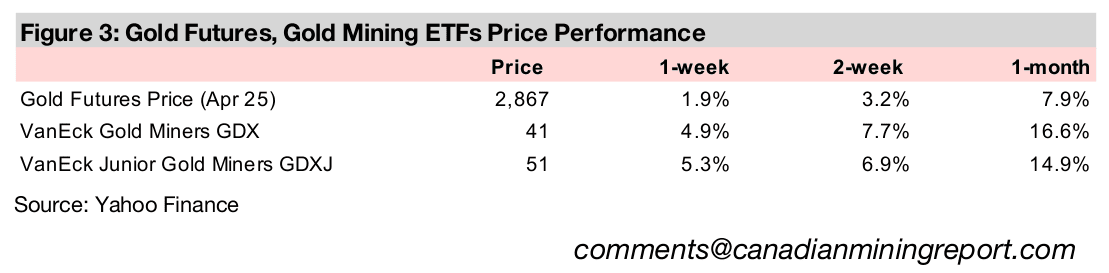
Gold rose 1.9% to US$2,867/oz, up for a seventh week, and has blown through two key benchmarks, likely driven by the increased perceived risk from continued major US policy shifts, as a major economic release of US jobs data was relatively neutral.
Gold ratios versus other assets not showing severe overvaluation
This week we look several key ratios for gold versus other metals, commodities, markets and stocks which overall show the metal as still only moderately overvalued, although there are indications the bull market could be shifting into its final phase.
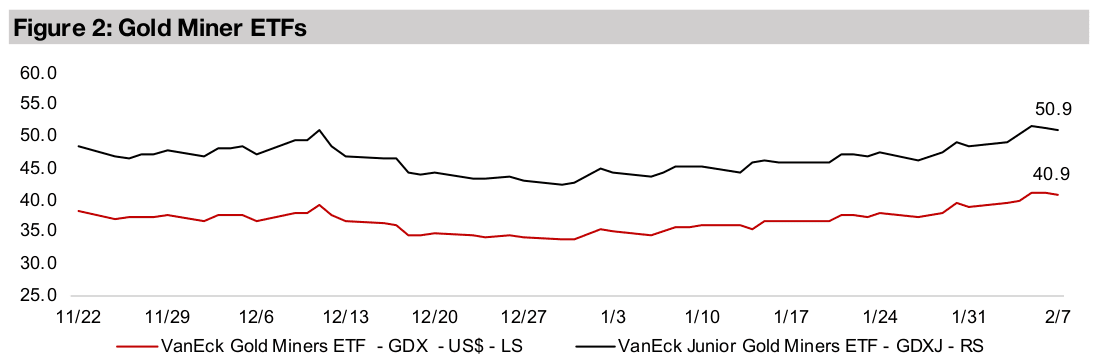
Gold producers and juniors back to recent highs
The GDX and GDXJ rose 4.9% and 5.3% and have made it back to their most recent December 2024 highs as the broader retail market seems to have started to take an increased interest in the sector after the extended bull run in the metal.


Gold Bull Market May Be Maturing
Gold rose 1.9% to US$2,867/oz, up for the seventh week in a row, with the major economic news being US employment data, although this showed a mixed picture and was likely relatively neutral for the metal price. While US payrolls for January 2025 of 143k came under expectations for 169k, the unemployment rate declined to 4.0% from 4.1% in the previous month. What could be giving gold a lift is the ongoing implementation of huge policy shifts by the new US administration in many areas. These are driving uncertainty not just domestically, but are also expected to have major global consequences, increasing perceived risk and boosting gold.
Checking in on gold’s relative valuations versus other assets
The price has run so far so fast, that this week we look at gold’s value relative to
several assets to check whether the metal is getting ahead of itself and entering
bubble territory. These include the value of the gold stock versus the global money
supply and fixed income securities and the ratio versus other precious metals and
copper, oil and other commodities, the S&P 500 and gold stocks. All of these give an
‘anchor’ to gold’s valuation, and while timing turning points is difficult, they can
identify roughly we are in the cycle, in terms of under or overvaluation. While overall
these ratios show gold at worst only in moderately overvalued territory, there are
signs we are at the ‘beginning of the end’ of the gold bull market.
One piece of evidence is the increased discussion of gold and gold miners seen on
mainstream business channels. This was rare over the first four years of the gold bull
market and suggests retail interest is rising, as does the huge jump in sector ETF
inflows especially in H2/24. Also, while the major policy and investment banks
consistently underestimated gold from 2019 to 2023, from H2/24 some have boosted
targets as high as US$3,000/oz, ‘getting ahead’ of the price for the first time in years.
Only the global central banks had really been on top of this trade, as big buyers over
the past five years, but they eased off on net purchases in 2024 versus 2023.
Both investment banks and retail both turning bullish on gold after such a long period
of indifference could be viewed as negative, as it may imply the end stages of the
gold bull market are starting, which could mean a blowout parabolic move and a
collapse. The question then becomes how far straight up it could go; given moderate
levels for these gold ratios, the answer seems to be quite a bit more. But for the first
time in five years, we are shifting more towards a ‘caveat emptor’ stance on the metal.
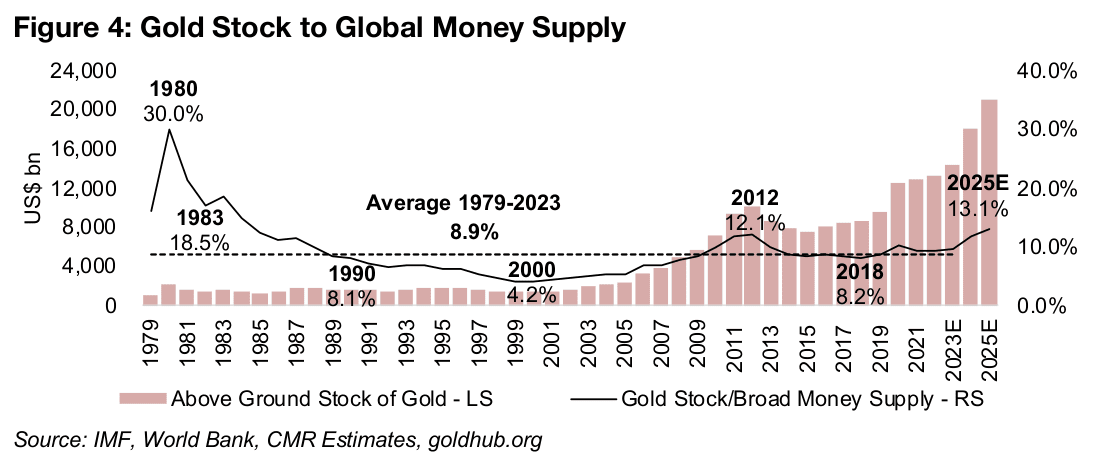
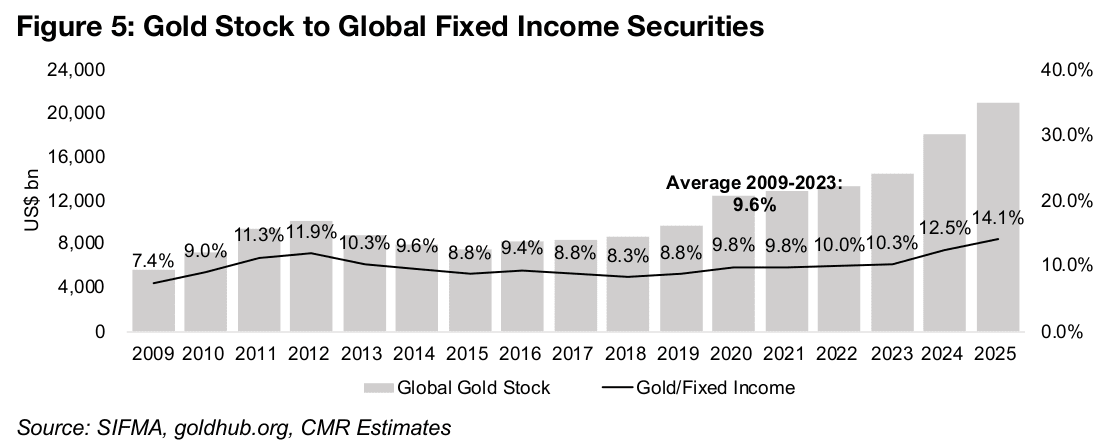
High ratios of gold stock value to money supply, fixed income, could be justified
Two core measures of the gold price are the value of the above ground gold stock
versus the global money supply and the value of global fixed income markets. With
gold often considered to be the base of the global monetary pyramid, these two could
be viewed as leveraged on top. With the physical gold stock increasing only around
2.0% per year, these ratios tend to be balanced by moves in the gold price.
The gold stock to global money supply does look high versus its recent history, with
our estimate of 13.1% for 2025, based on IMF GDP growth estimates and the
assuming the money supply to GDP ratio holds flat at 139% (Figure 4). This is the
highest since 12.1% in 2012, at the previous peak for the gold price, and well above
the 8.9% average from 1979-2023. The gold stock to the value of fixed income
securities is also expected to rise in 2025E to 14.1%, assuming a 3% rise in
outstanding debt (Figure 5). This is also high compared to recent years and well above
the 9.6% average from 2009-2023.
This could initially be viewed as being caused by the gold price getting too high.
However, it could also be seen as the market pricing into gold expectations that both
the global money supply and debt will be increased significantly in response to an
economic crisis. If this were to occur, then these ratios could be pulled down to, or
even below, these recent averages. Even if the gold stock to money supply ratio
headed for 15.0%, it would still only be at half of the 30% peak in 1980, and it seems
a gold bubble could clearly be called only if these ratios started to head for 20.0%.
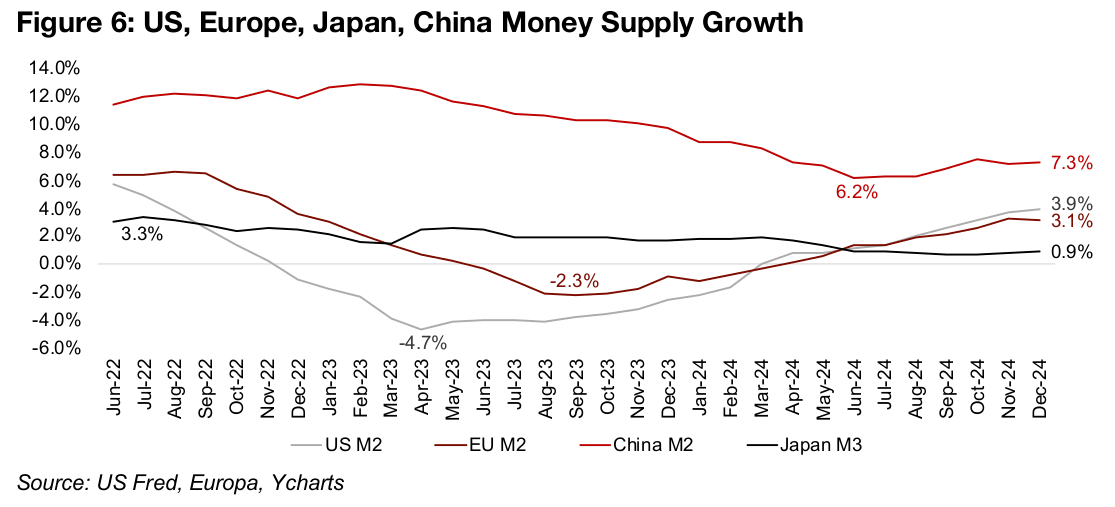
Global money supply growth is still trending up, with the US and European M2 growth
having reached above zero in mid-2024, after rebounding from extended contractions
with lows in April 2023 and September 2023, respectively (Figure 6). The M2 growth
in the US and Europe reached 3.9% and 3.1% in December 2024, with the former at,
and latter just below, their highest levels in over two years. While in the US this M2
growth could slow as the Fed has paused on rate cuts, the European Central Bank
recently cut rates further. We do not expect a major decline in M2 growth for either
this year and see a risk that an economic slowdown could drive more rate cuts.
While China’s rate of M2 growth never went near zero, it dropped by around half from
mid-2022 to a low of 6.2% in mid-2024, but has also started to increase again,
reaching 7.3% in December 2024. Japan’s M3 money supply growth has been low,
but not negative, over the past two years, and was at 0.9% in December 2024. The
expansion of the money supply also tends to correlate with a rise in the value of the
fixed income securities and so could continue to also drive up that ratio versus gold.
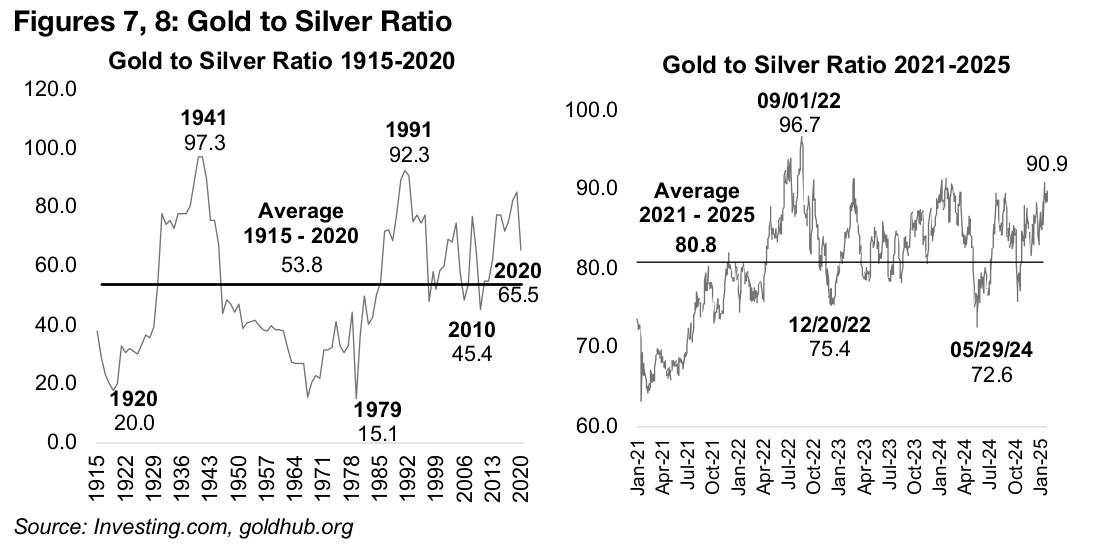
Gold to silver ratio jumps as monetary drivers could dominate
Looking at gold’s ratios versus commodities can start with the metal’s closest cousin,
silver, which is also driven by monetary factors, but only partly, with industrial factors
also key in its movements, similar to copper, making it a hybrid between the two. The
gold to silver ratio has gotten high at 90.9x, and it has only exceeded this level three
times since 1915, in 1941, 1991 and 2022 (Figures 7, 8). This is above the medium
average of 80.8x since 2021, and even further ahead of the average 53.8x from 1915-
2020. However, it is questionable if this long-term average is still applicable, and
whether the ratio will hit levels of 20.0x or below again, given structural changes in
the industries over time.
The currently high ratio seems to indicate that the market expects industrial factors
to be a drag on silver, offsetting some of the upside from the monetary factors. These
have been driving up the silver price in recent months, but just by much less than the
rise in the ‘pure monetary play’ gold. Silver’s underperformance is also interesting
given that 2024 was the fourth year of major supply demand deficit for the metal, and
this is expected to continue into 2025. While if the deficit surprises to the downside,
this could pull down the ratio more towards the recent average, if economic growth
surprises to the downside, this may be offset by lower silver demand.
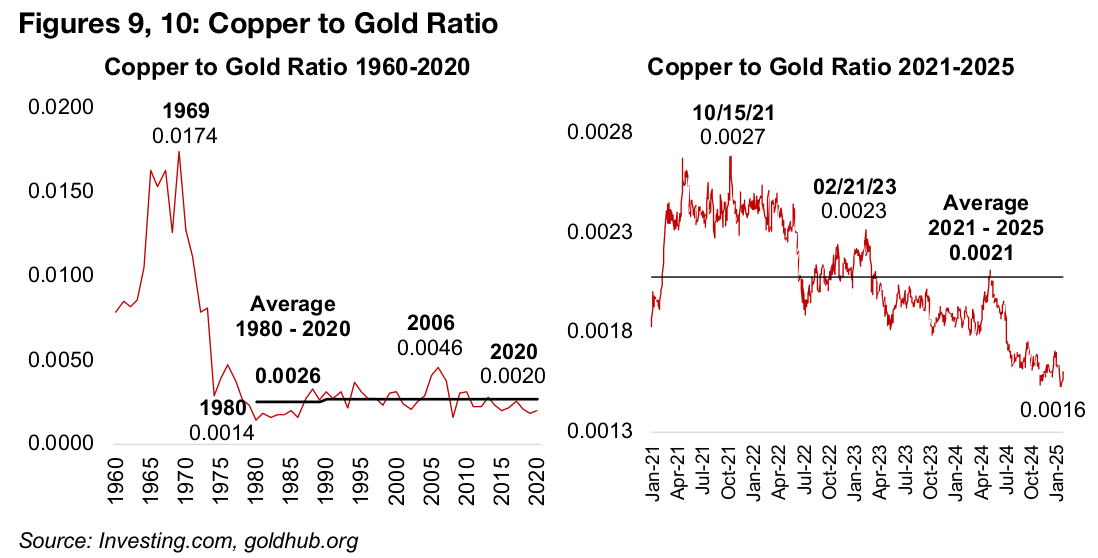
Copper to gold slumps, platinum to gold rises, on industrial concerns
Copper is almost entirely driven by the industrial cycle and a proxy for global
economic growth, with monetary factors having little effect. The copper to gold ratio
has slumped to just 0.0016x, well below the 2021-2025 average of 0.0021 and the
1960-2020 average of 0.0026 (Figures 9, 10). This implies the market is pricing in slow
economic growth relative to monetary expansion, or stagflation, which was occurring
the last time the ratio was this low, in the mid-1970s to early-1980s. If the market
proves wrong, and economic growth surprises to the upside, it would mean gold is
overvalued relative to copper, but we do not weight this scenario highly.
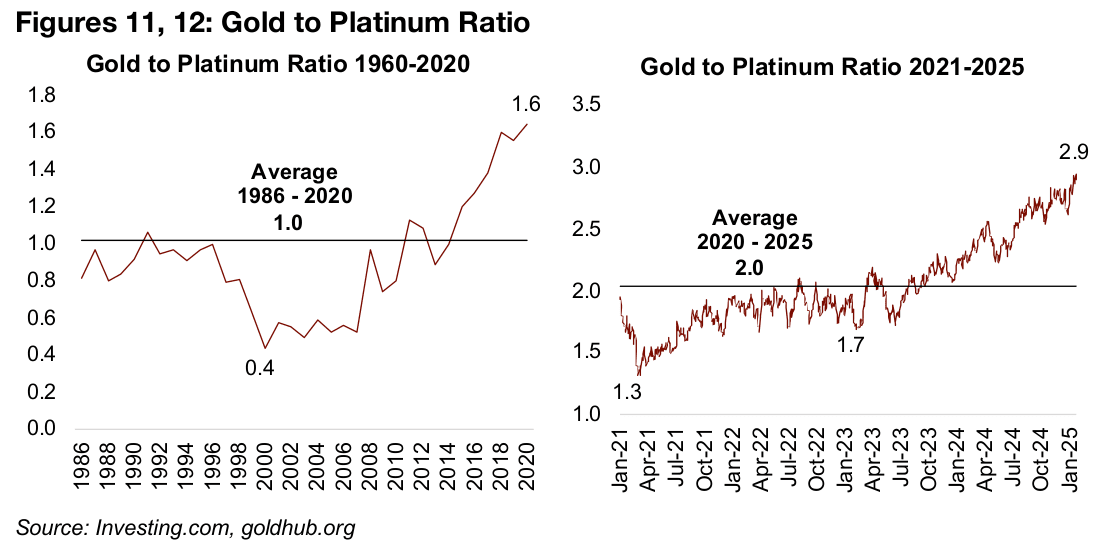
The platinum to gold ratio has surged to 2.9x, by far its highest in decades, and well
above its 2021-2025 average of 2.0x and 1986-2020 average of 1.0x (Figures 11, 12).
While this also suggests a negative economic growth outlook, it is more specific than
the broad indicator of copper. This is because the majority of the metal’s demand
coming from the auto industry, for use in autocatalysts, and the high ratio therefore
implies a relatively weak outlook for the sector. Platinum also does have a component
of demand driven by monetary factors, but this is to a much smaller degree than gold
or silver.
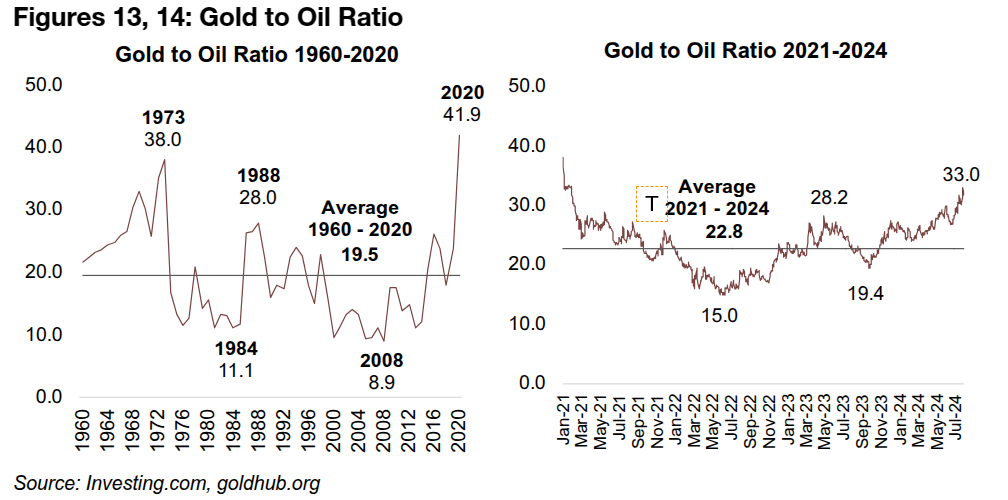
Gold high versus oil, but only moderately ahead of CRB
For commodities outside of metals, gold is often compared to oil, with the two tending to revert long-term towards an average ratio of 19.5x from 1960-2020, with the more recent average from 2021-2025 only slightly above this, at 22.8x (Figures 13, 14). At 33.0x currently the gold to oil ratio is high versus the historical averages and could again be implying weak global industrial demand coupled with a major monetary expansion. There could also be pressure on the oil price from plans for a major expansion in oil output from the US, and the new administration has also asked other large global producers to increase output, which could increase supply and hold down the price.
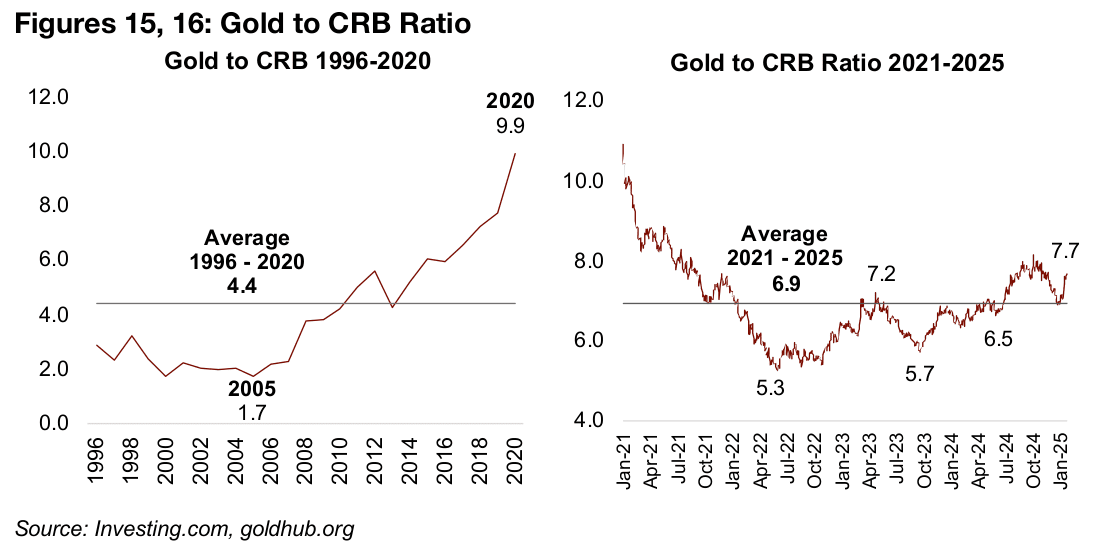
Gold can also be compared to commodities more broadly using the CRB Index, which includes agricultural products, metals and fossil fuels. While the long-term average of gold to CRB from 1996-2020 was just 4.4x, it has been considerably higher from 2021-2025, at 6.9x (Figures 15, 16). The ratio actually declined in January 2024 briefly to this average, although it has risen to 7.7x since. The ratio has stayed closer to the recent average than other metals and oil because many commodities prices have jumped over the past year, including natural gas, gasoline, coffee, orange juice, sugar, corn, cocoa and cattle. The market may expect monetary expansion to continue driving up many CRB constituents and see it more track closely to gold.
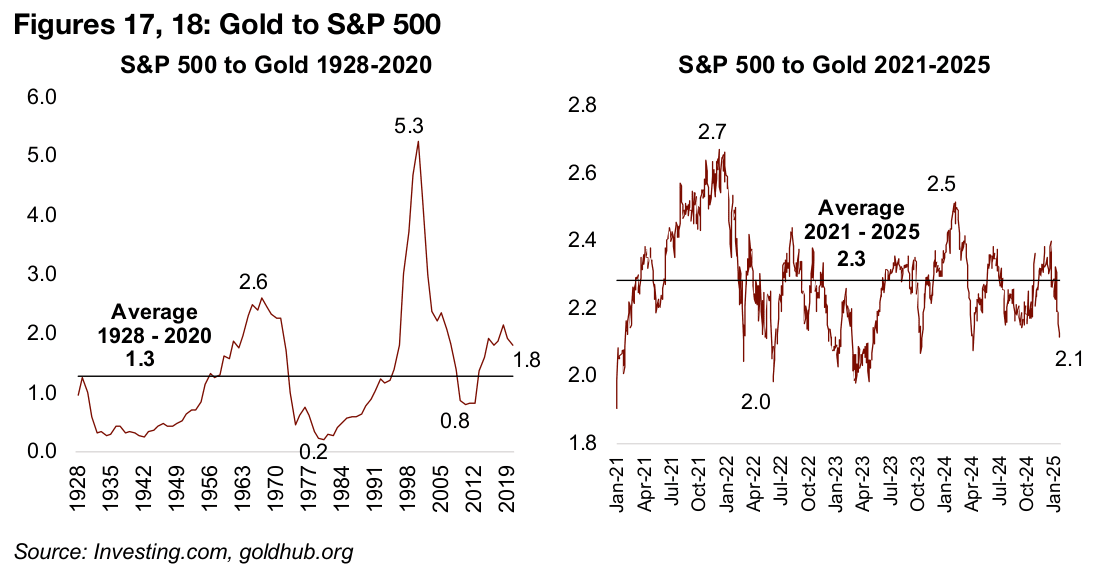
Gold only slightly ahead of S&P 500, but gold stocks lagging
Gold can also be compared to equity markets and sectors, specifically the S&P 500
and gold stock indices and ETFs, as a check on over or under valuation. The S&P
500 to gold ratio has also seen a major rise in the average from 1.30x long-term from
1928-2020 to 2.3x from 2021-2025 (Figures 17, 18). Based on this more recent
average, the current ratio of 2.1x indicates gold as only moderately overvalued,
although excluding the huge spike to 5.3x during the dot.com bubble, the ratio is
towards to the high end of the long-term range.
However, there remains the risk of an S&P 500 correction, with it supported mainly
by a handful of tech stocks trading at historically extremely high valuations, with most
other sectors in the S&P 500 having only moderate multiples. Such a decline could
see the S&P 500 to gold ratio drop well below the recent average, but it may still not
get to historical lows of 0.8x during the 2008-2009 global financial crisis or 0.2x during
the economic malaise of the late 1970s.
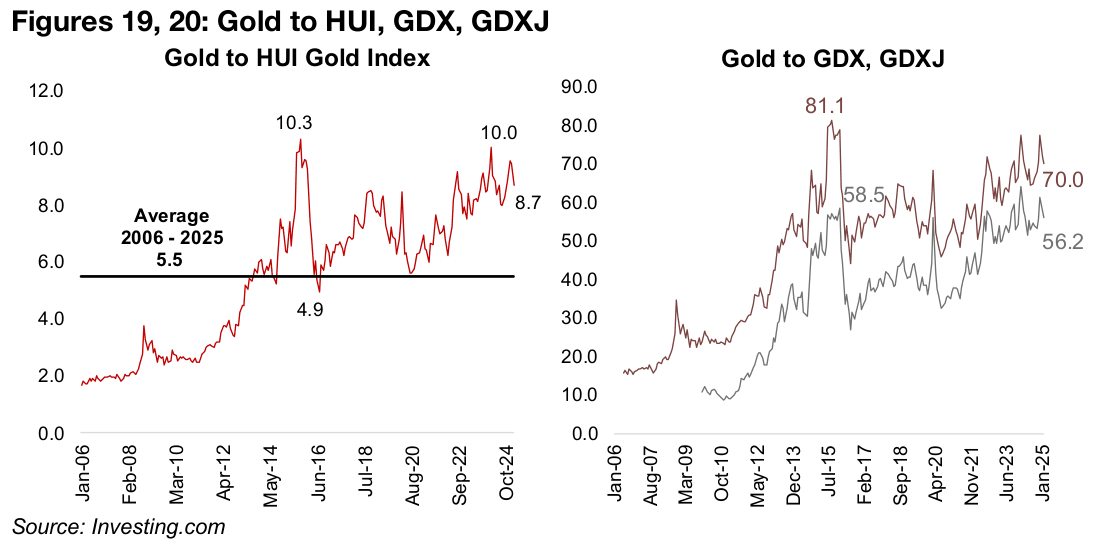
Gold versus HUI Index, GDX and GDXJ ETF, historically high
Gold can also be compared to the stocks directly in the sector, including the HUI Gold Index and GDX ETF of producers and the GDXJ ETF of juniors. The gold/HUI ratio at 8.7x is moderately below long-term highs of around 10.0x (Figure 19). The gold to GDX and GDXJ ratio have trended up for the past five years to 70.0x and 56.2x, and both have just moved ahead of their previous highs in the early 2010s (Figure 20). This shows that market is still not entirely pricing in the gains in the metal to stock prices and seem to be still expecting a pullback in the price.
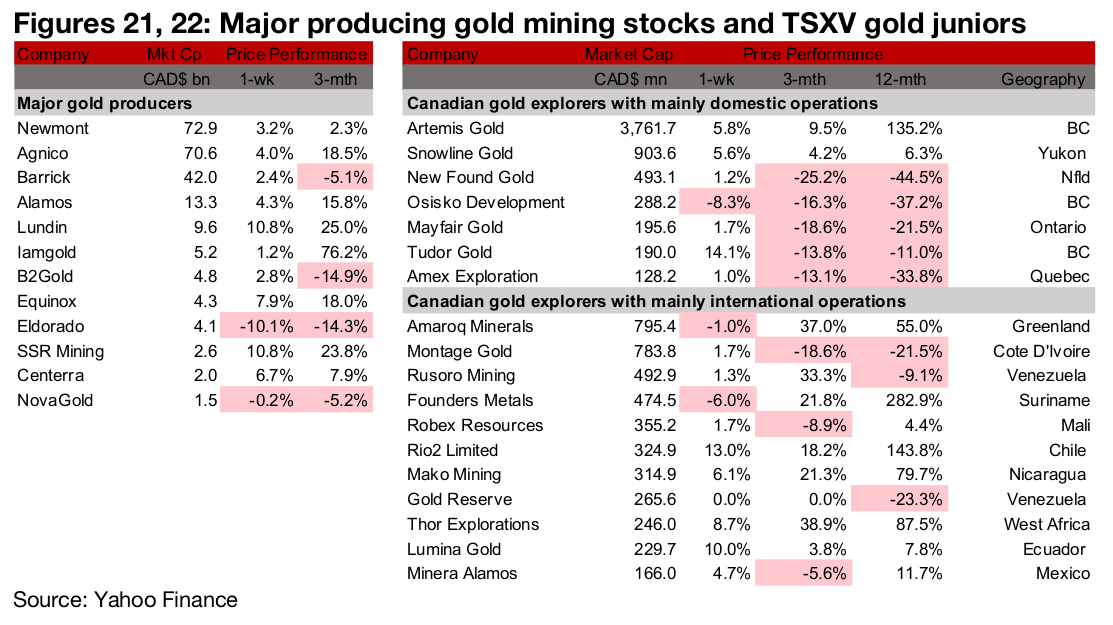
Most large gold producers and TSXV gold rise
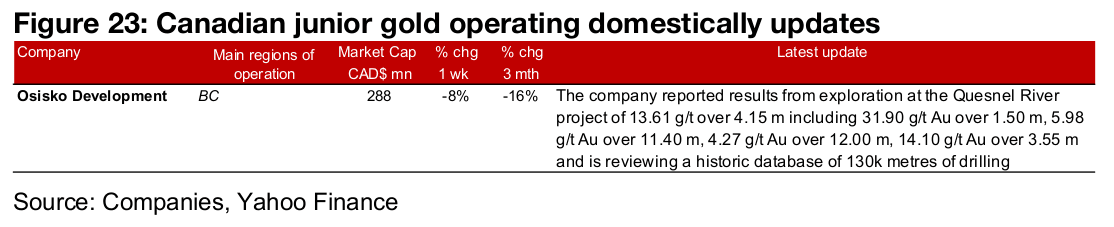
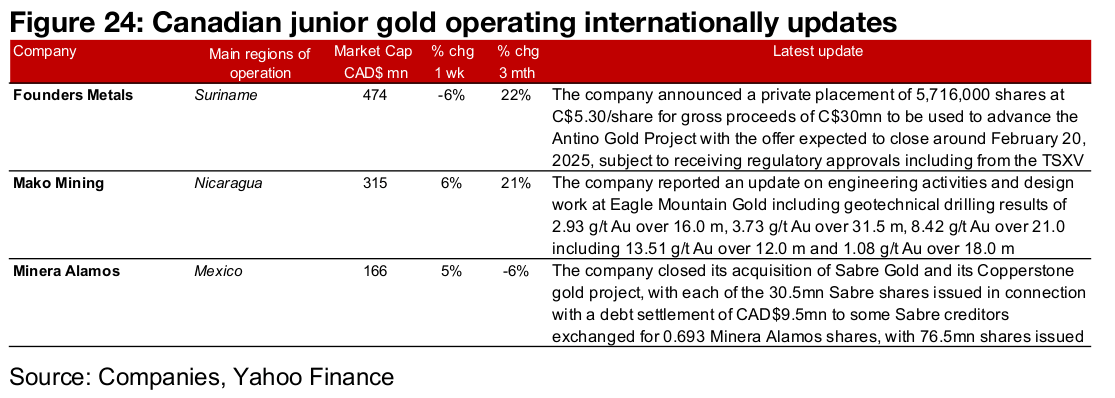
Most of the large gold producers and TSXV rose on the gain in the metal price (Figures 21, 22). For the TSXV gold companies operating domestically, Osisko Development reported exploration results from the Quesnel River project and is reviewing a historic drilling database from the project (Figure 23). For the TSXV gold companies operating internationally, Founders Metals announced a CAD$30mn private placement, Mako mining reported an update on engineering activities and mining design work at Eagle Mountain including geotechnical results and Minera Alamos closed its acquisition of Sabre Gold and its Copperstone gold project (Figure 24).
Disclaimer: This report is for informational use only and should not be used an alternative to the financial and legal advice of a qualified professional in business planning and investment. We do not represent that forecasts in this report will lead to a specific outcome or result, and are not liable in the event of any business action taken in whole or in part as a result of the contents of this report.