August 05, 2024
Gold Breaks Through Ceiling
Author - Ben McGregor
Kazakhstan supply pump further pressures uranium price
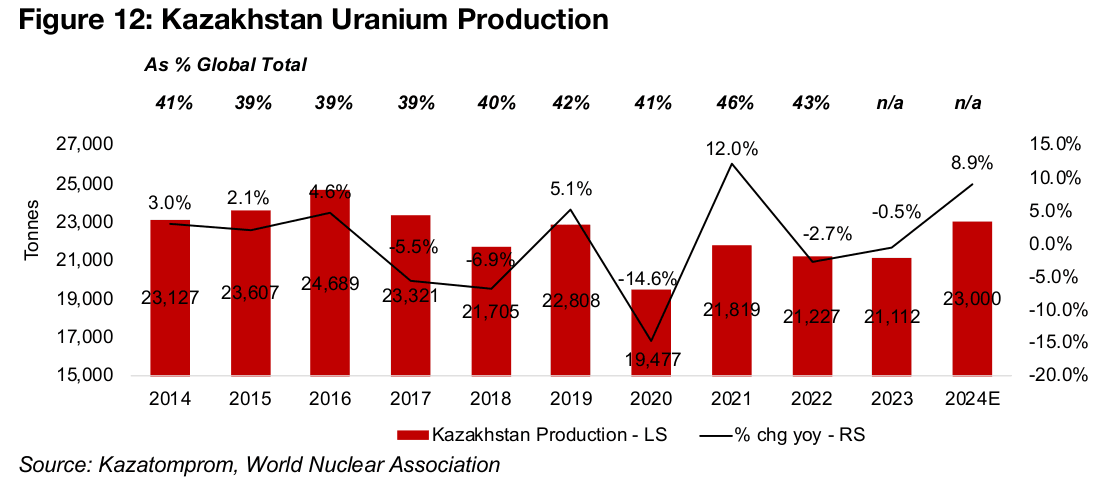
A continued uranium downtrend was exacerbated this week by a nearly 5% increase in production guidance from Kazakhstan’s Kazatomprom, the largest global producer of the metal at over 40% of the total, implying a 9% rise in its output year on year.
Large cap gold flat, juniors down in equity sell-off
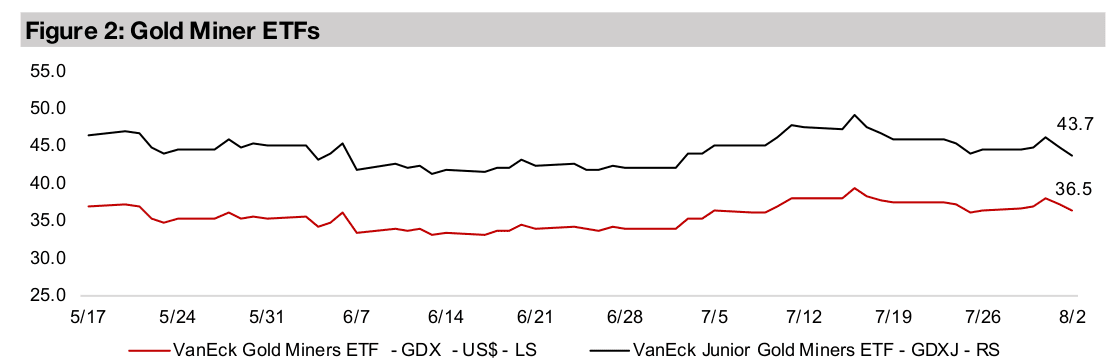
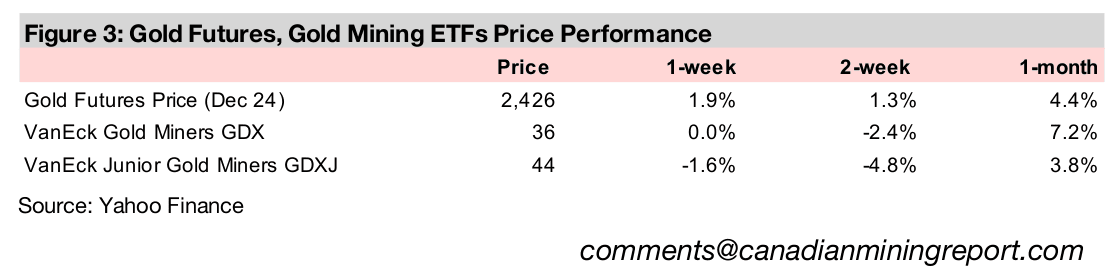
While large cap gold was flat, leaving the GDX unchanged, it still outperformed the broader equity sell off, with the S&P 500 down -2.3%, but the GDXJ declined -1.6%, hit by plunging small caps, with the Russell 2000 Index down -6.9%.


Gold Breaks Through Ceiling
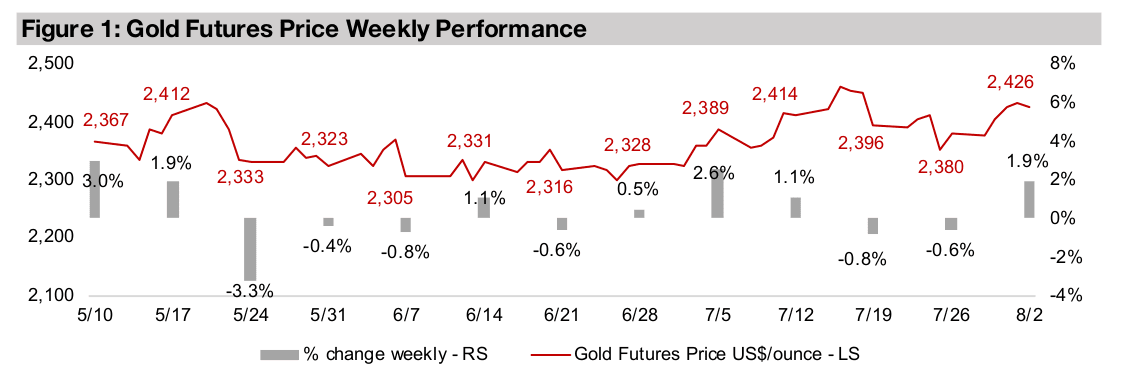
Gold rose 1.9% to US$2,426/oz, and briefly broke through US$2,500/oz at the end
of the week on heavy selling in equity markets and a general flight to safety. The main
immediate catalysts were U.S. Q2/24 earnings, especially in the tech sector, that were
less impressive than in recent quarters, followed by a weak U.S. jobs report. However,
there had been a much broader set up for this selling over a long period, especially
from over a year of high interest rates and a continued ramp up in market valuations.
Icon and logotype
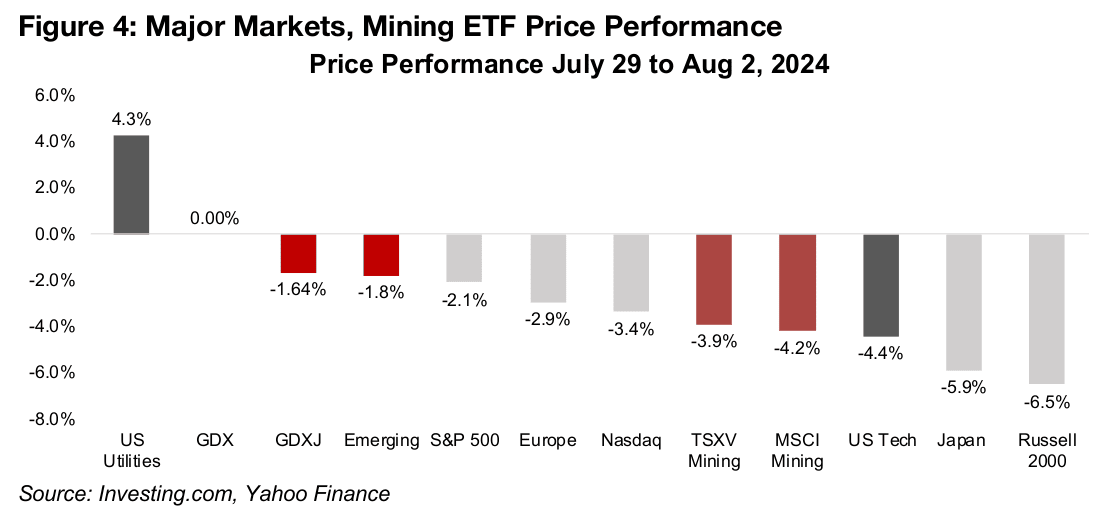
The previously ‘teflon’ U.S. tech sector took one of the largest hits, slumping -4.4%,
only surpassed to the downside by a -5.9% drop in Japanese equities on an
unwinding carry trade, and -6.5% plunge in the Russell 2000 small cap index,
reversing about half of its 11% jump in July 2024 (Figure 4). As we have highlighted
often this year, U.S. Tech’s increasingly excessive valuations were setting
expectations so high that even a hint of a slowdown could make markets nervous.
This seems to have been this case for Q2/24 earnings, which were overall not that
weak, with Apple and Microsoft beating, Alphabet inline with, and Amazon missing,
expectations. However, the results had a sprinkling of some concerning operational
trends in the details which were enough to drive a sell-off. The tech earnings were
also unimpressive versus particularly strong results in the previous few quarters.
The tech weakness obviously dragged down the Nasdaq, which dropped -3.8%, and the S&P, off -2.3%, which is also heavily weighted to the sector. However, there was also a -6.9% collapse in the Russell 2000 small cap index, which is not particularly tech driven. This was concerning given that a jump in the Russell 2000 over the past month had seen markets finally shifting to taking on more risk outside of just Big Tech, but this trend may have proved to be a short-lived one.
Underlying risk-off shift already underway goes into overdrive
While the move this week looks sudden, we view it as just a more aggressive version
of a gradual shift towards safety which had already been underway for much of this
year. Even as markets continued to pile into tech this year, they were also hedging
their bets, certainly more than in 2022 or 2023. This is shown by the strong
performance of safe havens like gold, gold stocks and utilities, with the latter one of
the ultimate ‘defensive sectors’ and soaring 4.4% this week, far outpacing the market.
There also seems to have been a key shift in the stance of markets from bad
economic news being perceived as good, because it would mean central banks could
lower interest rates, to bad news simply being considered bad again. Markets had
enjoyed a long ‘grace period’ over the past two years, with major rate hikes bringing
down inflation, but not curbing economic or corporate earnings growth, especially for
tech. They had therefore focussed more on the potential for a drop in rates to keep
the equity gains going and seemed less concerned about earnings risks.
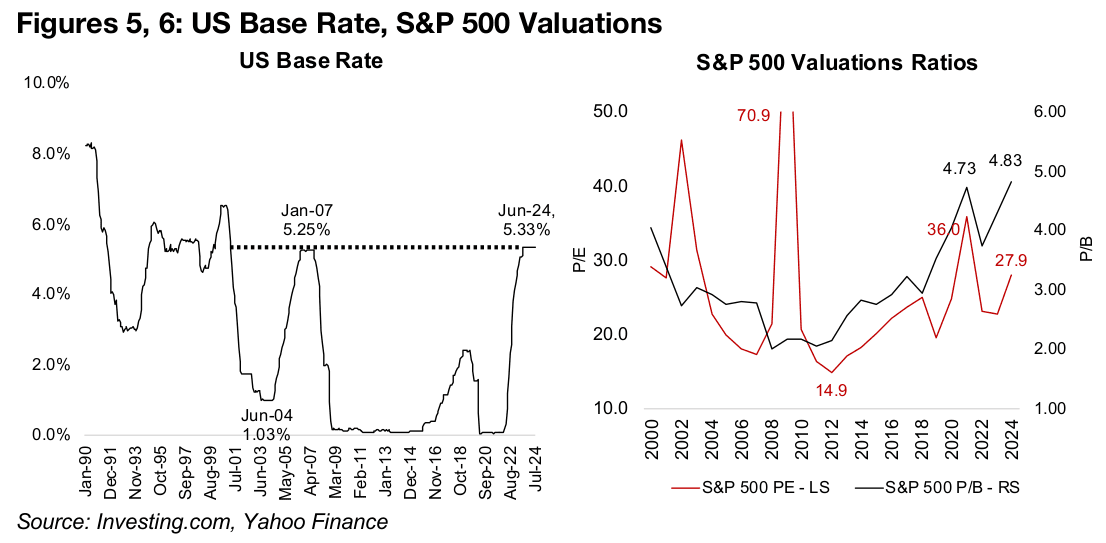
However, this was bound to end, with interest rates spiking and market valuations
continuing to skyrocket. The U.S. base rate rose from near zero in early 2022 to over
5.0% by mid-2023, where it has been maintained for nearly a year (Figure 5). As
theoretically such a spike in rates would be likely to severely dampen economy
activity and drag down equity market valuations, the real surprise is less the selling
this week and rather how long the market held it off with sheer exuberance.
There could be further downside for equities, with the S&P 500 to earnings ratio at
27.9x still extremely high, only surpassed over the past twenty-five years during the
global financial and health crises (Figure 6). The index’s price to book ratio is at an
even more lofty 4.83x, near its highest levels in well over two decades.
Often an equity drop like the one this week can arise because of tightening financials
conditions, which can partly be driven by continued high interest rates. However,
even with the rise in rates, the US financial conditions index has trended down off its
most recent late-2022 peak, indicating looser money, as it includes many factors
beyond just central bank base rates. While the initial easing was set in motion in early
2023 by the liquidity injected after the US and European banking crisis, a range of
factors has seen relatively abundant credit persist. That the mini-crash occurred even
with a supportive financial backdrop is concerning, as it raises the question of what
the markets would look like if conditions did tighten substantially.
Another question is just how much underlying economic damage may have already
been done by high rates, given the long lags in the effects of monetary policy, with
the hikes of last year having negative effects only seen in 2025. The hints of trouble
shown by the Q2/24 tech earnings is in keeping with mounting evidence of a fraying
at the fringes of the global economy, even while aggregates like global GDP still
continue to hold up. At this point, even if the Fed were to step in with gradual cuts, it
may turn out to be a case of too little, too late.
There is further risk in the recent drop in equities through the ‘wealth effect’, where
households feel richer as assets prices rise, and boost consumption. However, this
can go into reverse as asset prices fall, causing a wider contagion beyond just equity
markets. Adding to this the precarious geopolitical situation, including a deterioration
in the U.S. over just the past month, we see enough risk to spark a further flight to
safety, including into gold. This could continue the metal’s bull run far past the
average 2024 forecast of the investment banks of around US$2,300/oz, and the
institutions and rating agencies close to US$2,070/oz.
Gold stocks hold up under equity pressure
We have often warned that rising gold does not necessarily mean that gold stocks
will see gains, as other factors can offset the rise in the metal. These can include sell-
offs so severe that markets unload their stronger assets that have made gains to
cover losses in other investments that were undertaken through leverage or
borrowing. With gold stocks having had quite a strong year so far, they would be
potential candidates for such a sell-off in the equity decline of the past week.
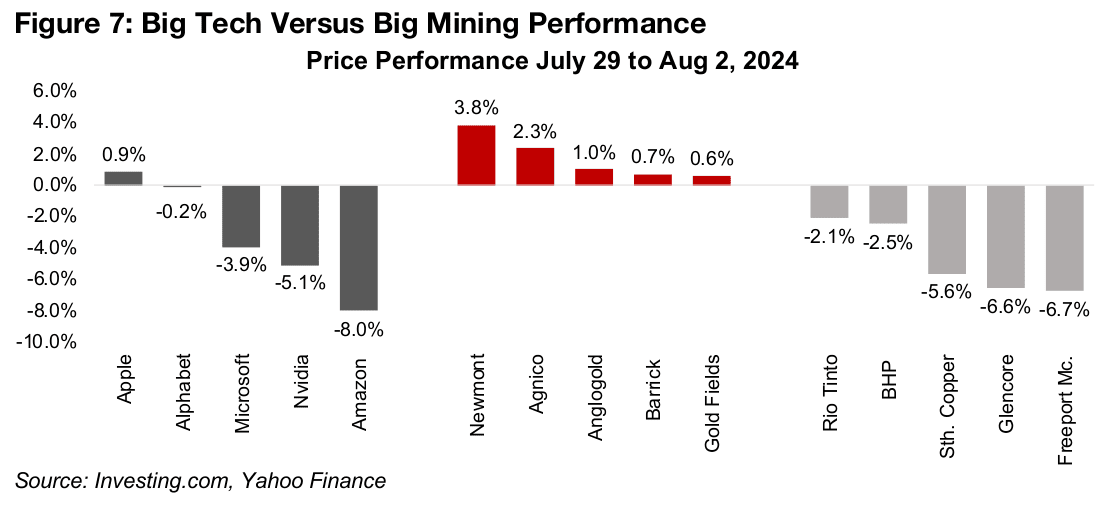
However, the largest cap gold stocks held up well under pressure, with Newmont,
Agnico Eagle, Anglogold, Barrick and Gold Fields all showing solid gains (Figure 7).
The sector was supported by a strong gold price, robust operational performances
and low valuations. In contrast, Big Tech slumped, with only Apple making gains,
Alphabet near flat and Microsoft, Nvidia and Amazon all down significantly, showing
the risk of their elevated valuations. The junior gold stocks, using the proxy of the
GDXJ ETF, declined as the collapse in small caps offset the rise in the metal.
However, low valuations alone were not enough to keep prices afloat, as shown by
the largest mining companies, which trade at moderate multiples versus their history,
and certainly nowhere near the elevated levels of tech. Rio Tinto, BHP, Southern
Copper, Glencore and Freeport McMoran all dropped, with limited support from
strong gold given that they are mainly leveraged to iron and copper prices.
Unwinding the Japan carry trade
Another potential driver for the gold price has been the unwinding of the Japanese carry trade, which can pull down the US$, which tends to move inversely with the metal. The reversal of this trade was a main cause of the hard hit to Japanese markets this week.
This carry trade occurs when markets borrow in Yen at the low rates that have
persisted in the country and exchange this for currencies with higher yields, including
the US$. They make the spread between the yields of the two currencies, and
eventually exchange the capital back to Yen to repay the original borrowings. Two
things can potentially go against this trade. The first is that either rates in Japan rise,
increasing the cost of borrowing, or rates in the other country decline. The second is
that the Yen rises against the other currency, making paying off the Yen borrowings
more expensive. For most of the past two years, neither of these issues have been a
problem, with US rates rising much faster than Japan, and the Yen remaining weak.
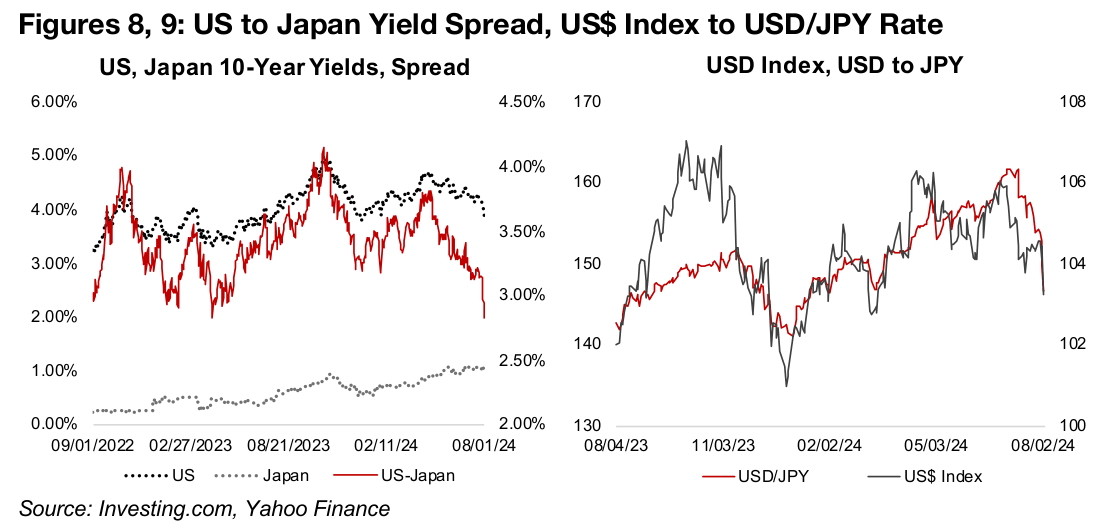
However, both these trends have reversed in recent months. Yields in Japan have
gradually risen, and were boosted by a recent rate hike by the Bank of Japan, while
the yield in the US declined, contracting the spread (Figure 8). The rising rates have
also boosted the Yen, while the US$ Index has declined, further exacerbating the
problem (Figure 9). Japan’s stock market has a large proportion of its market cap in
companies making a significant proportion of their earnings abroad. A stronger Yen
can make these exports more expensive in foreign markets, driving down both
expectations for their demand and therefore the profits for these companies.
Uranium stocks take major hit on Russian supply boost
The uranium price ended the week flat, after earlier gains, on the announcement of a major potential rise in the supply of the metal. This increased fears that a downtrend in the uranium price could continue, with it peaking in January 2024 at US$106.3/lb, and having declined -22% to US$82.6/lb (Figure 10). However, this reversal comes after a more than tripling in the price from just US$30.0/lb at the start of 2021 and quadrupling from lows of US$18.6/lb in late 2016, driven by increased global political support for nuclear power as part of the green energy transition.
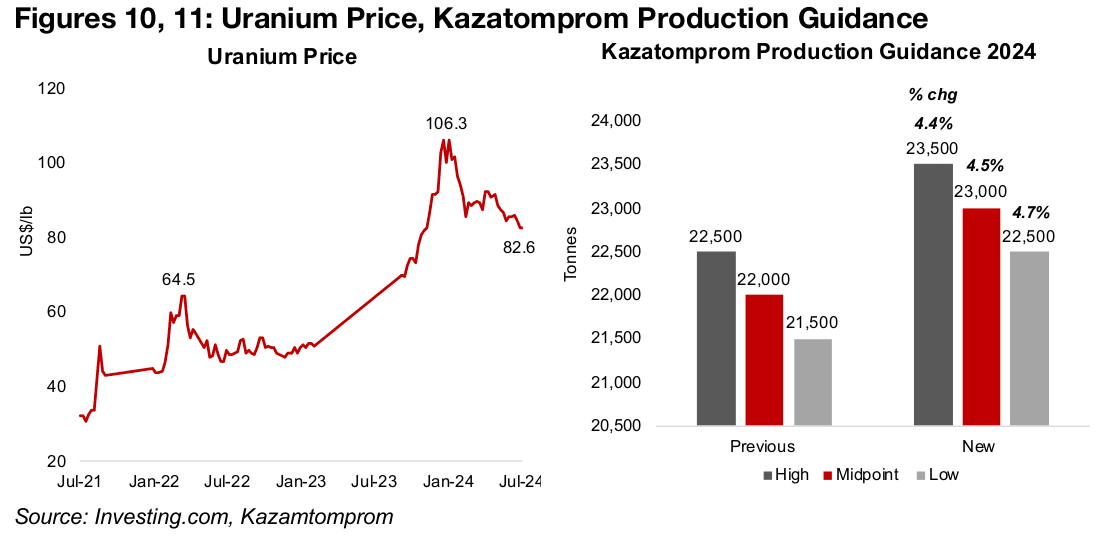
Kazakhstan’s uranium giant Kazatomprom upgraded production guidance for 2024 over 4.0%, from 21.5k-22.5k to 22.5k-23.5k tonnes (Figure 11). The company and country have an outsized effect on the industry, being by far its largest player, with output of 21.2k tonnes in 2022, accounting for over 43% of the global total (Figure 12). The next largest producer is Cameco in Canada at just 7.3k tonnes, or 15% of the total. This is an 8.9% increase in production year on year for Kazatomprom, which is high compared to an average of 0.2% from 2013 to 2022, with the only year higher during the period in 2021 in the post-global health crisis recovery.
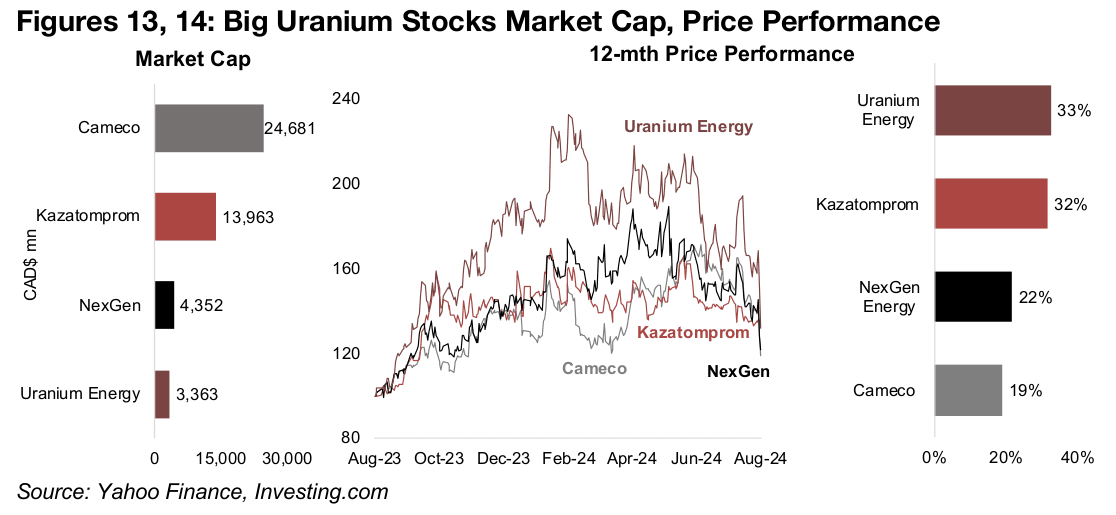
While the share price of Kazatomprom itself was flat for the week, the prices of the other major Big Uranium stocks, Cameco, NexGen and Uranium Energy declined by -16%, -15% and -18%, respectively. However, the stocks are still up substantially for the year, ranging from 19% to 33%, and the group generally trended up through to April-May 2024, even with uranium weakness, before pulling back since June 2024.
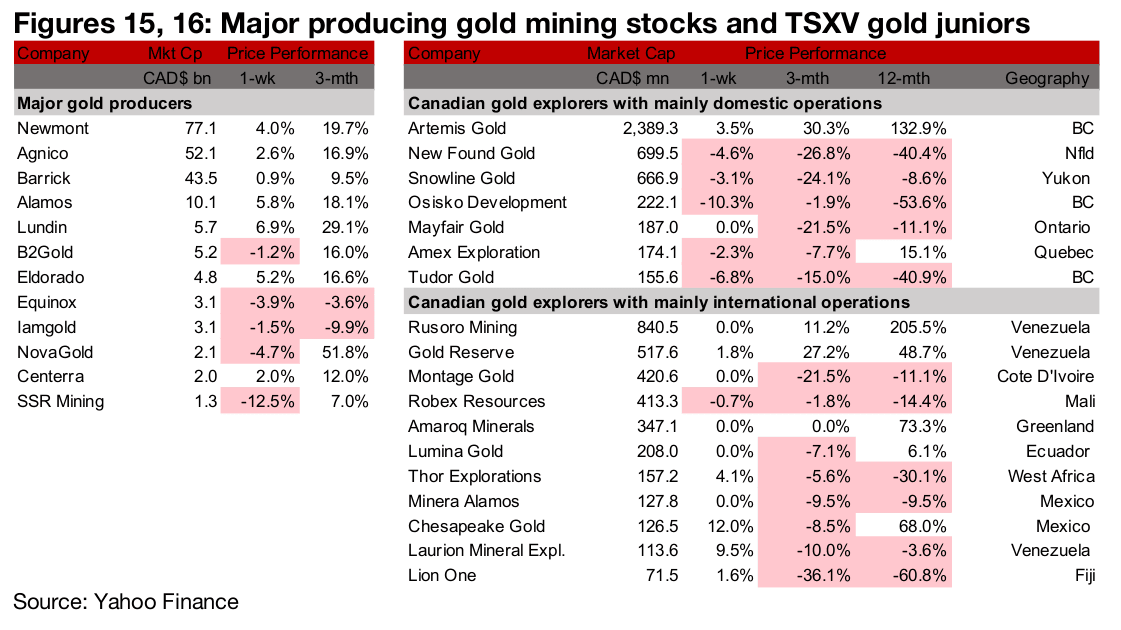
Large gold producers and TSXV large gold mixed
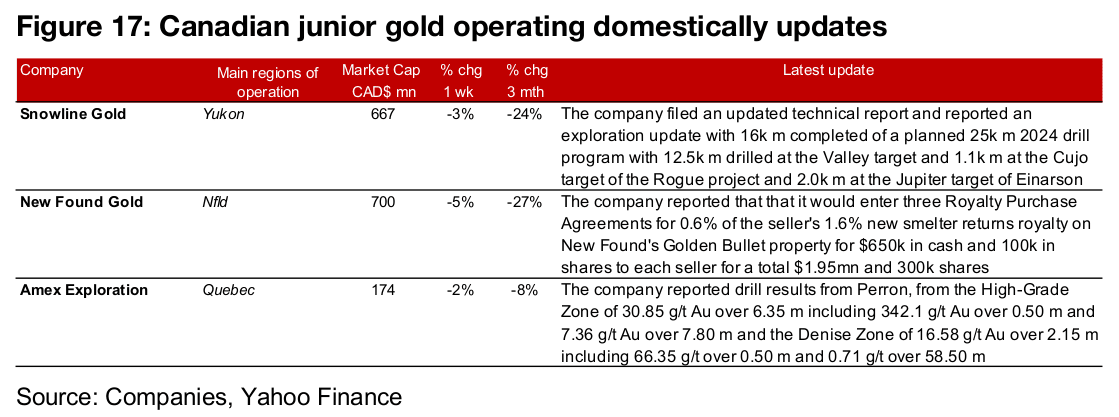
The large gold producers and the TSXV large gold were mixed as the gold price rose but equities slumped (Figures 15, 16). For the TSXV gold companies operating domestically, Snowline Gold filed an updated technical report and provided an exploration update for two projects, New Found Gold entered three Royalty Purchase Agreements for its Golden Bullet project and Amex Exploration announced drill results from the Perron project (Figure 17). For the TSXV gold companies operating internationally, there were no major news releases.
Disclaimer: This report is for informational use only and should not be used an alternative to the financial and legal advice of a qualified professional in business planning and investment. We do not represent that forecasts in this report will lead to a specific outcome or result, and are not liable in the event of any business action taken in whole or in part as a result of the contents of this report.