
February 12, 2021
Gold bounced 2.0% this week to US$1,825/oz, up from a two-month low of US$1,794/oz reached last week, which was only the second time since July 2020 gold dipped below US$1,800/oz, with the other period in November 2020 also brief.
It seems that the market is just not accepting a gold fair value below US$1,800/oz, which in our view is mainly because of the massive monetary printing ongoing for all eight of the most traded currencies in the world, which we detail this week.
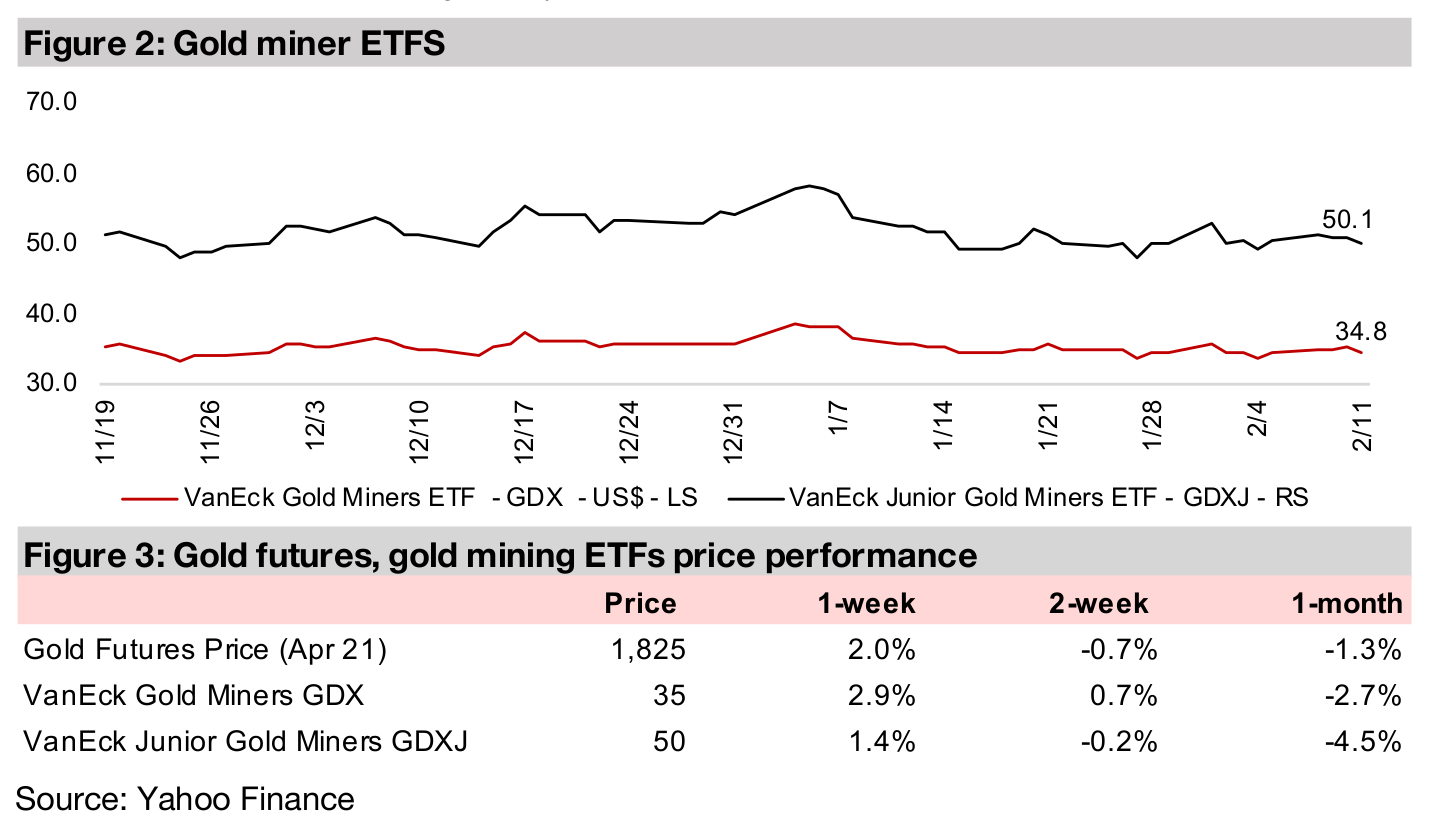
While the GDX rose 2.9% and the GDXJ 1.4%, the performance of the producing gold miners and Canadian junior gold was mixed. Great Bear Resources (GBR.V), which is advancing the pre-initial resource Dixie project at Red Lake, is In Focus.


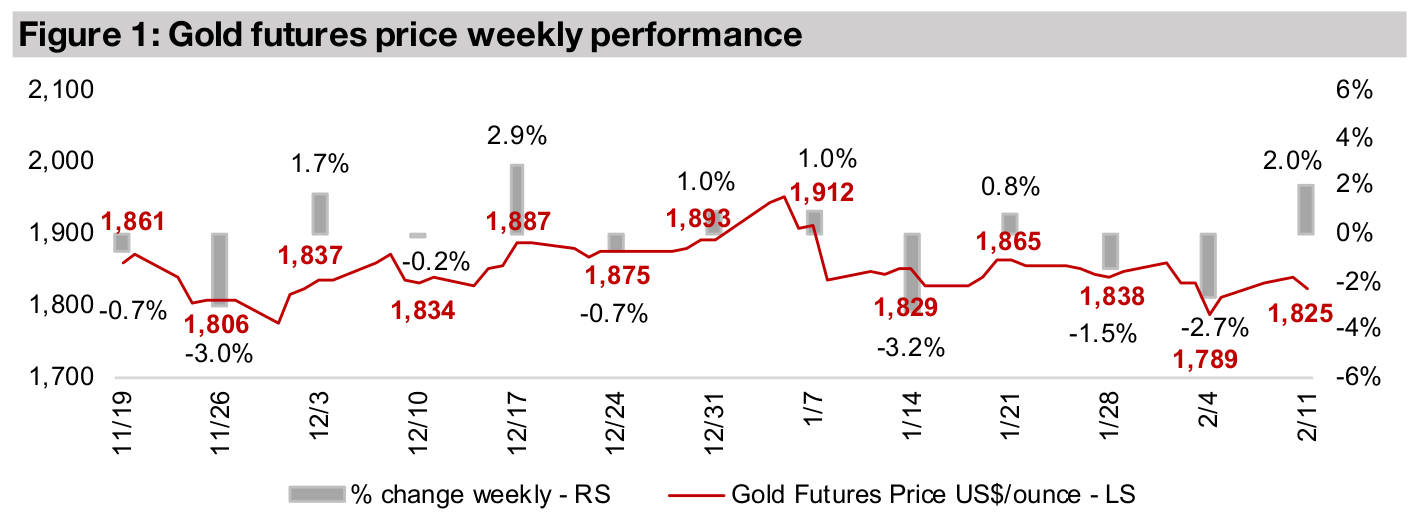
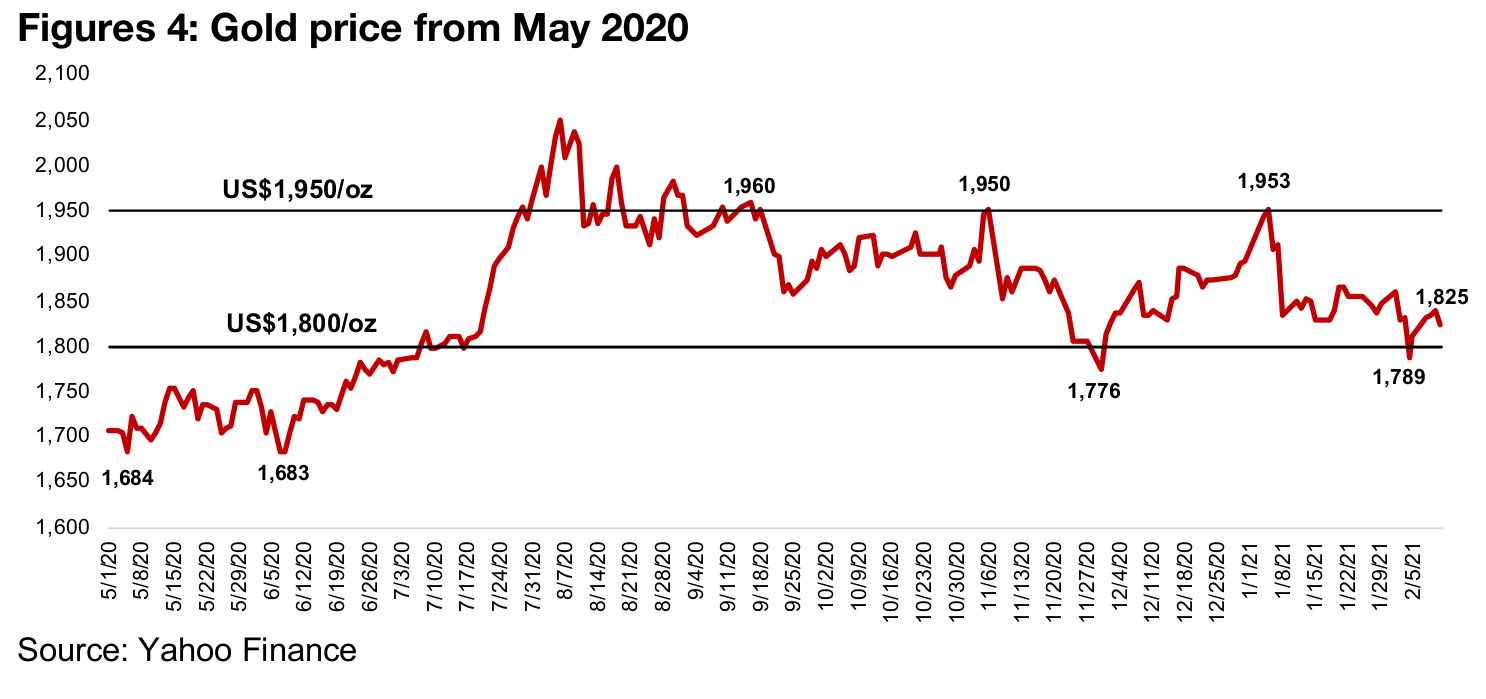
Gold had a solid bounce, up 2.0% to US$1,825/oz this week, off two-month lows of US$1,794/oz last week. While there were some immediate drivers like a fall in the US$, in general we believe that the market is just not seeing gold as being fairly valued at levels below US$1,800/oz. This is the second time that gold has flirted with levels below US$1,800/oz over the past six-months before rebounding strongly, with gold touching US$1,776/oz at the end of November 2020, only to recover back as high as US$1,953/oz by early January 2021. While we can focus on various short-term drivers in a given week, in our view the core underlying fundamental driver that continues to hold up gold is the rampant money printing, especially by the US Federal Reserve, but also by the Central Banks backing all of the world's top traded currencies.
As the value of fiat, or paper money (which is actually mostly just electronic now) issued by government is greatly increased, but the global supply of gold sees only marginal expansion, we would expect that, all else equal, that the price of gold would rise versus all these currencies. However, even though a huge ramp up in global money printing began in H2/20, we really haven't seen gold move out of a trading range from around US$1,800/oz to US$1,950/oz. Now, it could be argued that this is because gold already gained 42% since 2019, and that a lot of money printing was already baked into the price. However, we would suggest that gold's rise in 2019 was in no way incorporating the completely unexpected monetary tsunami unleashed since H2/20. And yet gold has been trending down since its July 2020, just as the money printing was starting to surge. The monetary statistics simply do not support a weak gold price, and we believe that the market knows this, and even the most bearish realize that anything below US$1,800/oz is potentially a bargain.
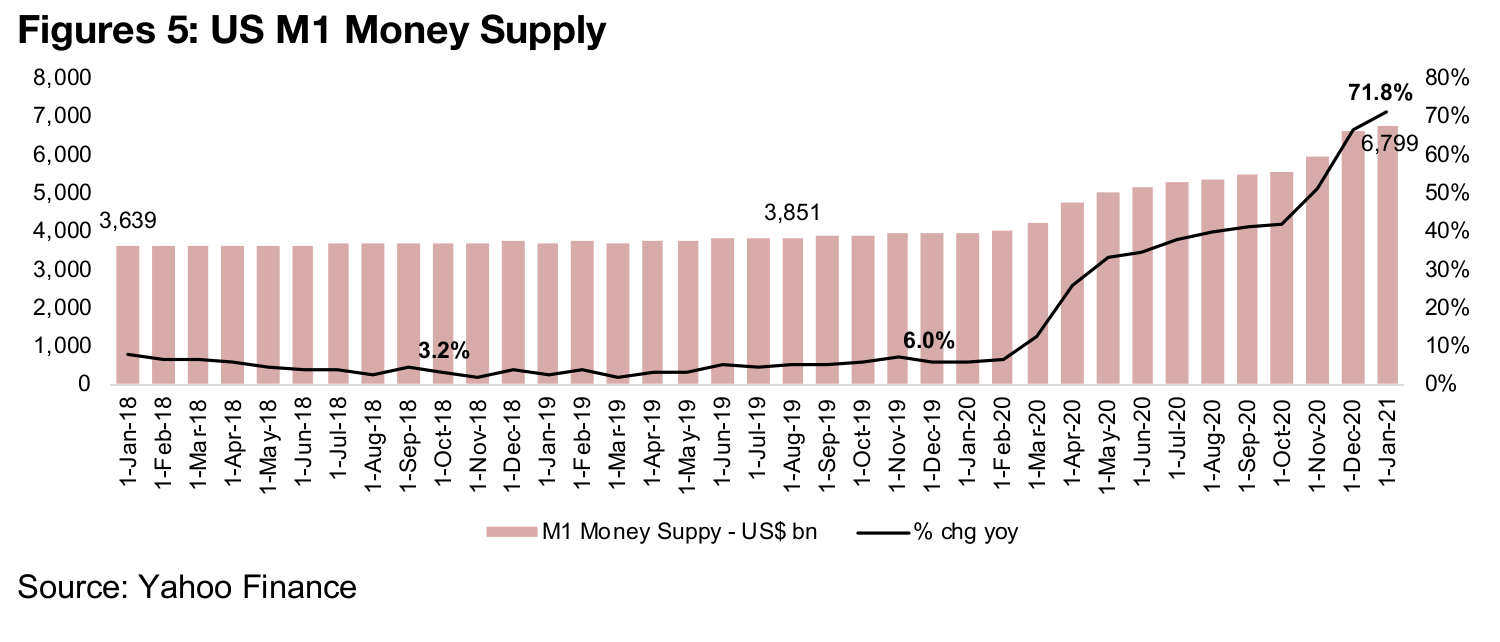
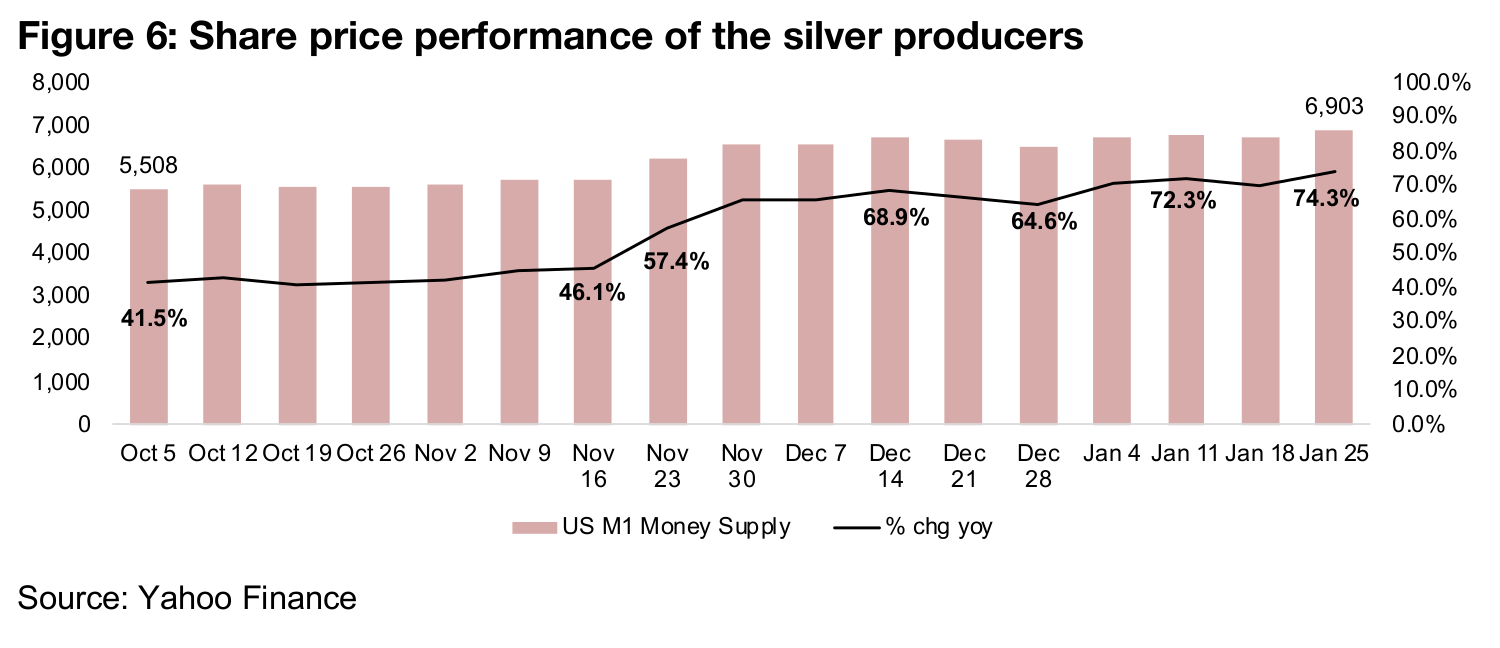
The leader in monetary expansion continues to be the US, who has seen its monthly M1 money supply growth surge from moderate levels averaging below 5.0% yoy from 2018 to 2019 to a massive 71.8% growth in January 2021, the highest level in modern history, and far higher than the 2008-2009 financial crisis (Figure 5). The US data is also released on a weekly basis, so we have data up until only a few weeks ago, with the most recent January 25, 2021 figures showing the pace of growth only continuing to rise, reaching 74.8% (Figure 6). While the current definition of inflation is based on consumer prices, and a rise in the CPI Index, older definitions cite money supply growth as inflation. Using this older definition, the US money supply growth looks eerily hyperinflationary, and even as recently as October and November 2020, growth was 'only' low to mid-40%, although this was already historically very extreme.
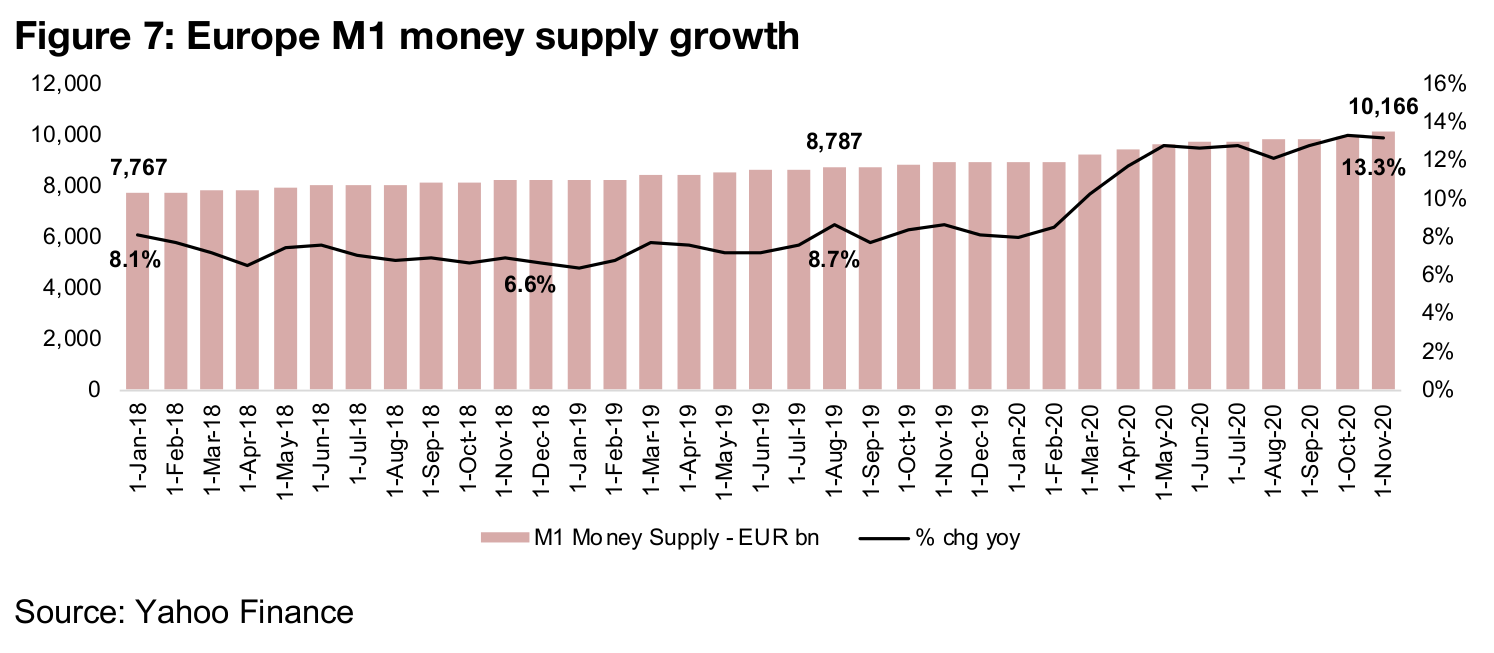
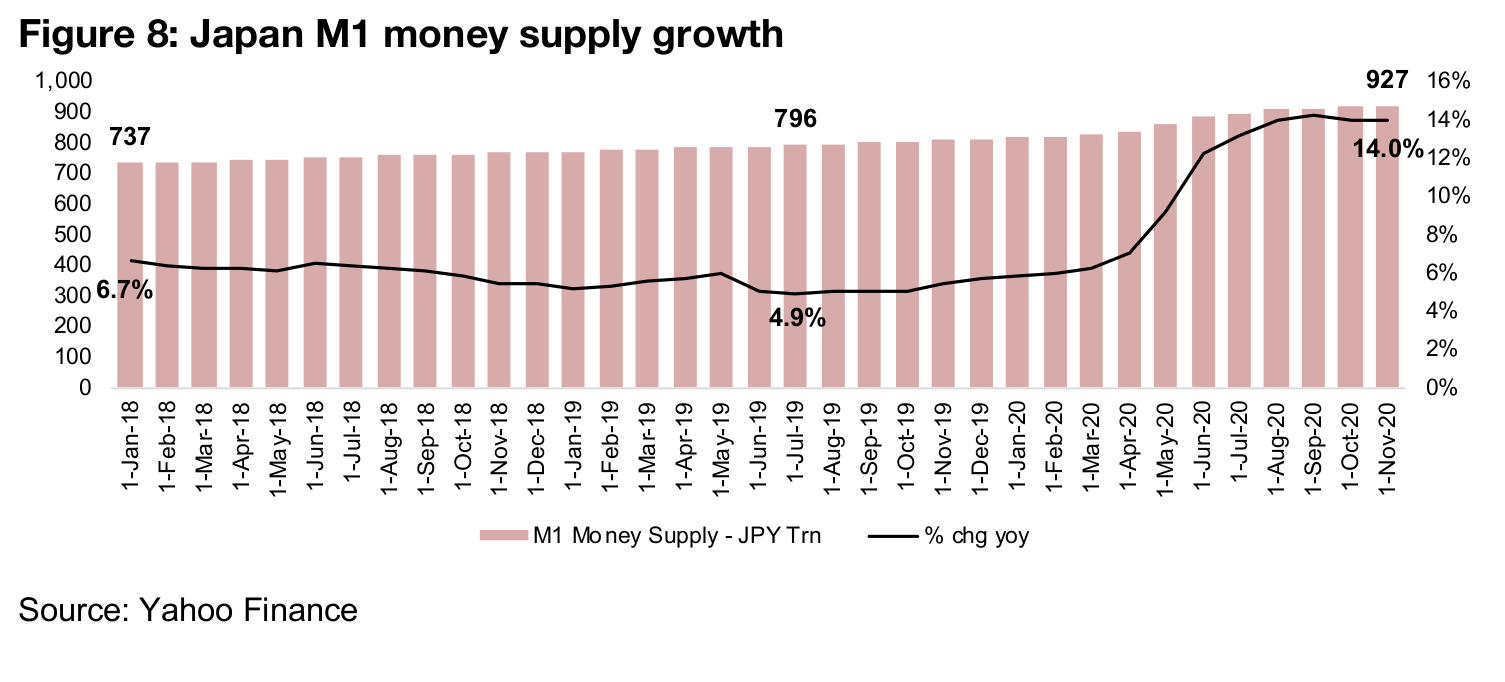
The M1 growth in Europe has risen from an average of 7.4% over 2018-2019 to 13.3%, and in Japan has risen from an average 5.8% over 2018-2019 to 14.0%, as of the mostly recently released November 2020 data (Figure 7, 8). While this looks benign compared to US M1 growth, the M1 growth rates have nearly doubled for Europe and more than doubled for Japan. They don't look that excessive in the context of the US monetary mania, but these levels are high historically. It remains to be seen whether the EU and Japan will be following suit, and the data is three months behind the US, so this may have already started. Also, they may eventually be forced into expanding their money supplies more quickly, especially with so many major global assets priced in US$, to keep their export prices competitive and import prices from becoming too high. However, for now, Europe and Japan's M1 growth rates seem to have stabilized, and not tipped over into what looks a bit 'out of control.'
While the US$, Euro and Yen are the three largest widely traded global currencies,
accounting for the majority of the action in currency markets, there are also five other
second tier currencies that are widely traded, and comprise a large proportion of the
global currency market. These are the Canadian dollar, the UK Pound, the Australian
dollar, the Swiss France and New Zealand dollar. The money supply for all of these
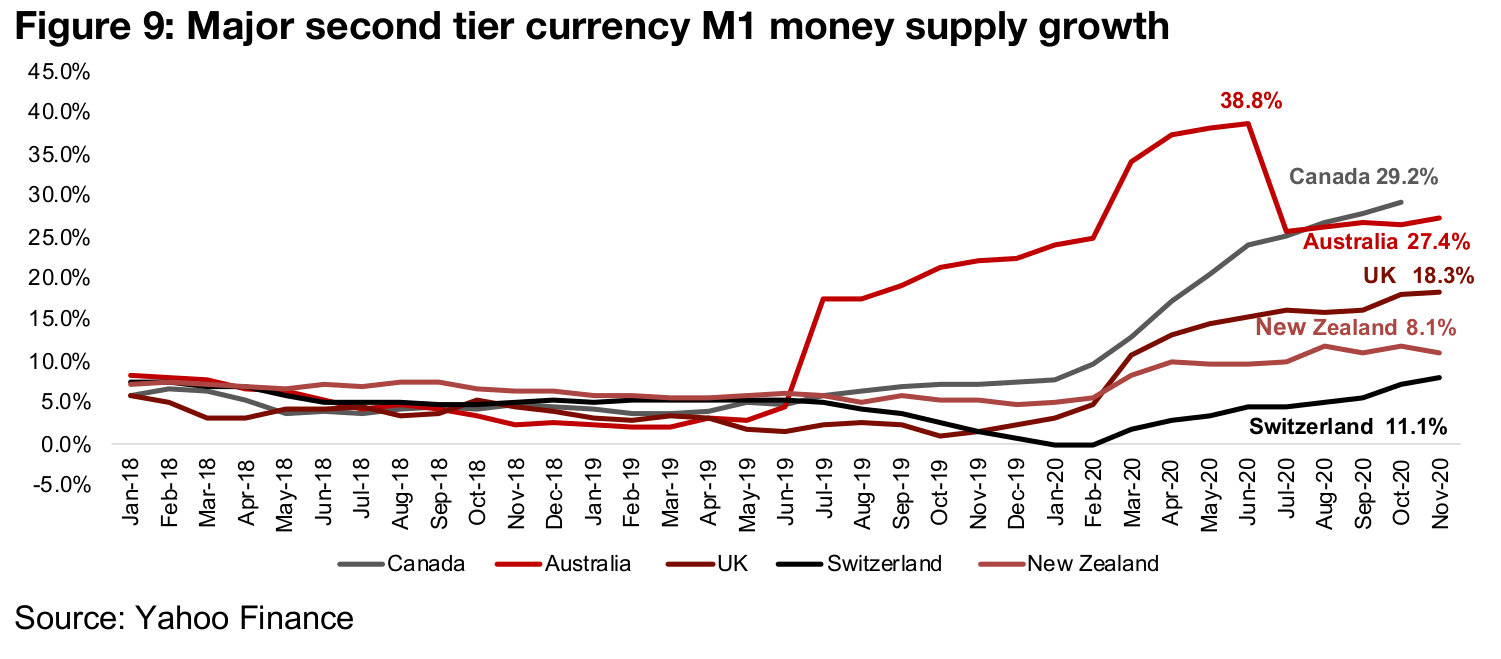
countries have seen a similar ramp up to the big three currencies in H2/20 (Figure 9).
Australia stands out as its M1 growth had already been rising rapidly from mid-2019
and shot up in the early-2020 crisis, peaking at 38.8% in June 2020, and then
declined to a still high 27.4% as of the most recent November 2020 data.
Of this group, Canada has the highest monetary growth as of the most recent data
to October 2020, where it was expanding at 29.2%, nearly six times the 5.2% average
from 2018-2019. The UK M1 growth reached 18.3% in November 2020, also up over
five times from an average 3.3% from 2018-2019 and New Zealand is at 11.1%,
double the average 5.0% from 2018-2019. Switzerland could be considered the most
conservative of the group, with M1 growth at 8.1% in October, after averaging 5.0%
from 2018-2019, although the M1 had actually been contracting a marginal -0.12%
on average in January and February 2020 just prior to the March 2020 crisis.
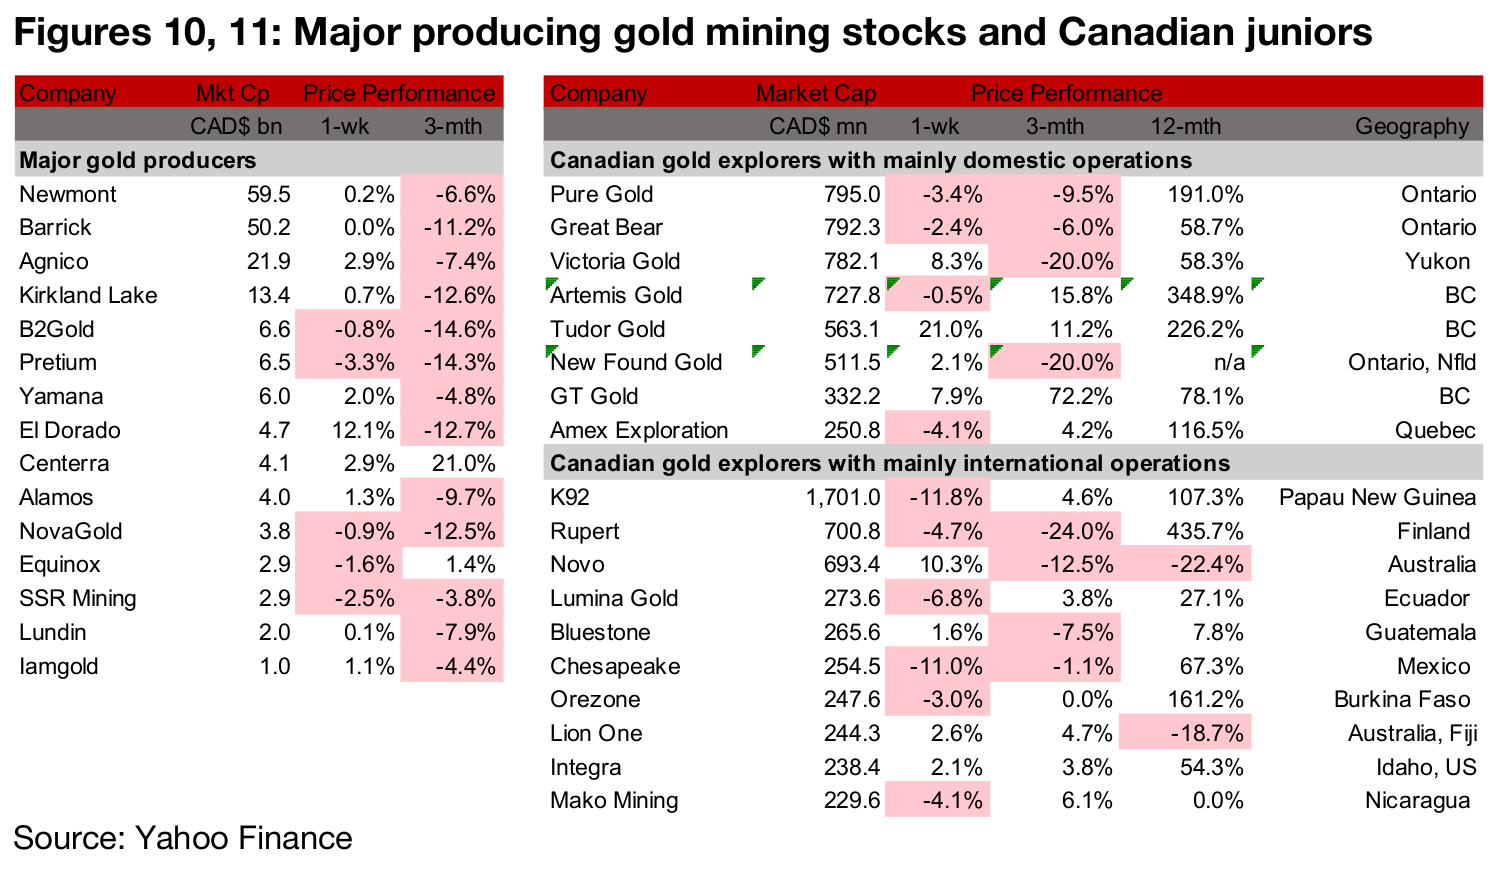
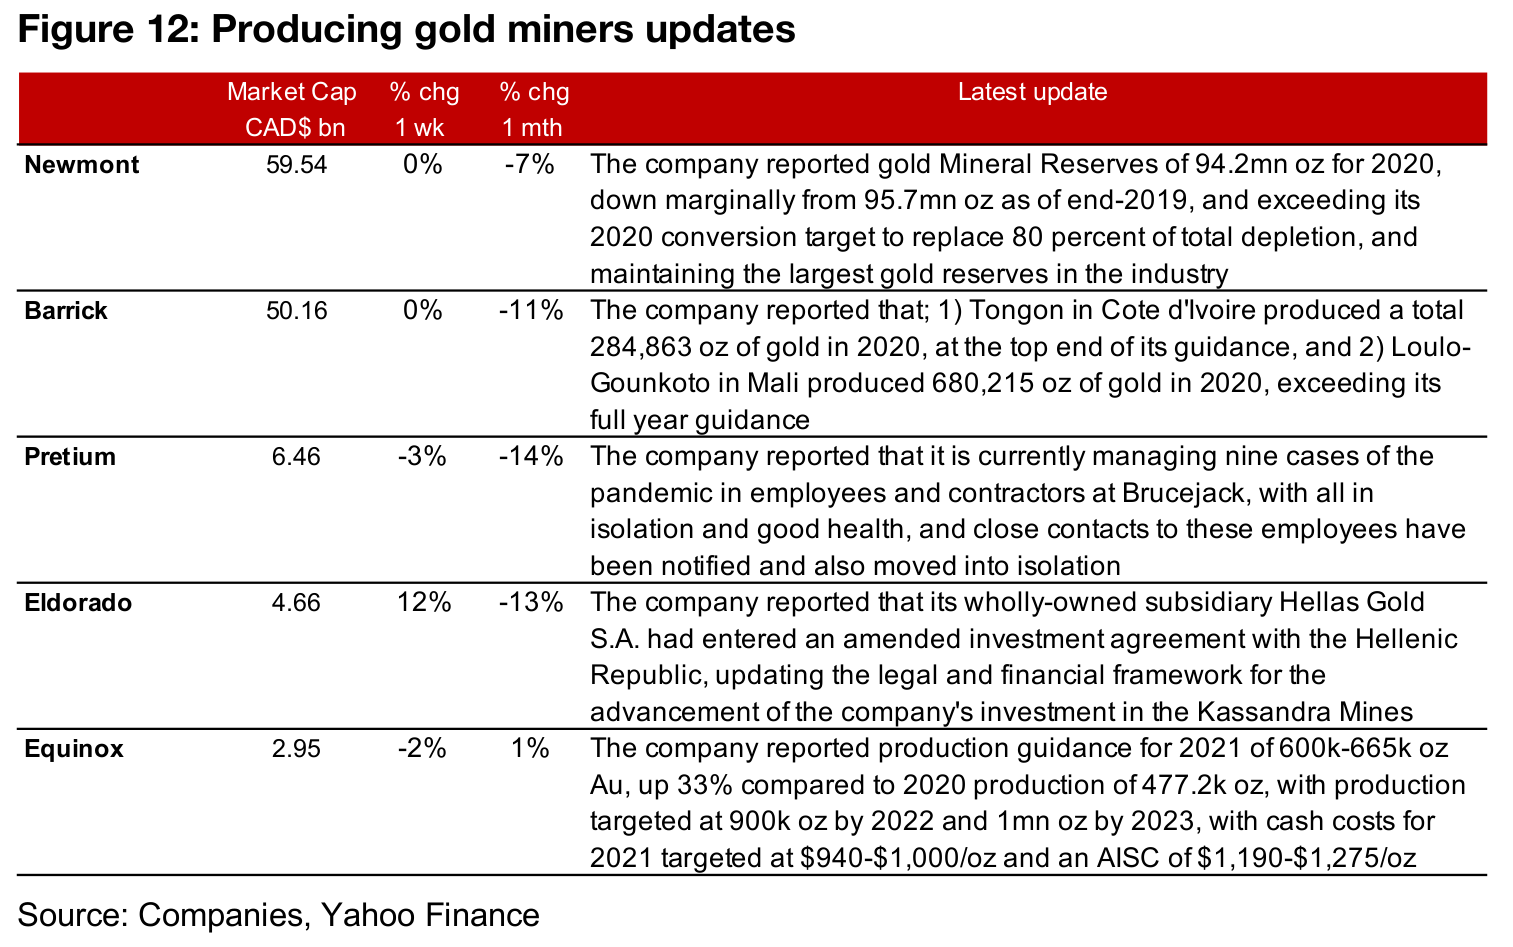
The producing miners were mixed even as gold picked up, and news flow limited as the companies ramp up for the results season which is about to begin (Figure 10). (Figure 12). Newmont reported its Mineral Reserves of 94.2m for 2020, with over 80% of total Reserves depletion replaced for the year, Barrick provided an update on its Tongon mine in Cote d'Ivoire and Loulo-Gounkoto in Mali, and Pretium reported on the management of some pandemic cases at Brucejack. Eldorado reported an amended investment agreement on its holding in Kassandra Mines and Equinox reported its production guidance for 2021.
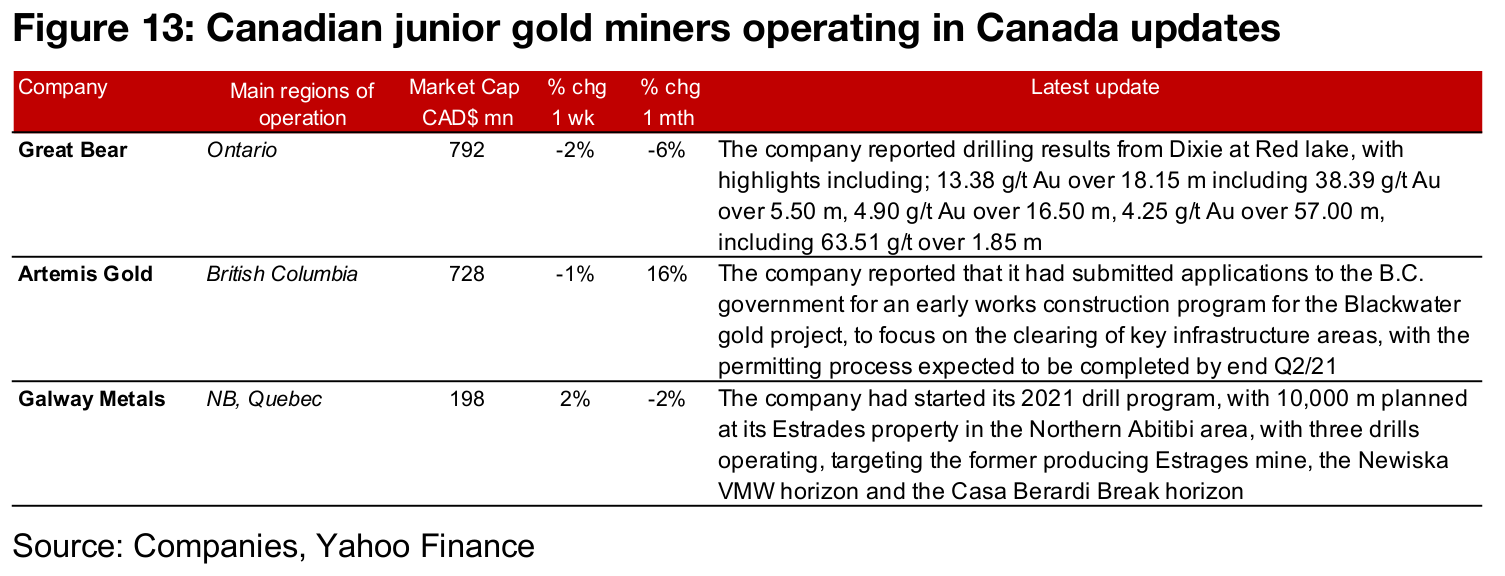
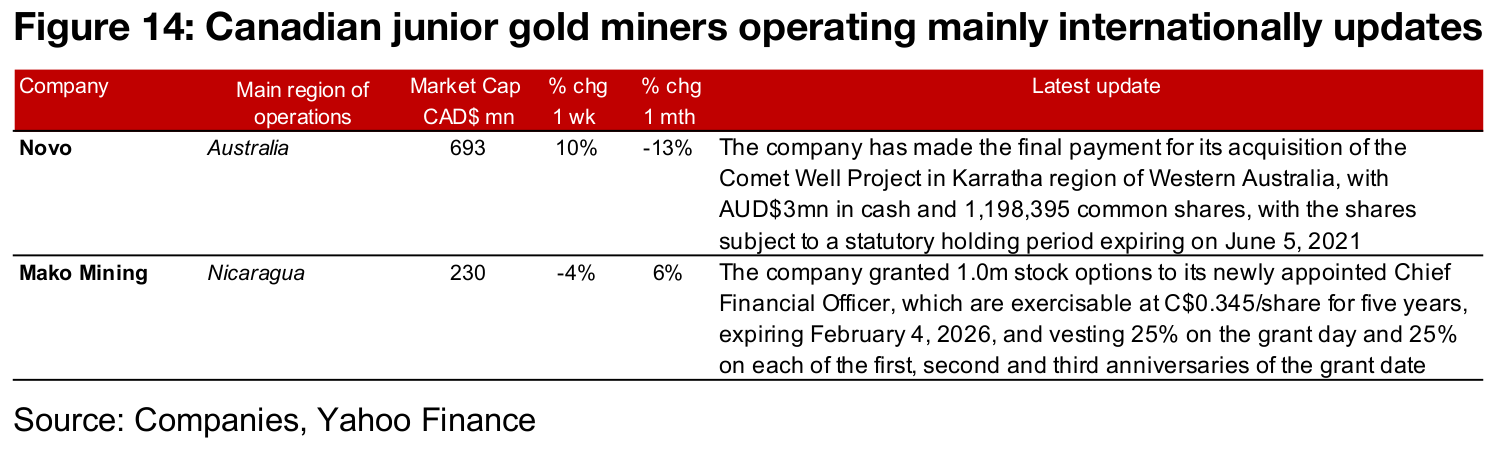
The Canadian junior miners were mixed this week (Figure 11). For the Canadian juniors operating mainly domestically, Great Bear reported drilling results from the Dixie project at Red Lake, Ontario, Artemis submitted applications to the B.C. government for an early works construction program for the Blackwater gold project and Galway Metals started its planned 10,000 m drilling program at its Estrades property in the Northern Abitibi region (Figure 13). For the Canadian juniors operating largely internationally, Novo made the final payment for its acquisition of the Comet Well project in the Karratha region of Western Australia, and Mako announced that it had granted stock options to its newly appointed Chief Financial Officer (Figure 14).
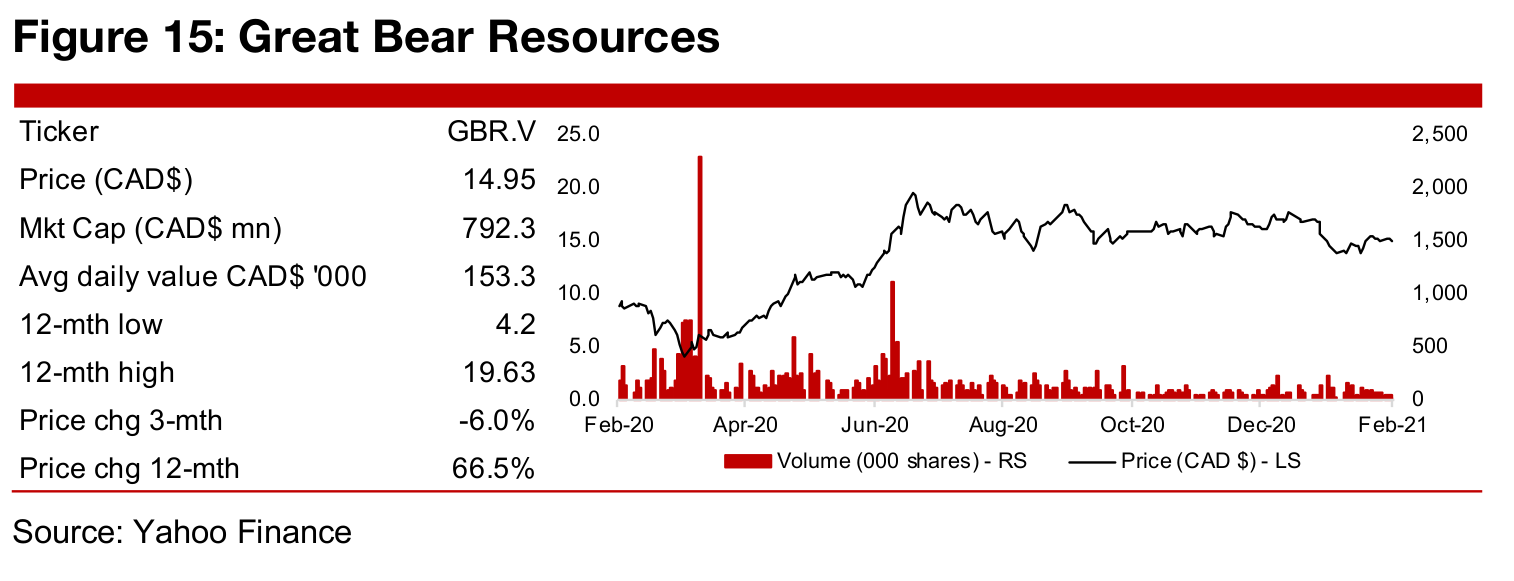
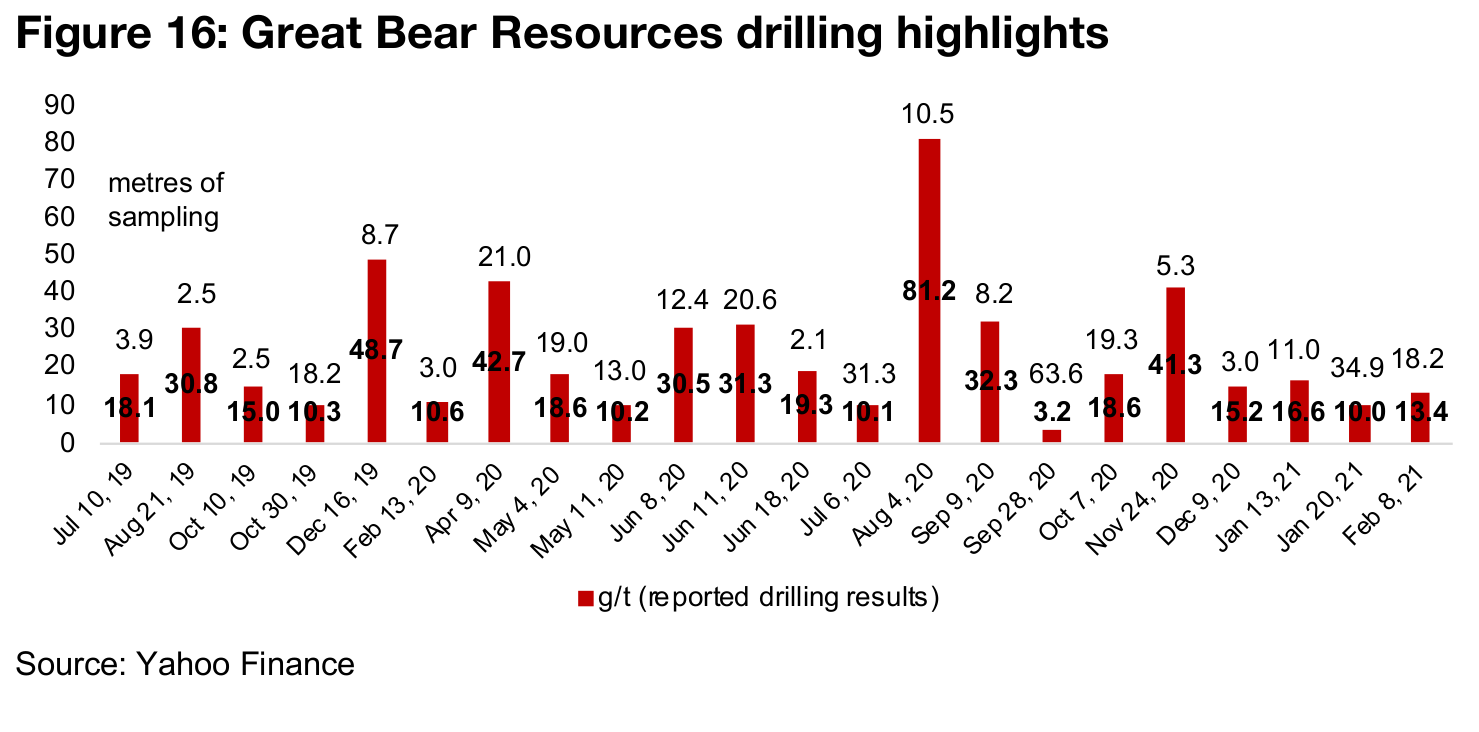
Great Bear Resources reported drilling highlights from its ongoing exploration of its Dixie project in Red Lake, Ontario, with 13.4 g/t Au over 18.2 m reported on February 8, 2021, around the average of the grade of the highlighted results from the last four drilling-related press releases, which ranged from 10.0 g/t to 16.6 g/t (Figure 16). The company's most outstanding results over the past year were 81.2 g/t Au from a press release on August 4, 2020, and 42.7 g/t Au over 21.0m reported on April 9, 2020, and 41.3 g/t Au over 5.3 m reported on November 24, 2020. The company has a 110,000 m, $25mn drilling program planned for 2021, which is more than fully funded, given its bought deal private placement for $70mn that closed in January 2021. The company has highlighted the potential for continuity across the project, and has continued to hold off on releasing its initial resource estimate, as it views it as too soon to do so, given the potential for the current drilling program to expand the resource estimate materially.
Great Bear's share price saw some especially strong gains over H1/20 as it issued a
series of strong drilling results for Dixie and the evidence of increasing continuity was
coming through. The share price was also supported by rising gold price, which likely
improved the market's confidence that the company would be able to achieve
financing. Even as of May 2020, Great Bear's price was outpacing its Red Lake
competitor Pure Gold Mining, even though Pure Gold was a much more advanced
stage, with a PEA already completed. Over H2/20, however, Great Bear's share price
stagnated, as Pure Gold headed for its first gold pour, achieved right at the end of
2020, and is currently up 135.3% from the beginning of January 2020 compared to a
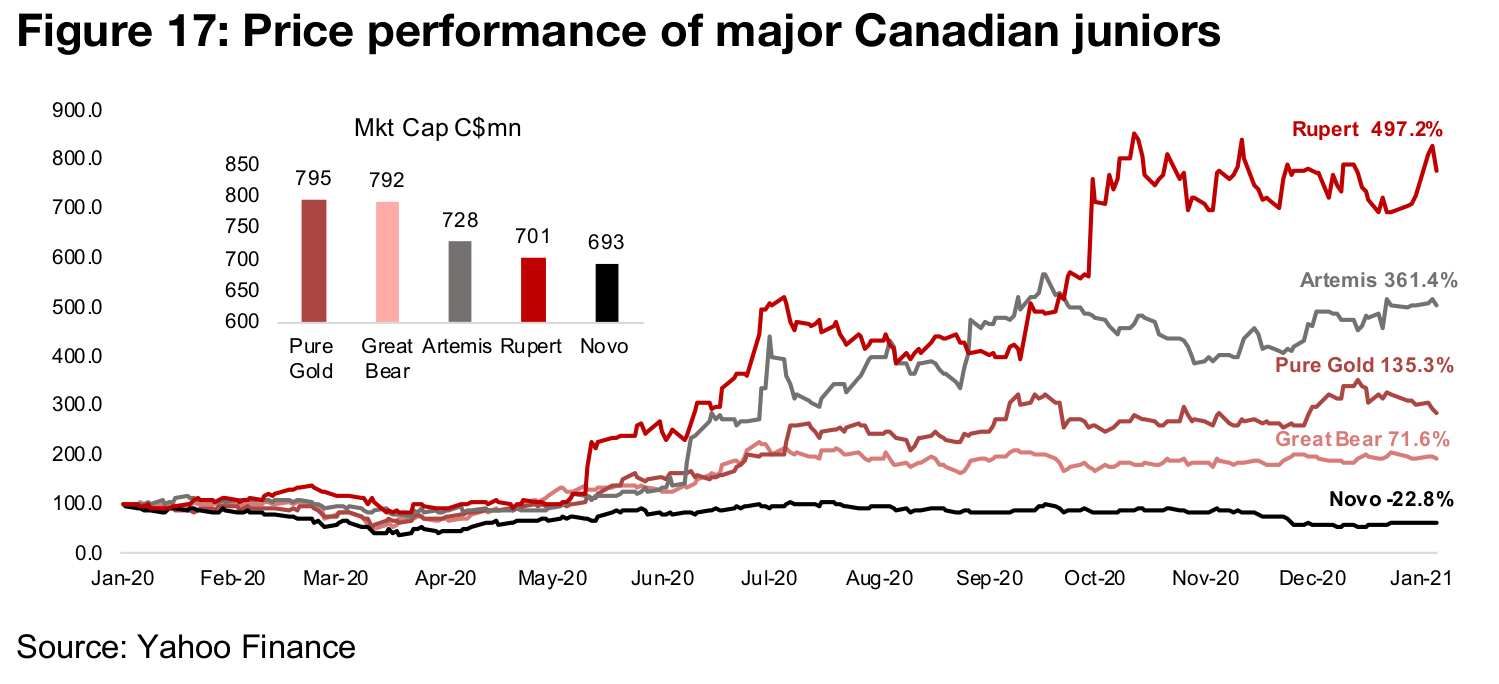
71.6% rise for Great Bear (Figure 17).
While in absolute terms Great Bear has still had a great year, it has lagged some of
the other major Canadian junior miners. Rupert Resources, which, like Great Bear,
has not released an initial resource estimate, has surged 497.2% since January 2020,
especially on very strong drilling results from the new Ikkari area of its Pahtavaara
project in Finland. Artemis, operator of the Blackwater project in British Columbia has
gained 361.4%, although the project is already at the PEA stage. The laggard of the
big five Canadian juniors is Novo Resources, which owns the Beaton's Creek project,
for which an initial mineral resource has been released, and is down -22.8%
Disclaimer: This report is for informational use only and should not be used an alternative to the financial and legal advice of a qualified professional in business planning and investment. We do not represent that forecasts in this report will lead to a specific outcome or result, and are not liable in the event of any business action taken in whole or in part as a result of the contents of this report.
Author
Ben McGregor authors the Weekly Roundup at CanadianMiningReport.com, providing sharp analysis of the metals and mining sector. With a talent for spotting trends, Ben distills complex market shifts into clear, engaging insights on TSXV junior miners. His weekly updates cover gold, copper, uranium, and more, blending data-driven perspectives with a knack for identifying opportunities. A vital resource for investors, Ben’s work navigates the dynamic junior mining landscape with precision.