August 26, 2024
Fed On the Verge
Author - Ben McGregor
Gold up on dovish Fed comments, US employment revisions
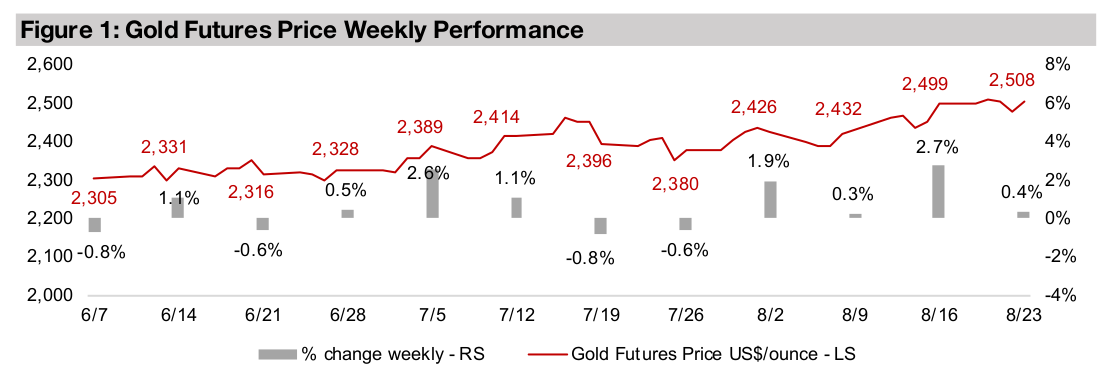
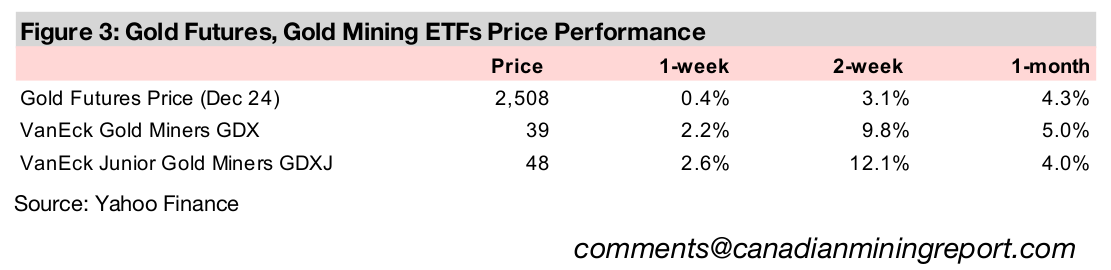
The gold price rose 0.4% to US$2,508/oz, spending almost a week above US$2,500/oz for the first time ever, driven by Fed comments and a severe downgrade to US employment numbers viewed as dovish for monetary policy by markets.
Gold’s monetary drivers strong but ratios versus commodities high
Monetary drivers appear supportive of a continued rise for gold, and while ratios for the metal versus several key commodities look somewhat high, this does have some fundamental justification and does not appear to be simply market overexuberance.
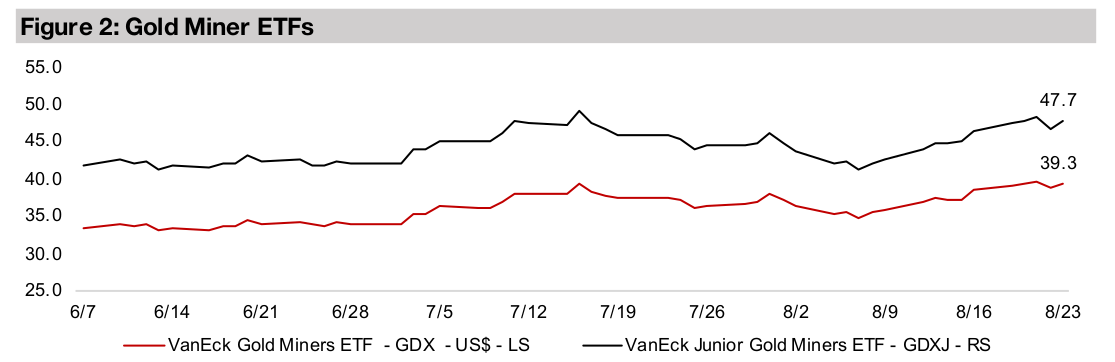
Gold stocks gain on metal rise and continued equities rebound
Gold stocks rose as equities markets continued to recover, with the 2.2% rise in the GDX outpacing the 1.4% gain in the S&P 500, and while the GDXJ was even stronger, up 2.6%, it still came in below the 3.5% jump in the small cap Russell 2000 index.


Fed on the Verge
Gold rose 0.4% to US$2,508/oz and stayed above the key US$2,500/oz level for most
of an entire week for the first time ever, having previously only briefly made it over
this hurdle twice since July 2024. This was driven by dovish comments by the US
Fed Chairman and a major downward revision to US employment figures, indicating
the jobs situations was not as strong as previously believed. The rise in the producing
gold stocks, with the GDX up 2.2, outpaced the 1.4% gain in the S&P 500 and 1.3%
increase in the Nasdaq, suggesting the market is still leaning towards safety. However,
this was contradicted to a degree by a strong move into small caps, with the Russell
2000 jumping 3.5%, outpacing the 2.6% gain in the GDXJ ETF of gold juniors.
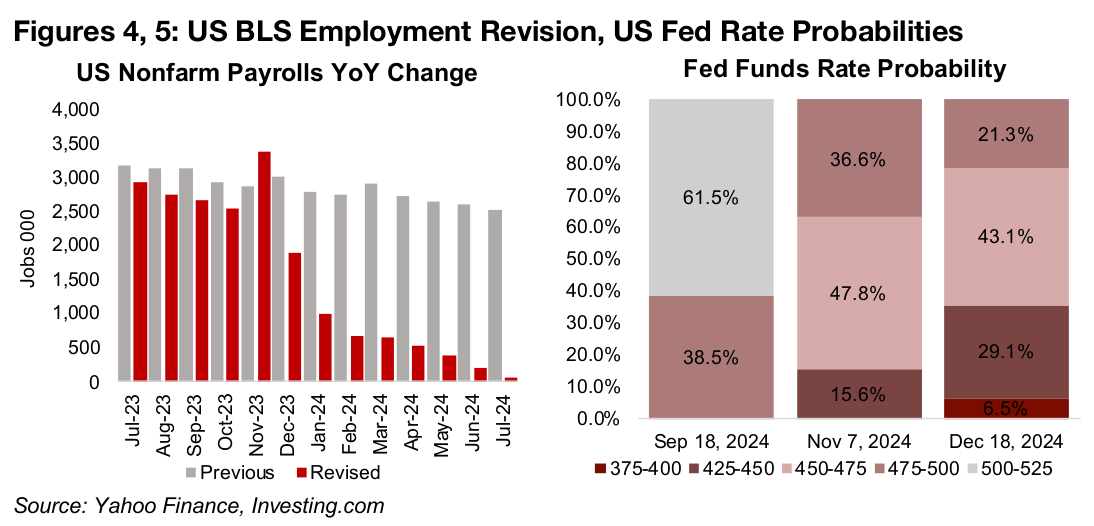
The US Bureau of Labor Statistics (BLS) shocked the market with an extreme
downward revision of the new jobs added in 2024. Figure 4 shows an only moderate
downward revision to the absolute year on year change in jobs over H2/23, with the
new November 2023 number actually above the previous figure. However, a major
gap starts from December 2023 with the revised estimates far lower than the earlier
reported data, and by mid-2024 the previous jobs growth around 2.5 mn has dropped
to near zero. However, the markets appear to have returned to a ‘bad news is good
news’ stance once again, viewing the weaker than previously expected US
employment situation as more fuel for potential rate cuts.
These dovish expectations were further supported by the US Fed Chairman’s
comments this week that the time had arrived for policy to adjust. While expectations
for a rate cut at the September 18, 2024, meeting are still just 38.5%, with a 61.5%
probability that the Fed maintains rates, the market sees a 100% probability of at
least a 25 bps cut at the November 7, 2024, meeting, and a near 50% chance of a 50
bps cut (Figure 5).
Major monetary drivers still supporting gold
With gold finally decisively holding the US$2,500/oz level for the first time in its history,
and with the metal gaining about US$200/oz in just two months, it will be again raising
the question of whether the rally has gone too far, too fast. Therefore, this we look at
the metal’s major drivers and its ratio to some major comparable commodities to
check for indications that markets are getting too exuberant over the metal. Overall,
it appears that the core monetary drivers for the metal still remain supportive, and
while the ratio of gold to some key commodities in the past few months has risen
considerably above recent averages, these moves are supported by fundamentals.
Real bonds yields are one key monetary driver for gold, calculated as nominal yields
minus inflation. Higher real yields drive a greater opportunity cost of holding the metal
and can compel markets to increase bond holdings relative to gold. Real bond yields
had turned heavily negative by mid-2022, boosting the case for moving into gold
(Figure 6). However, they became increasingly less negative through 2022, by mid-
2023 were above zero, and peaked at 1.6% in November 2023. Since then they have
remained relatively flat and therefore been a relatively neutral driver for the metal.
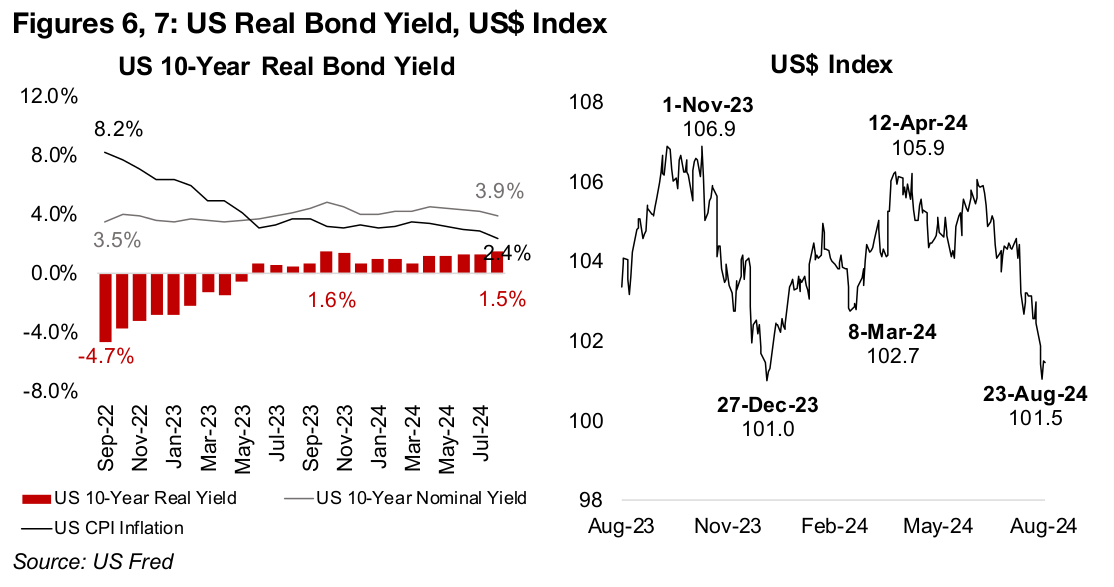
However, it now appears that there is a chance that real yields could again decline.
Global interest rates appear to have already peaked, with many major centrals banks
having already started to cut rates this year and the Fed also seemingly on the verge
of rate cuts. With inflation now flattening, with only about a percent more down before
hitting the US and EU’s targets both of 2.0%, this factor may also not be lowering
real yields as much. A major rebound in real yields would likely require substantial
central bank rate hikes and inflation hitting near zero, neither of which seems a high
probability.
Another major driver of the gold price is the US$, with two tending to move inversely
as the metal is priced the currency. The US$ Index plunged over the past two months
from a recent peak of 105.9 in April 2024 to just 101.5, near its lows of the past year
(Figure 7). The start of rate cuts by the Fed could cause a further decline, as lower
rates would make US yields relatively less attractive than those of other currencies.
However, this does depend on the Fed actually coming through with expected cuts
this year, and how rapid the cuts are versus other regions and countries. Overall the
probability could be weighted towards a weaker US$ driving a higher gold price in
the short-term, especially with the Fed’s indications that it will cut soon.
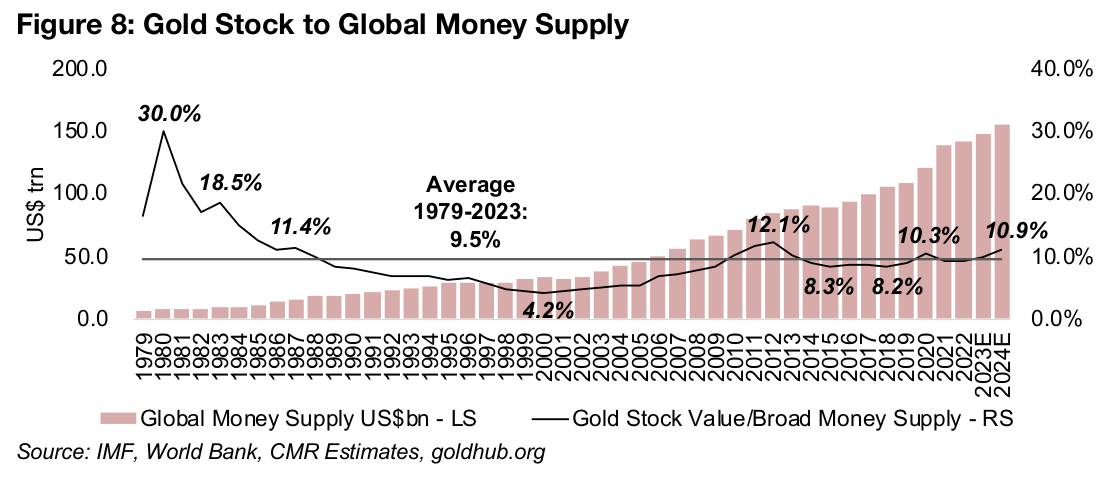
Longer-term a key monetary gold driver is its relationship to the money supply. Gold
is widely considered a major global currency at a macro level, even though it is not
used in transactions the micro level. Therefore we can look at the value of the
outstanding gold stock as a proportion of the total money supply as one gauge for
whether the metal is starting to look overvalued. The ratio of the global gold stock
value to the global money supply has been relatively stable since around 2009,
ranging from 8.2% to 12.1% (Figure 8). In this context the current 10.9% ratio could
be considered moderately high versus the short to medium-term range.
However, looking longer-term, the ratio reached as high as 30.0% in 1980, and was
above 15.0% for most of the 1980s, which gives a benchmark for an excessive ratio.
The long-term average since 1979 has been 9.5%, indicating that the current 10.9%
is still only moderately high. The ongoing global rate cuts also imply a rise in the global
money supply, and as these cuts gain pace and the US Fed joins in, the global money
supply could increase considerably over the next year. Combined with a growth in
the supply of gold likely to be under 2.0% and an average gold price near the current
level, the ratio could decline back towards the average. This would imply room for
the gold price to continuing rising next year without the ratio rising to levels that would
appear excessive versus its history.
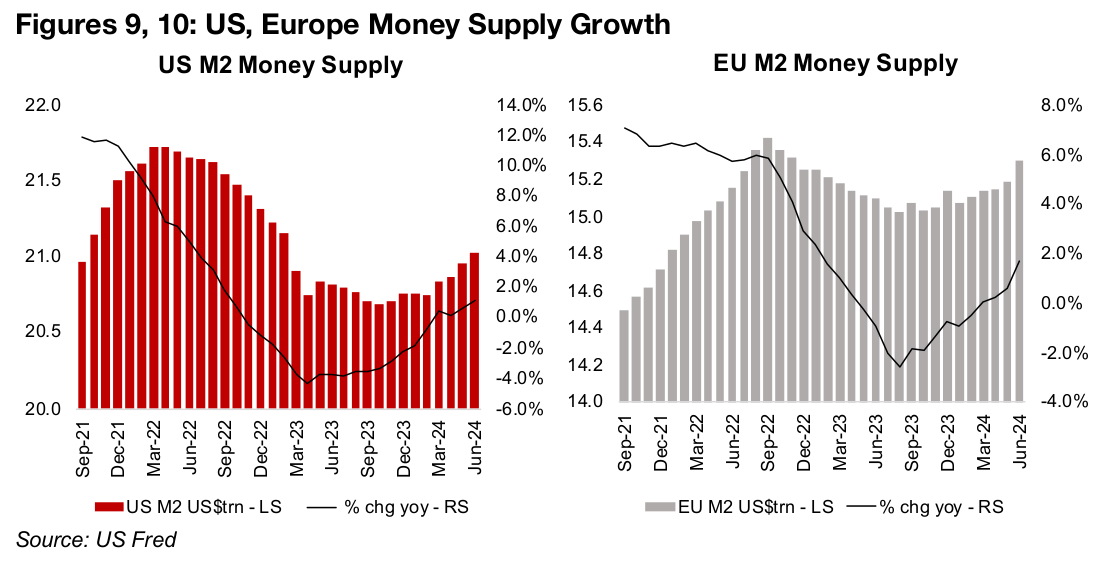
The M2 money supply has already just started to expand in two the regions with the
largest absolute currency bases, the US and Europe (Figures 9, 10). In the US growth
in M2 year on year turned negative in November 2022 and in the EU by May 2023,
with the contraction bottoming in April 2023 and August 2023 for the two, respectively.
However, the contraction for both has gradually eased since, with money supply
growth in the US and EU reaching above zero in April 2024, and the rise has continued
as of the most recently reported June 2024 data.
High gold to commodities ratios have some fundamental justification
While these major monetary drivers of gold look supportive of a continued rise in the
price, its ratios versus some key commodities have started to look somewhat
elevated at first glance. However, there is some fundamental justification for this
divergence of the ratio to above recent averages. In general, the moves show a split
in market expectations between monetary drivers, which are expected to be
expansionary, and industrial drivers, with the markets appearing to have some
concerns over a potential slowdown.
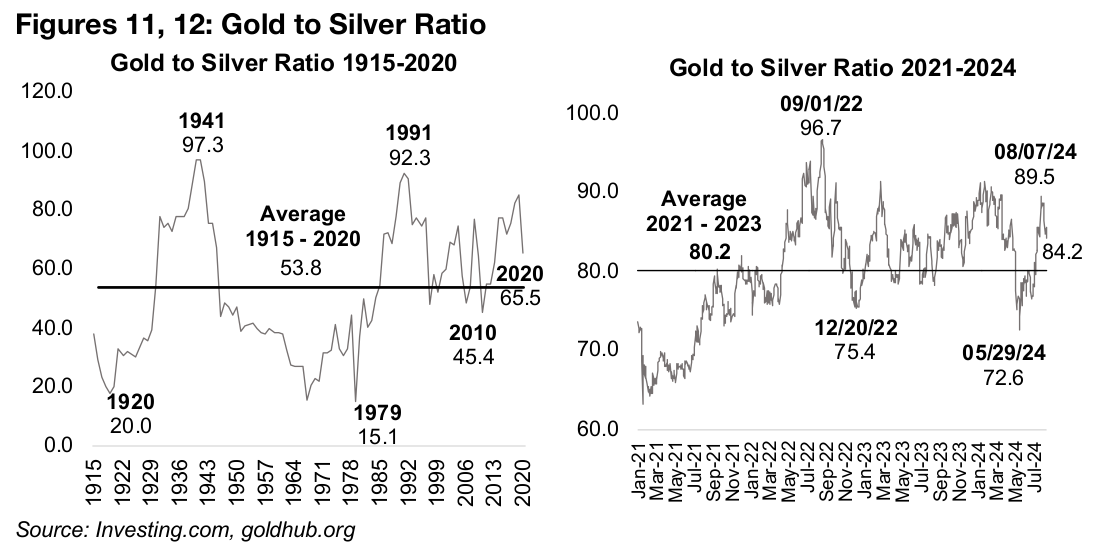
One key ratio for gold is versus its closest cousin silver, with both driven by monetary
factors, but with the latter also driven by industrial factors. On a short-term basis, this
ratio is only moderately high, at 84.2x versus on average since 2021 of 80.2, and still
well off its 89.5x high in early August 2024 (Figures 11, 12). There is some justification
for a relatively high gold price versus silver, given the rising probability of a continued
global monetary expansion, contrasting with a more bearish outlook for industrial
output. While increasing the money supply will eventually likely boost economic
growth, there can be a significant lag in it taking effect, and meanwhile the global
economy is still dealing with relatively high interest rates which could curb growth.
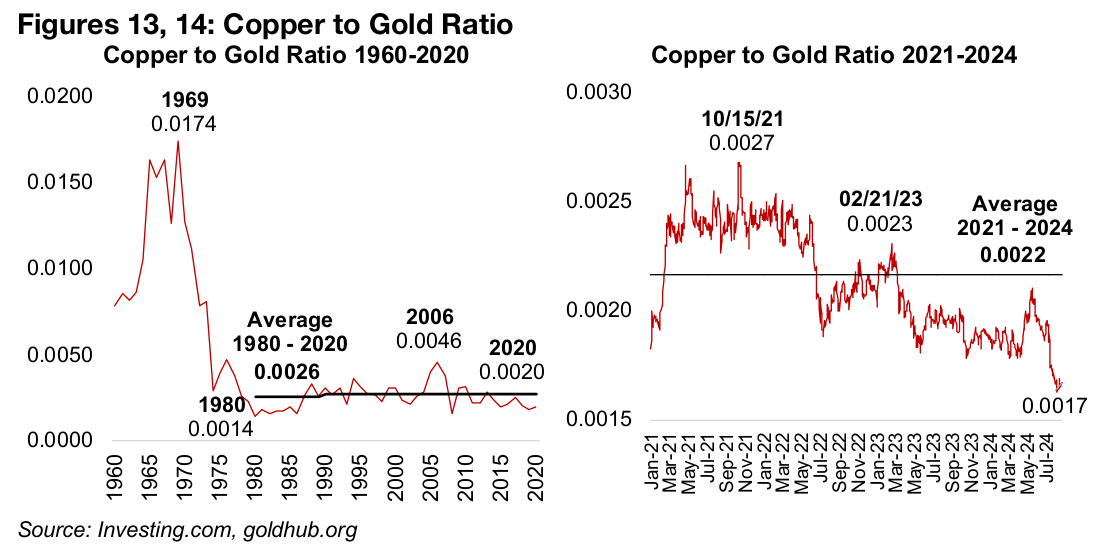
Gold’s ratio versus copper is also critical, with the latter almost entirely driven by industrial factors and probably the clearest representation of the split between market expectations for monetary versus real economic factors. Concern about a global economic downturn has seen the copper to gold ratio slump over the past month, to just 0.0017, well below the 0.0022 average since 2021 and 0.0026 long-term average from 1980 to 2020 (Figures 13, 14). While this ratio at first might appear too low, it could just accurately be portraying stagflationary expectations by markets. Medium- term, easier monetary policy could drive industrial growth, boosting the copper price and bringing the ratio back towards the average.
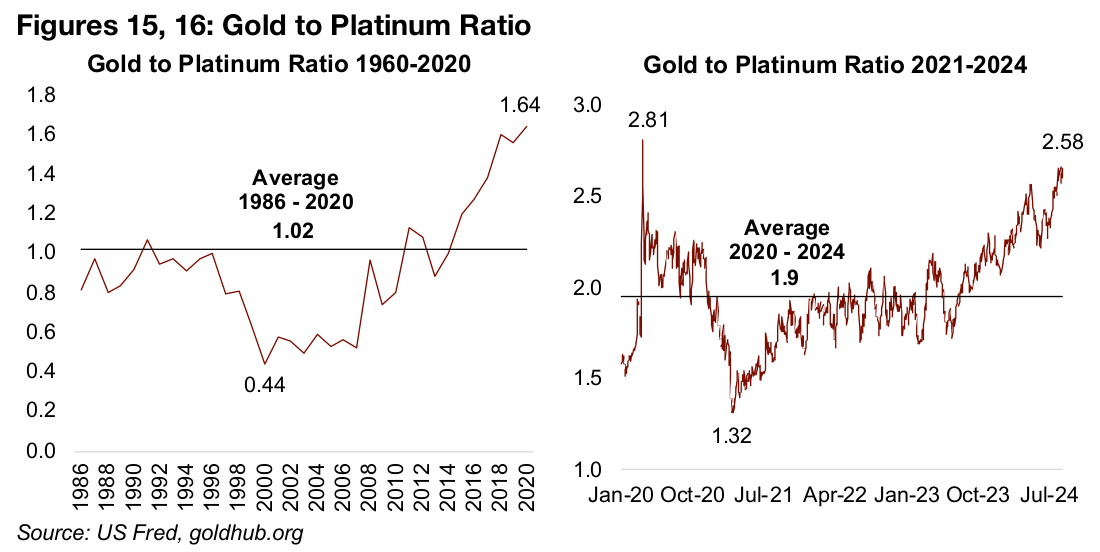
Platinum is similar to silver in that is it driven by both monetary and industrial factors, although the latter are probably more dominant than the former compared to silver. Platinum’s largest source of demand is for use in autocatalysts, and the auto industry has seen some weakness this year, leading to the metal’s price underperforming at the same time as gold has soared. While this has driven up the gold to platinum ratio to 2.58x, well above the average 1.9x since 2020 and 1.0x from 1986-2020, there is some fundamental justification for the move.
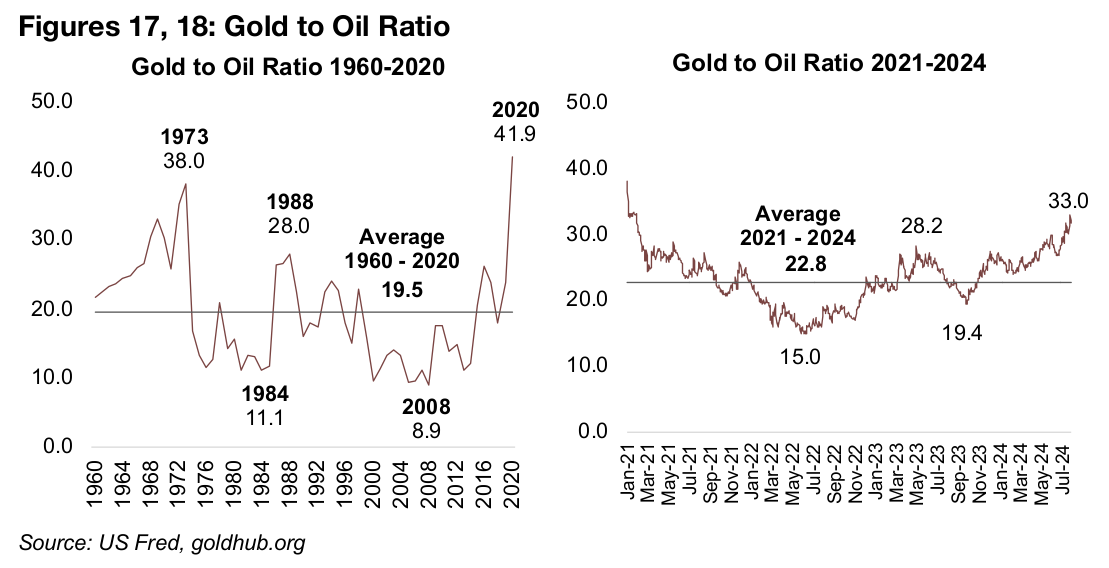
Another comparison for gold is with oil, which like the gold to copper ratio is another indicator of monetary versus industrial expectations. There is a similar signal there, with the ratio quite high at 33.0, versus its average of 22.8 since 2021, and well above the long-term average of 19.5x from 1960-2020 (Figures 17, 18). Versus commodities more broadly the gold to CRB Index ratio has jumped to 7.7, up from its average since 2021 of 6.5x (Figures 19, 20). However, this move has been very recent compared to the other ratios, with the gold to CRB ratio inline with medium-term averages for much of 2024.
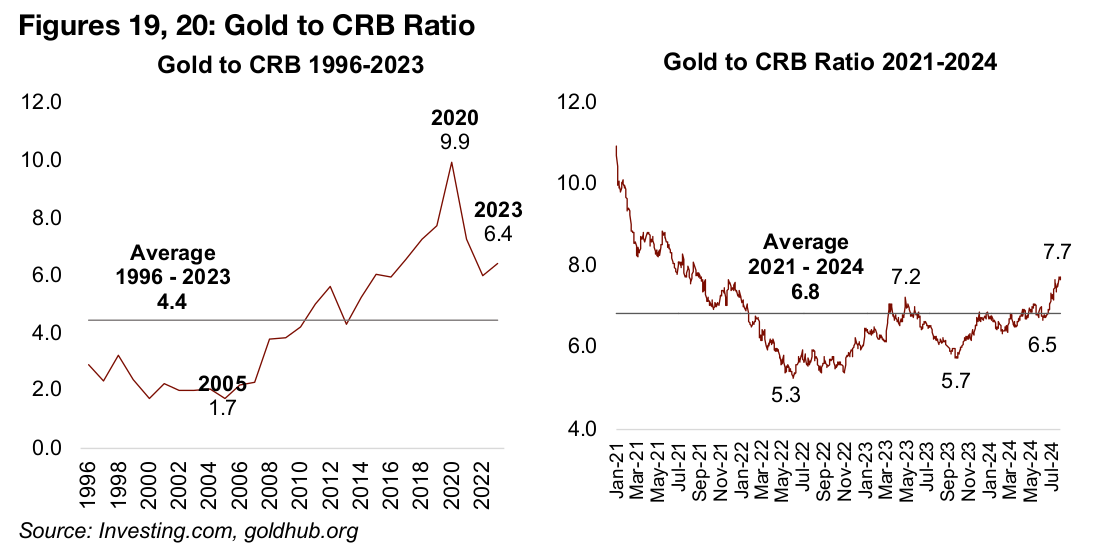
As for where these gold versus commodities ratios go from here, we can consider two main scenarios. The first would be that the global monetary easing boosts economic growth relatively quickly and this drives up the industrial metals and commodities but is not inflationary enough to drive up gold further. This could then bring these ratios back down closer to their averages. However, there could also be stagflation, where a monetary expansion drives up inflation but not does generate much growth, as occurred in the 1970s the early 1980s in many developed nations. The money printing alone in this scenario could drive up commodities even without a boost from real demand and also pull the gold to commodities ratios down. However, under this stagflationary scenario could also gold soar, as it did the in mid-1970s to early-1980s, leaving these ratios at high levels for an extended period.
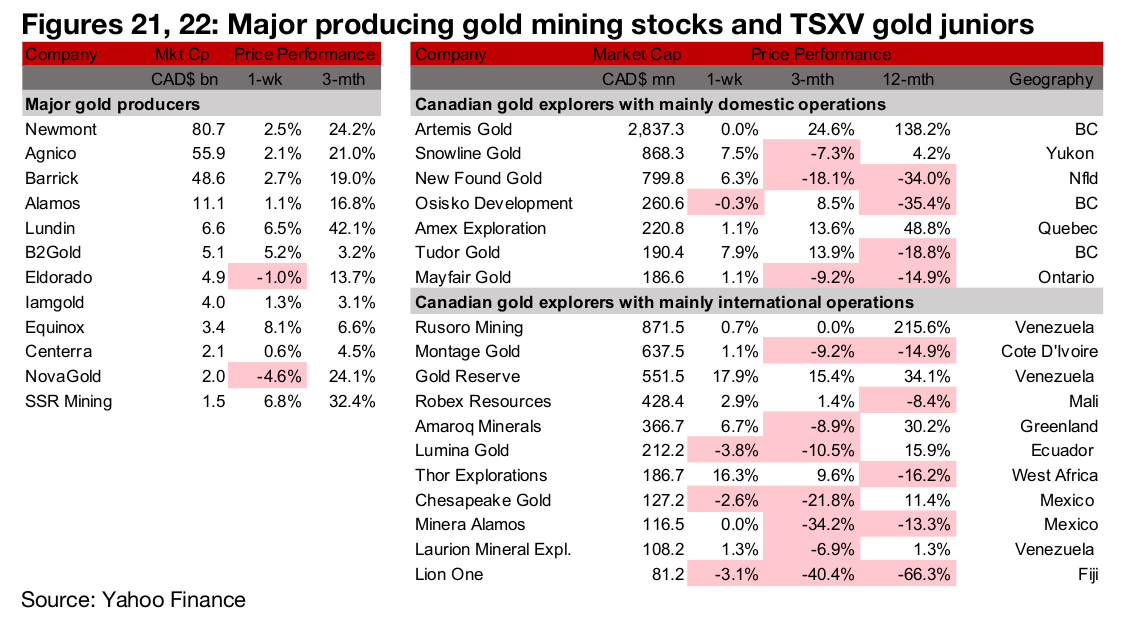
Most large producers and TSXV gold rise
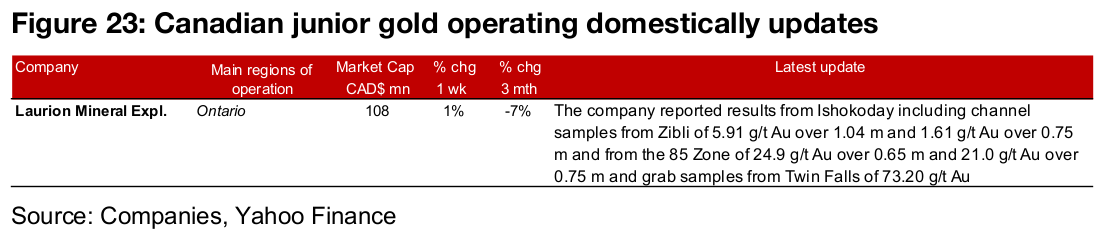
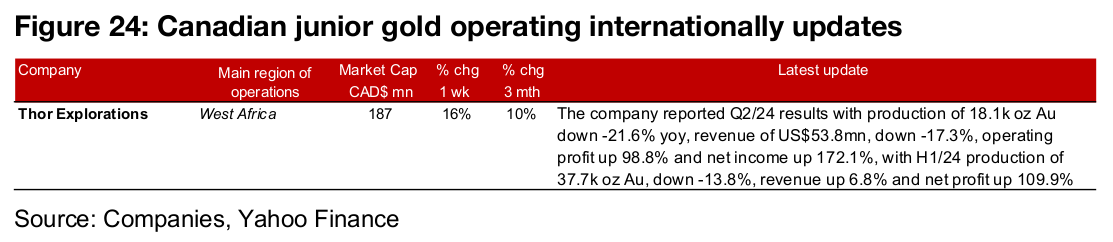
Most of the large producers and TSXV gold stocks rose (Figures 21, 22). For the TSXV gold companies operating domestically, Laurion reported channel and grab samples from Ishkoday (Figure 23). For the TSXV gold companies operating internationally, Thor Explorations reported Q2/24 results (Figure 24).
Disclaimer: This report is for informational use only and should not be used an alternative to the financial and legal advice of a qualified professional in business planning and investment. We do not represent that forecasts in this report will lead to a specific outcome or result, and are not liable in the event of any business action taken in whole or in part as a result of the contents of this report.