June 11, 2021
Employment reports, wage-price spirals, and gold
Author - Ben McGregor
Gold price hovers just below $1,900/oz, US jobs and inflation climb
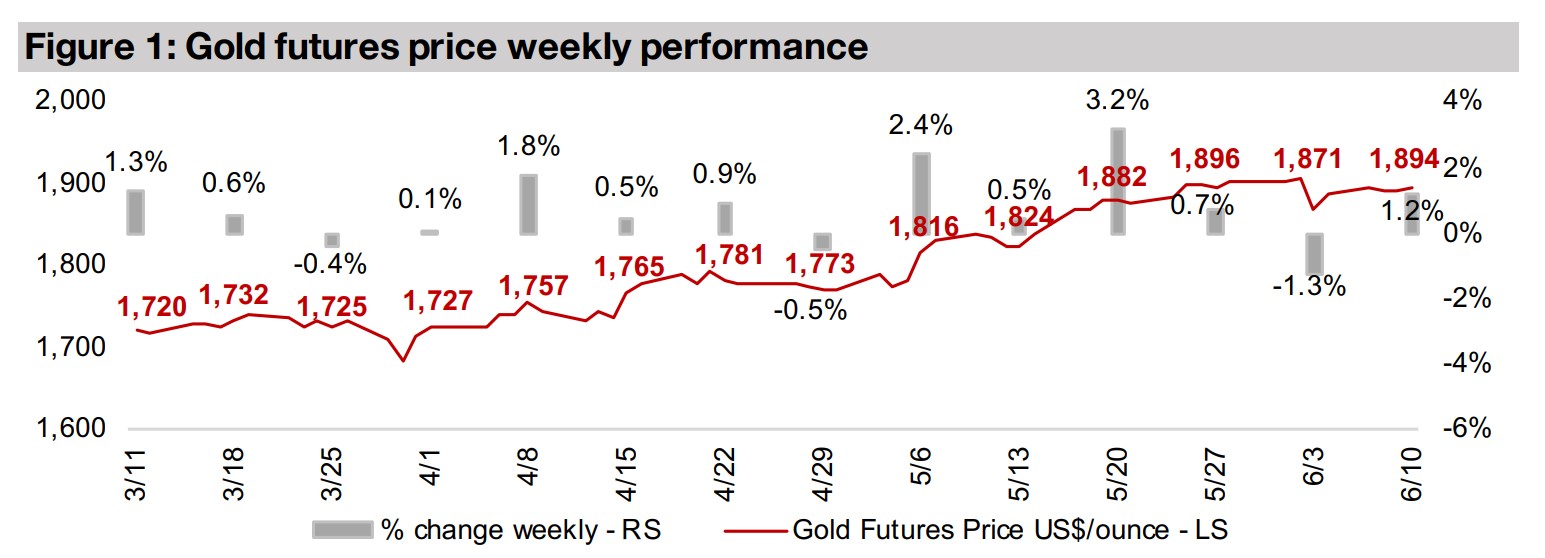
The gold price rose 1.2% this week to US$1,894/oz, as a strong US jobs report, a jump in inflation and Fed mixed messages continue to leave the market in limbo on potential rate hikes, while strong employment could lead to a wage-price spiral.
A look at the mid-tier TSXV junior gold developers and explorers
This week we outline the projects and Resources of the mid-tier TSXV gold developers and explorers, with most of the group having projects at advanced stages, but a split on valuations on considerable differences in grades and costs.
Producers and juniors both up
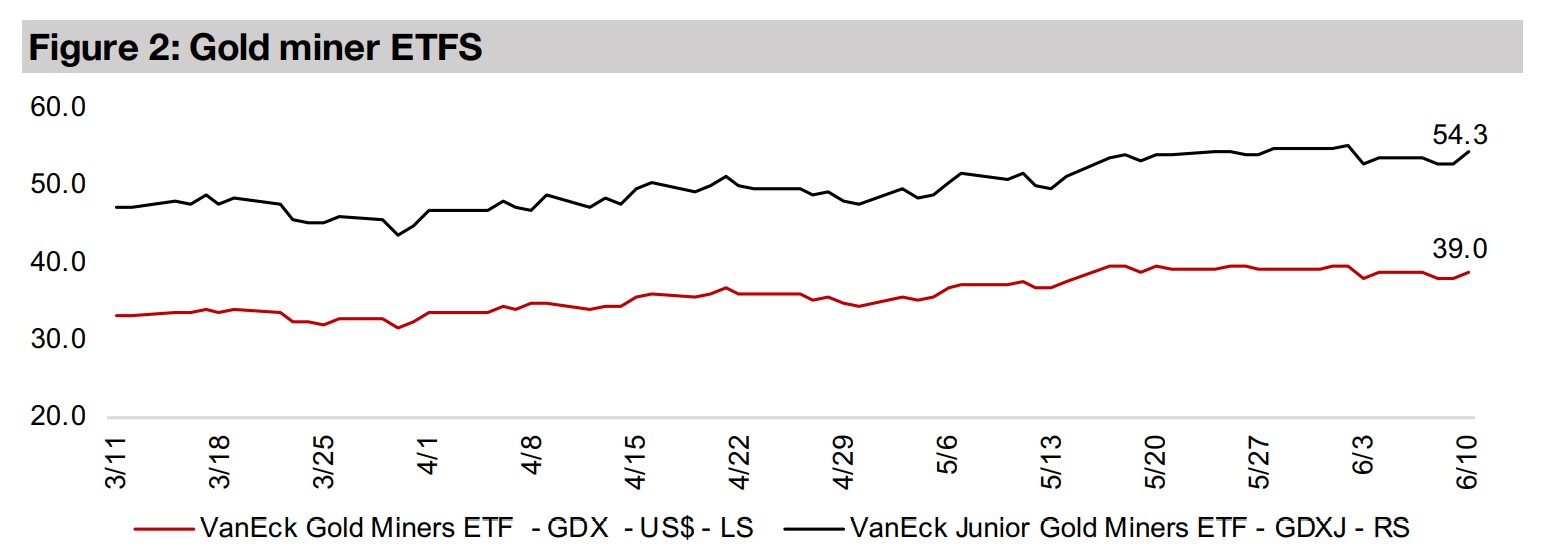
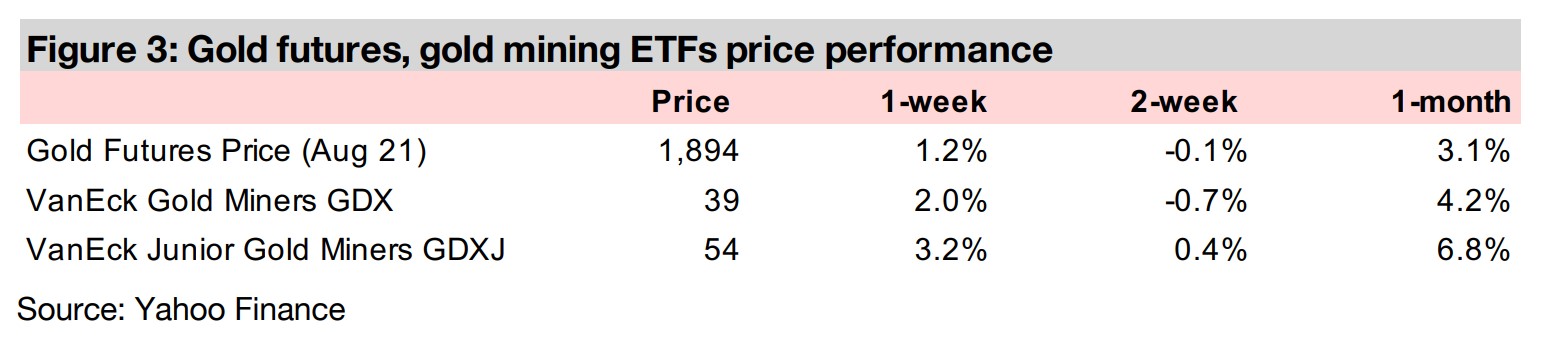
The producers and juniors rose, with the GDX and GDXJ up and Canadian juniors mostly gaining, with the market apparently expecting the Fed to balance rising inflation with a gradual taper, supporting equity markets, including gold stocks.


1) US employment and wage-inflation spirals
Gold was up 1.2% this week to US$1,894/oz, as strong jobs data out of the US and some mixed messages from the Fed seemed to have the market anticipating that the Fed can balance the current rise in inflation with a gradual taper, and manage the economy towards steady growth without overheating. Given the epic amount of money printing over the past year, we are not so sure that inflation will so easily be contained, as it jumped to 5.0% in May 2021, up from 4.2% in April 2021, the highest number since 2008. Fed Chair Janet Yellen recently said in a speech that higher interest rates, presumably rising because of higher inflation, would be 'good for the country.’ Fed Board member Mester saw the recent strong jobs report as a good sign, but stated it was not enough yet for the Fed to change its policy and start tapering earlier or more aggressively than already planned. If the Fed continues to 'play chicken' with inflation, and let it run for now, gold, which is widely viewed as an inflation hedge, should benefit.
The potential for wage-price spirals for the first time in decades
We believe that we are starting to see the potential for something that has not really
been seen in decades, a wage-price spiral. This is where the economy tends to be
expanding rapidly and inflation starts to pick up materially, and employees demand
higher wages to maintain their living standards. This in turn drives businesses to rise
prices to maintain their margins, which in turn drives employees to push for higher
wages. The phenomenon obviously requires a period of strong monetary expansion
to be maintained, and we certainly have that currently. However, we really haven't
seen anything like this situation persisting over an extended period in recent decades,
but it was a common phenomenon of the 1970s and 1980s. The general idea of the
wage-price spiral is that both employment and inflation are rising together, but the
1970s had the unfortunate combination of both inflation and very slow growth, called
stagflation, which was unexpected at the time.
It is unclear whether stagflation could be repeated given the current structure of the
economy, as the 1970s wage-price spiral was affected largely by trade unions, which
would fix wages for large numbers of workers. Currently, unions have much less
effect on driving wages in the economy, and we expect that given the large amount
of non-full-time workers in the US economy, that an economic slowdown would likely
just lead to lower wages and reductions in the workforce, and the structure for
stagflation might just not be there. However, in an overheating economy driven by
massive monetary stimulus, we see the potential for a wage-price spiral to definitely
be there, as there is already both rising inflation and employment shortages, meaning
that workers may be able to demand higher wages.
US jobs report shows that economy continues to heat up
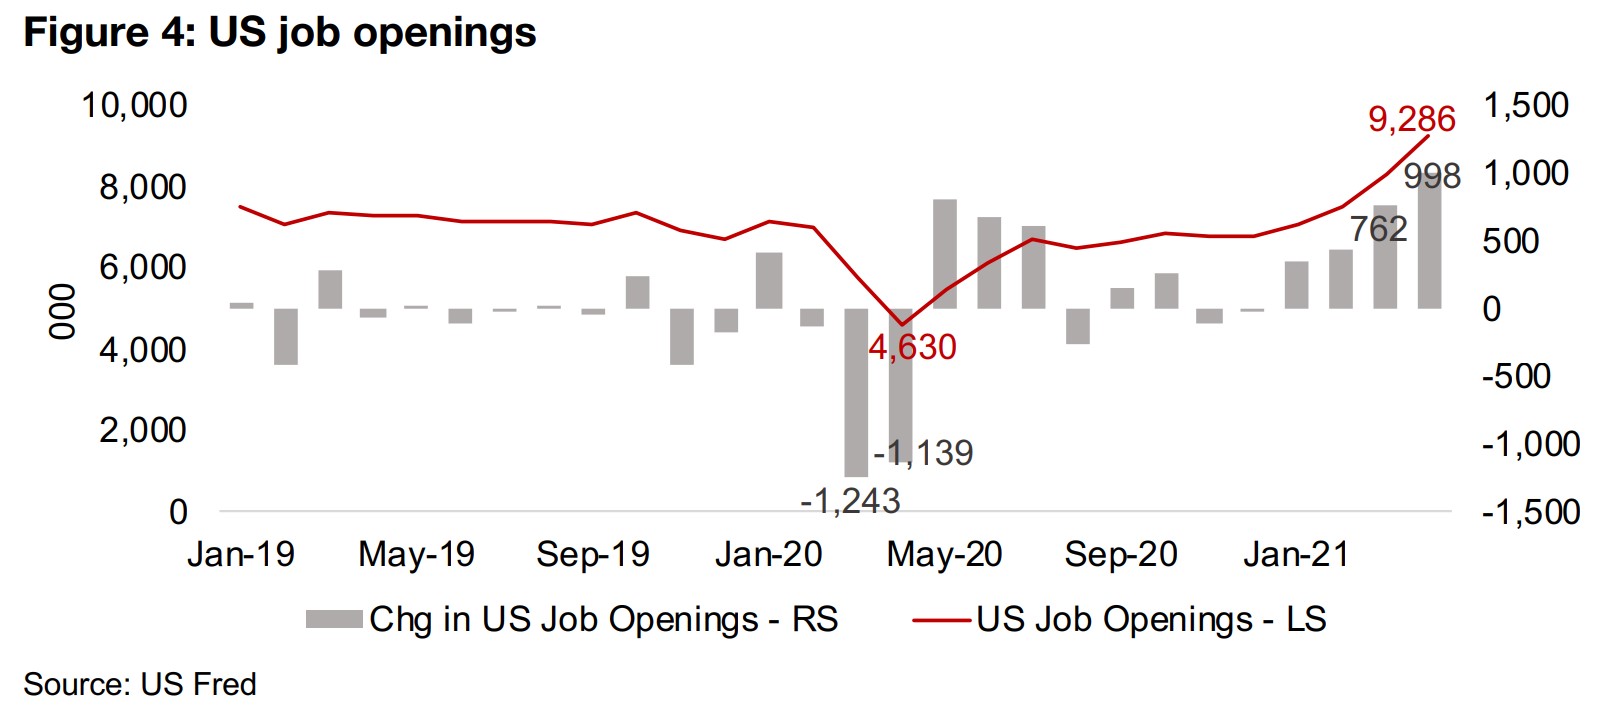
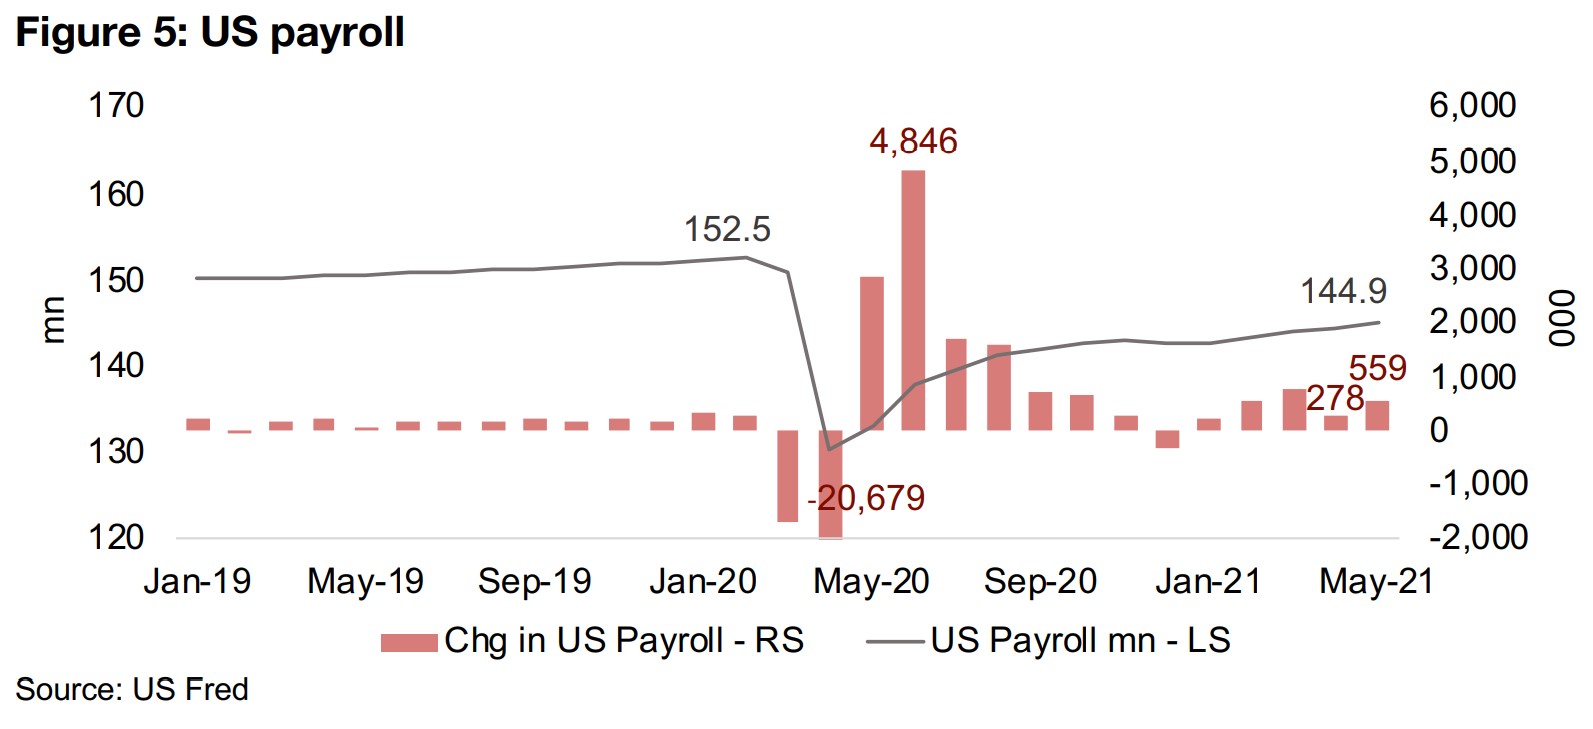
We can see some evidence for a surprise 'overheating' in the labor market in the recent US jobs reports, with the change in US job openings spiking from near zero in December 2020 month-on-month to 998k by April 2021, and the total job openings about doubling from 4,630k at the depths of the crisis in April 2020 to 9,286k as of April 2021 (Figure 4). US Payrolls saw a similar surge in May 2021, with a gain of 559k, the highest since September 2020, nearly doubling from 278k in April 2020. However, US Payrolls are still below the 152.5mn level of February 2020, just before the crisis began, and remain down 5.0%, at 144.9mn. This may be the Fed's justification for the idea that while the jobs report was strong, it was still not strong enough for major policy changes. However, if we see payrolls start to move strongly past the early 2020 levels, the Fed could start to get increasingly more cautious, especially with inflation coming in above expectations over the past two months.
2) A look at the mid-tier TSXV juniors
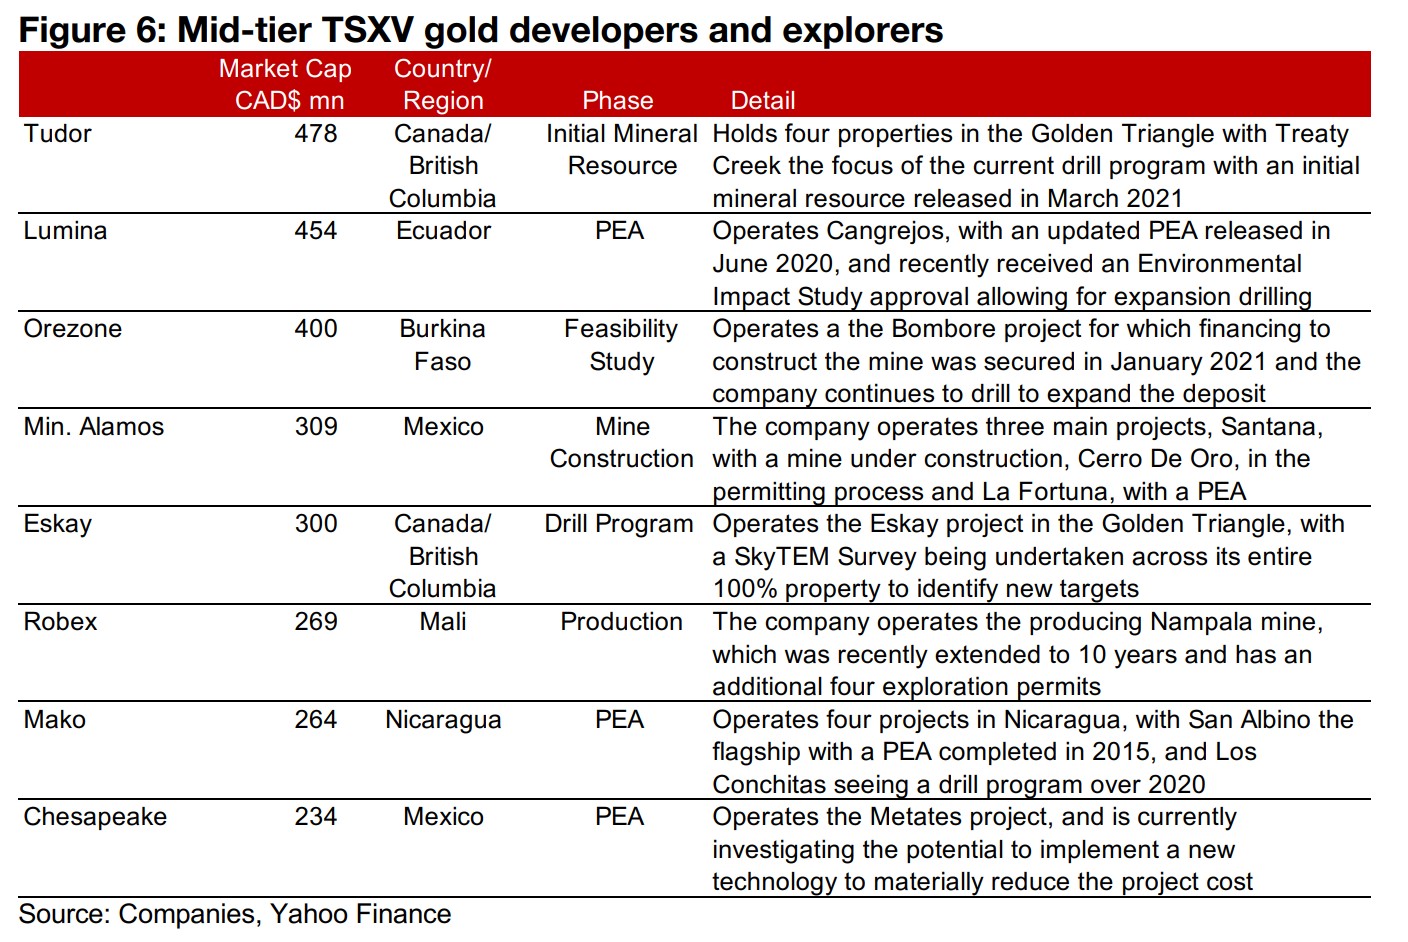
Company specific drivers moving mid-tier TSXV gold developers and explorers This week we review the recent performance and progress of the mid-tier TSXV junior gold developers and explorers. The period from the second half of 2019 into 2020 was really a golden period for the Canadian gold juniors almost across the board with the rise in the gold price giving a boost to most companies. However, since the second half of 2020, while gold has held up at a reasonably high levels, it slid for most of the period, and performance of gold juniors has become much more based on company specific developments. While most of the mid-tier TSXV juniors in Figure 6 continue to progress, they range in market cap from $478mn to $234mn, and have not had the outstanding drivers that have pushed up many of the larger TSVX gold plays (including New Found Gold, Rupert, Great Bear, Artemis and Pure Gold).
The strongest performer of the group by far has been Eskay Mining, which surged
1,272% over the past year (Figure 7). The largest portion of this move was after the
December 2020 discovery of two precious metal-rich volcanogenic massive sulphide
deposits at the TV and Jeff targets in the Golden Triangle in B.C. on its 80% owned
joint venture with Kirkland Lake, which holds the remaining 20%. The company has
continued to define targets at the project, including a property-wide SkyTEM survey
started in April 2021. Of the companies in Figure 6, it is in the earliest stages, and has
yet to release an initial mineral resource, and has no consensus target price.
The next strongest performer has been Tudor Gold, up 162%, another operator in
the Golden Triangle, and also at an early stage, with an initial mineral resource
estimate released in March 2021, the largest of the group, at 27.30mn Au oz (Figure
8). However, Tudor trades near the bottom of the group on an EV/Resource of $17/oz
Au versus the average of $160/oz, given the relatively early stage of the project and
its relatively low grade, with its M&I Resources of 19.4mn oz at 0.74 g/t and Inferred
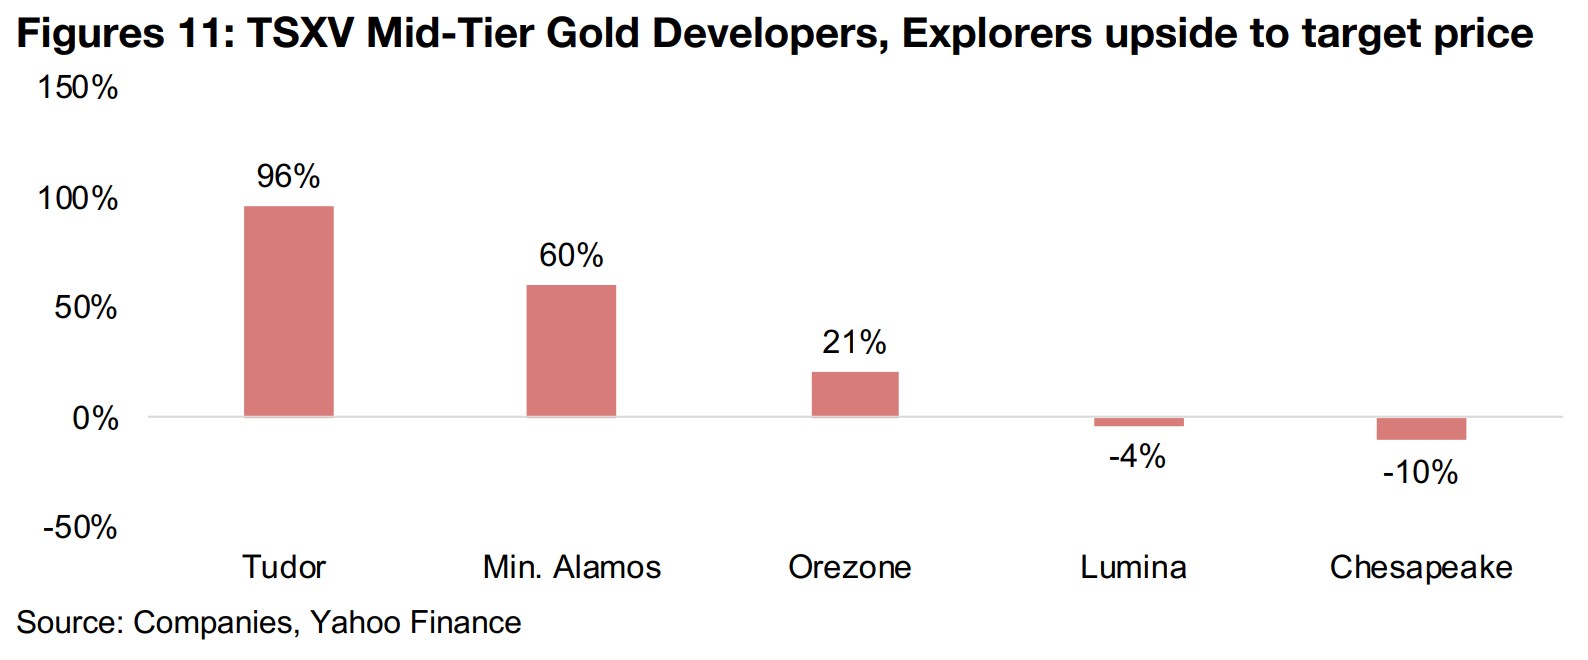
Resources of 7.9mn oz at 0.79 g/t (Figure 9). However, the market expects Tudor to
be able to advance the project, with 96% upside to its target price (Figure 11)
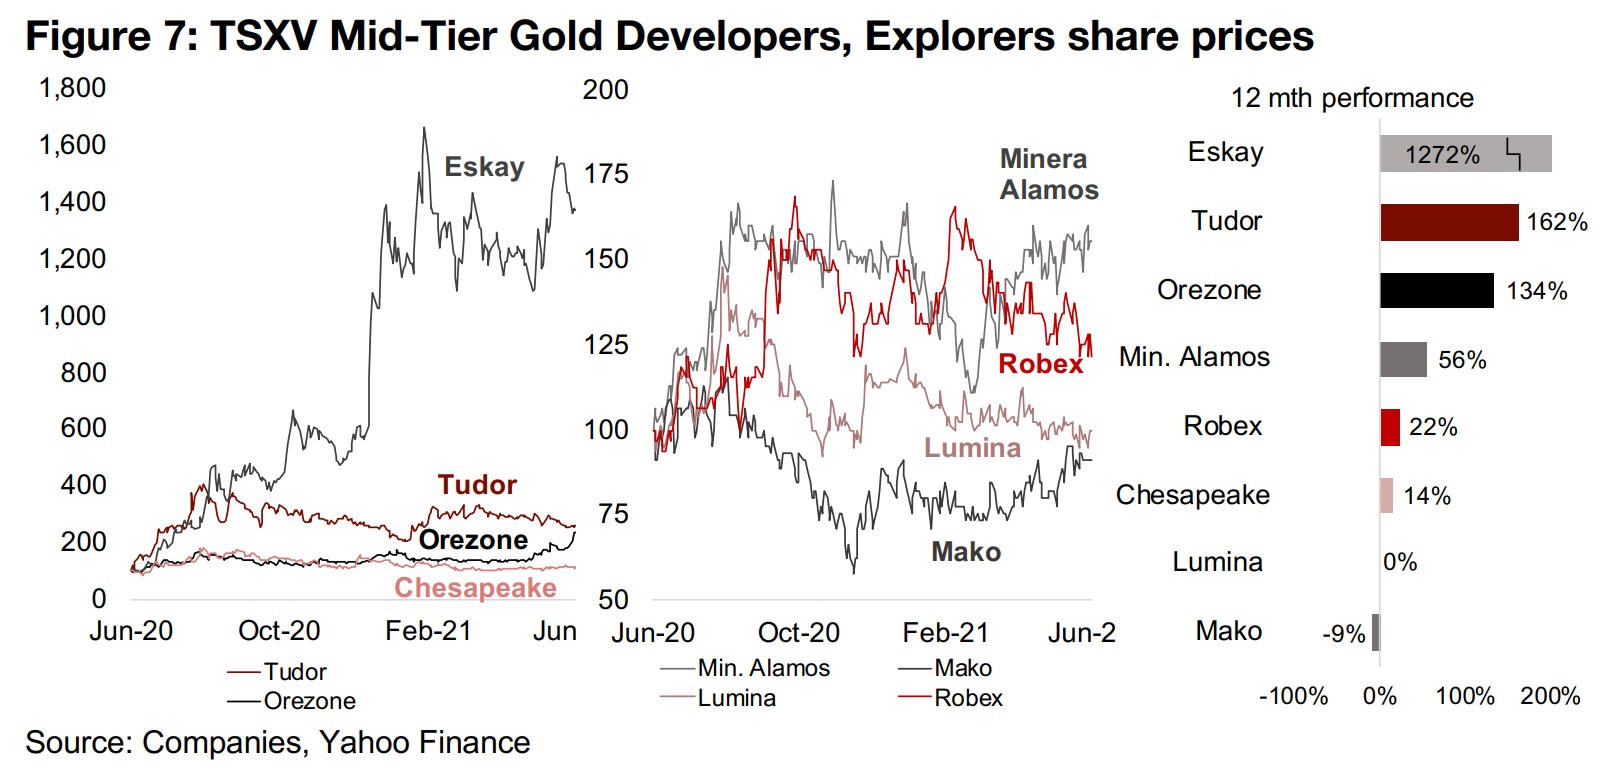
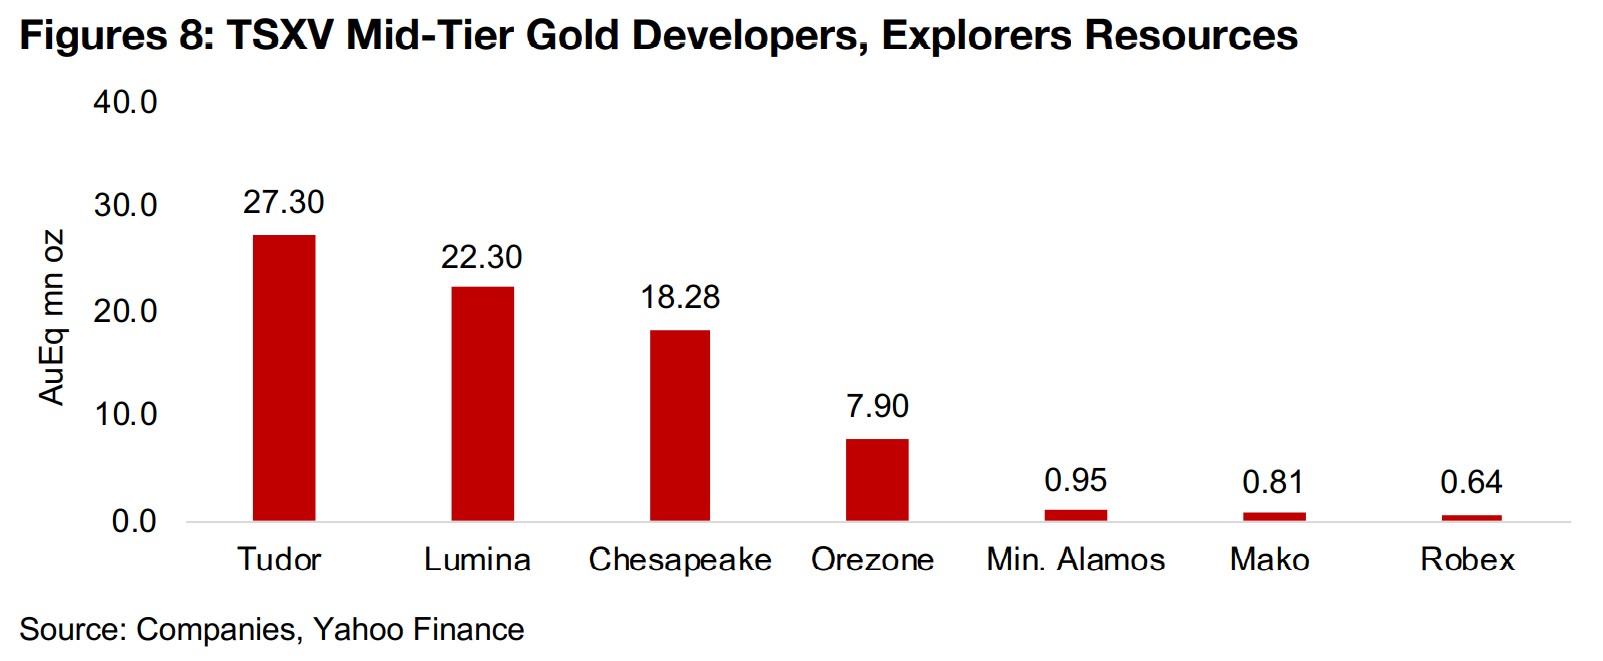
The next strongest performer is Orezone Gold, up 134%, at the Feasibility Study (FS) Stage at Bombore, with 7.90mn oz Au in Resources. The company trades at a relatively low EV/Resource of $49/oz Au, driven by relatively low grade of 0.81 g/t and the highest AISC of the group at $730 (Figure 11). Although the company continues to advance the project with a recently announced progress on a debt package for mine construction, there is only a moderate 21% upside to its target price.
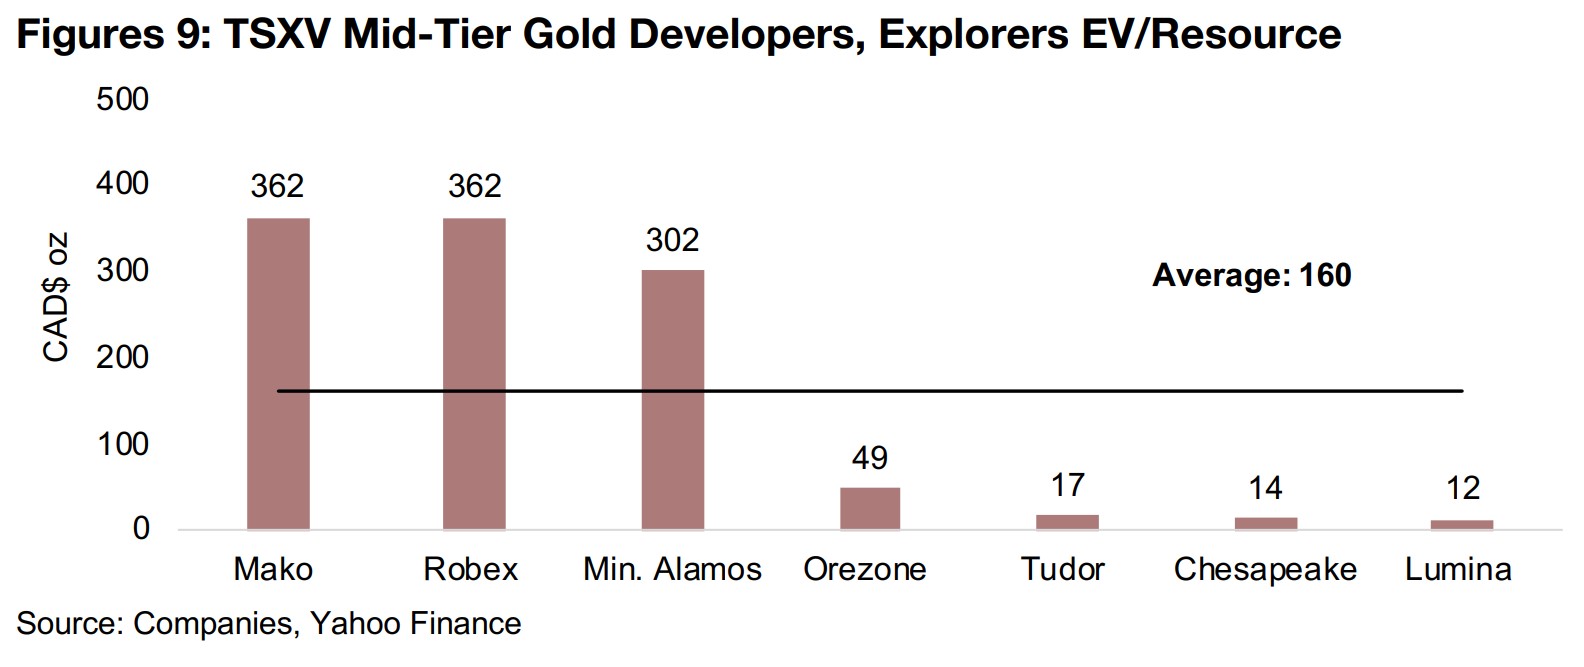
Operator of three projects Minera Alamos is up 56%, with a mine under construction, one in the permitting process and another at the PEA stage. It has a relatively low 0.95mn in Resources, but trades at an EV/Resource of $302/oz, given both the high grade and low cost of its projects, as shown by the La Fortuna PEA, and the potential from having more than one advanced stage project. The market expects the company to continue to progress this year, with 60% upside to consensus target price.
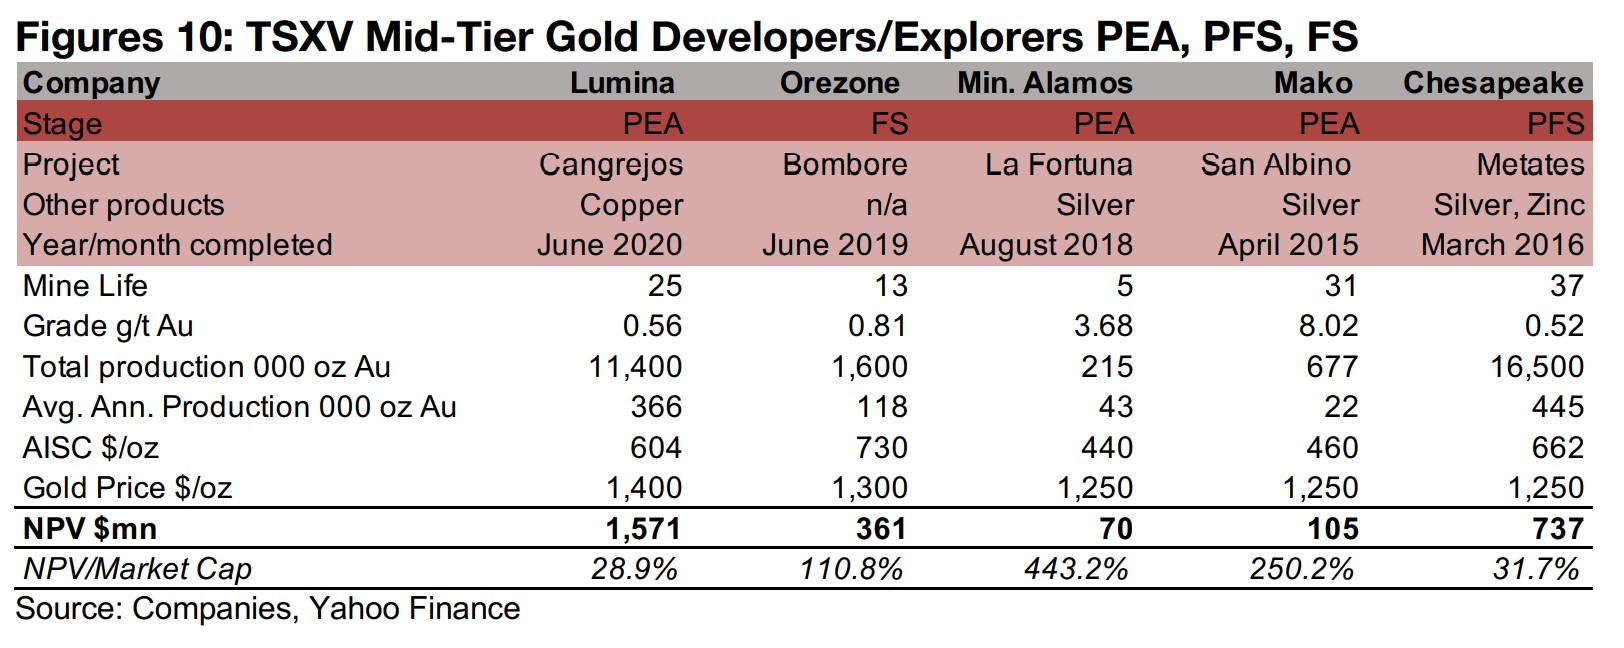
The only company in the group already in production is Robex Resources, up 22% this year, with the smallest Resources of the group at 0.64mn oz Au, although it trades at the second highest EV/Resource for the group, at $362/oz Au, as it is the least risky of the group given that it already has output and is generating cash flow. Given the small size of the company, however, it is not actively covered by analysts, and therefore has no consensus target price.
Operator of the Metates project, with 18.28mn oz in Resources, Chesapeake Gold,
is up 14% over the past twelve months, and trades at an EV/Resource of just $14/oz,
the second lowest of the group. This is largely because while the project is potentially
very large, the grade is the lowest of the group and the costs high, as outlined in the
PFS. The company is currently testing the possibility to use a new technology that
would dramatically lower its cost base, including a scoping study that is currently
ongoing. However, the market appears to be waiting for more evidence that the new
technology can be implemented at Chesapeake, with a -10% downside to its target
price
The share price of Lumina Gold, operator of the Cangrejos project, has been flat over
the past twelve months. While it has one of the largest Resources of the group, at
22.30 mn oz Au, it trades at the lowest of the group on EV/Resource, at just $12/oz
Au, as its PEA outlines a low grade versus the group and a reasonably high cost. The
market sees the company as just slightly overvalued currently, with -4% downside to
its target price.
The weakest share price performance of this group over the past year is from Mako
Mining, operator of the San Albino project, down -9%. While the company has a
small resource versus the group at 0.81mn oz Au, it trades at the highest EV/Resource
of the group at $362/oz Au, driven by a very strong grade, the highest of the group
by far, and relatively low cost, as outlined in the project's PEA. The underperformance
over the past year may be because of a strong performance in earlier periods, with
Mako up 400% since June 2019, but no major advancement from the strong PEA
over the past year, and the company needing to move closer to production to unlock
more value. Mako Mining has no consensus target price, so we do not have a
quantitative outlook on the market's view on the potential upside for the shares.
Producers mostly rise as gold moves against upside resistance
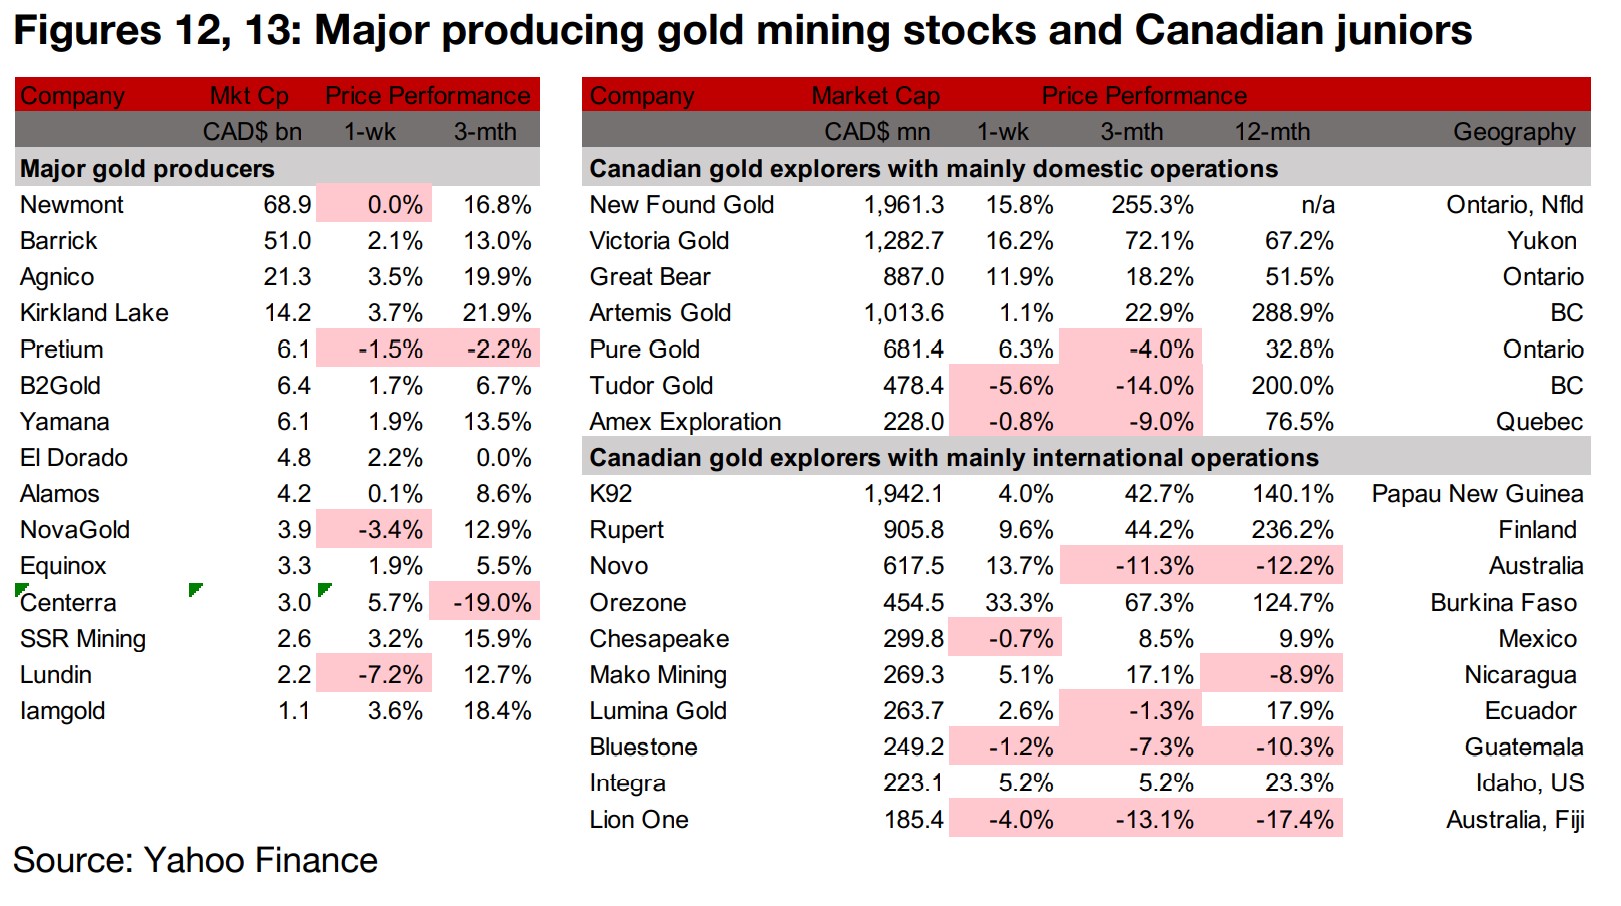
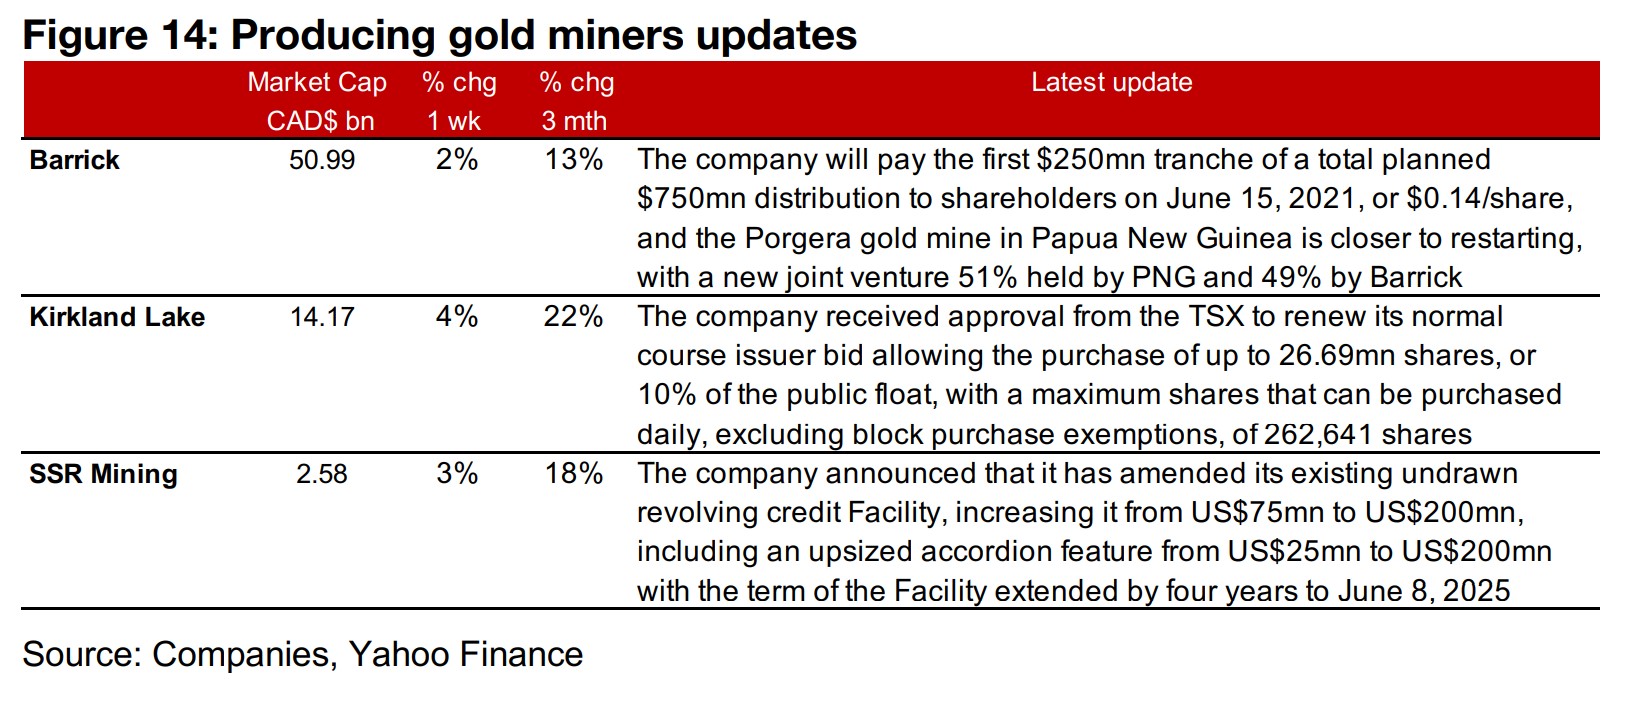
The major gold producers were mainly up this week as gold continues to push against upside resistance (Figure 12). News flows included Barrick's payment of the first $250mn tranche of a $750mn planned distribution to shareholders, Kirkland Lake receiving approval from the TSX to renew its normal course issuer bid for the purchase of up to 10% of its public float, and SSR Mining increasing an undrawn revolving credit facility to US$200mn from US$75mn (Figure 14).
Canadian juniors mostly rise
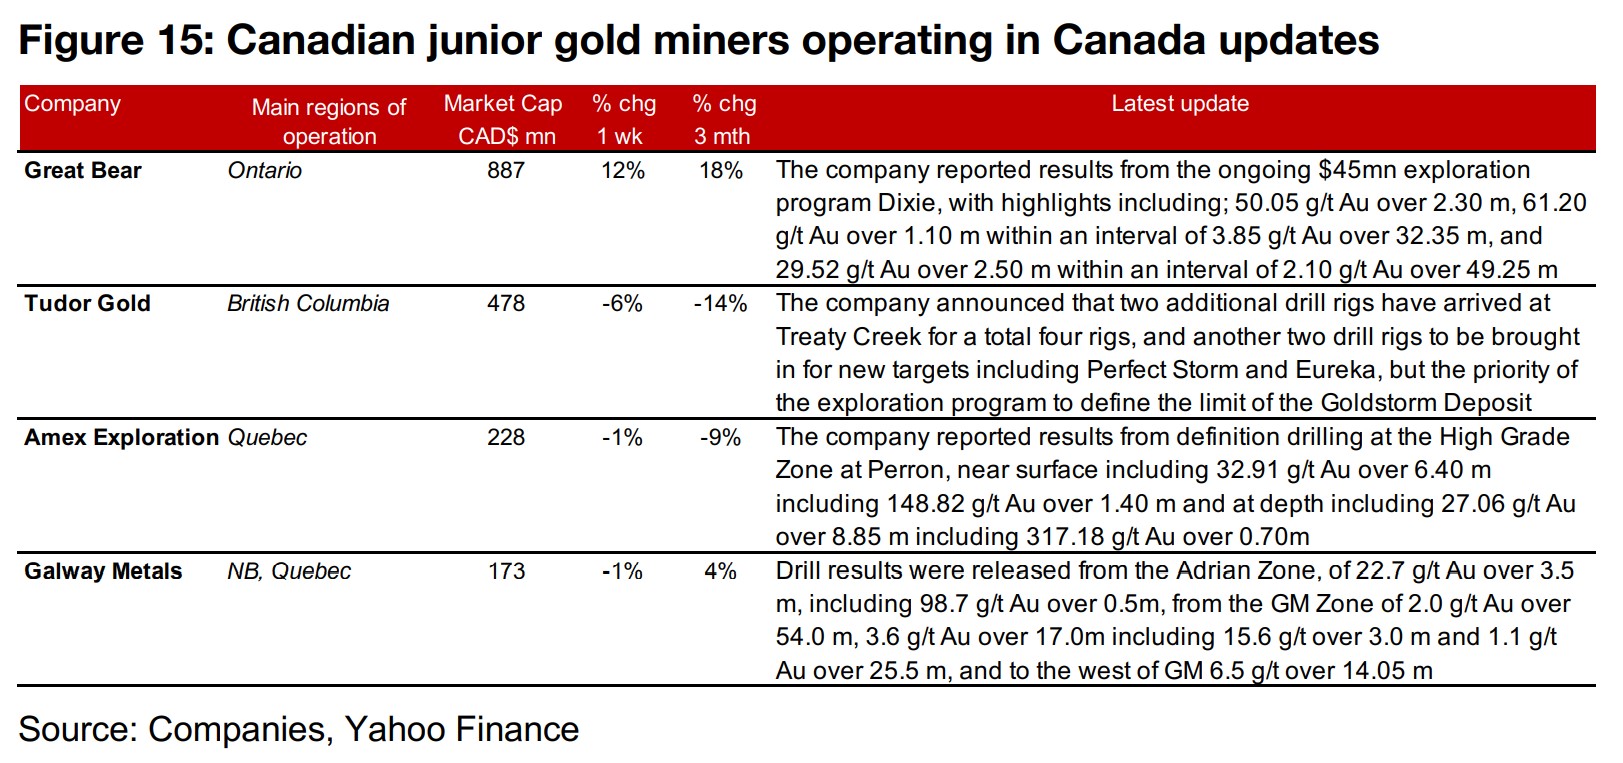
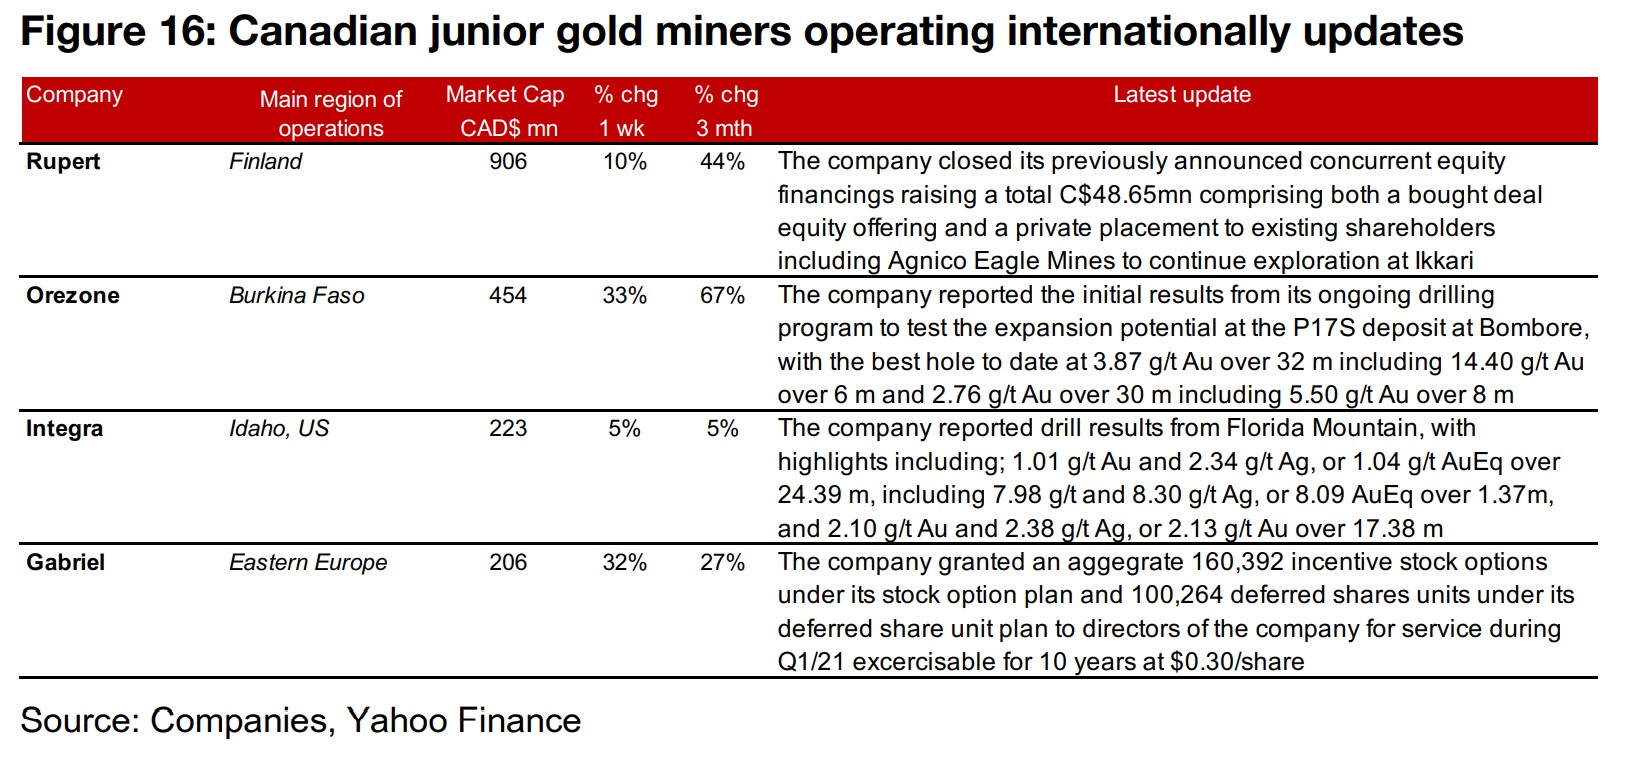
The Canadian juniors were mostly up this week (Figure 13). For the Canadian juniors operating domestically, Great Bear, Amex and Galway reported drilling results from Dixie, and Tudor saw two additional rigs arrive at Treaty Creek (Figure 15). For the Canadian juniors operating mainly internationally, Rupert announced the closing of previously announced equity financings, Orezone and Integra reported drill results, and Gabriel granted incentive stock options to directors (Figure 16).
Disclaimer: This report is for informational use only and should not be used an alternative to the financial and legal advice of a qualified professional in business planning and investment. We do not represent that forecasts in this report will lead to a specific outcome or result, and are not liable in the event of any business action taken in whole or in part as a result of the contents of this report.