August 12, 2024
Crash Resistant Metals
Author - Ben McGregor
Majority of metals hold up well in market crash
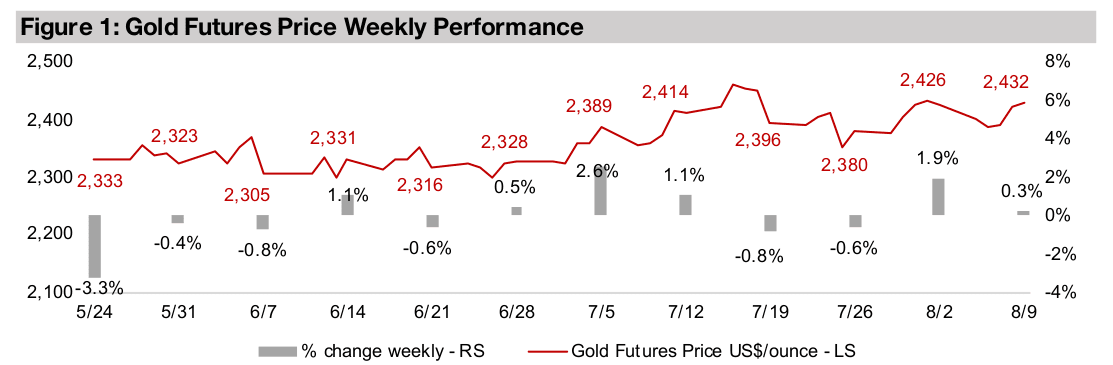
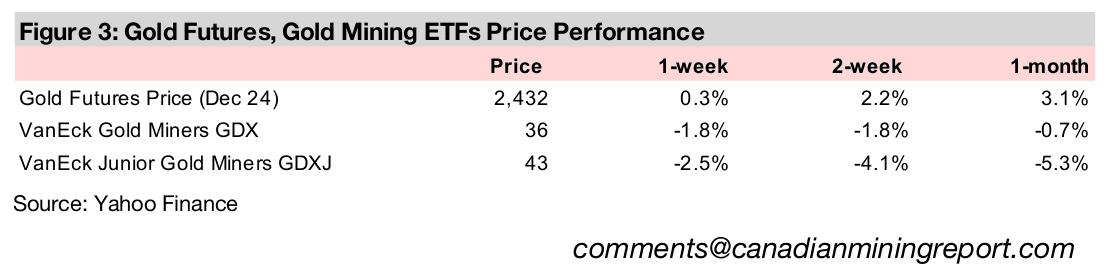
The gold price rose 0.3% to US$2,432/oz and held up well given the market crash, as did the majority of the metals, a vote of confidence from the market overall in the sector, with the only major decliners being China-driven iron ore and lithium.
Major equity indices outpace gold stocks after crash rebound
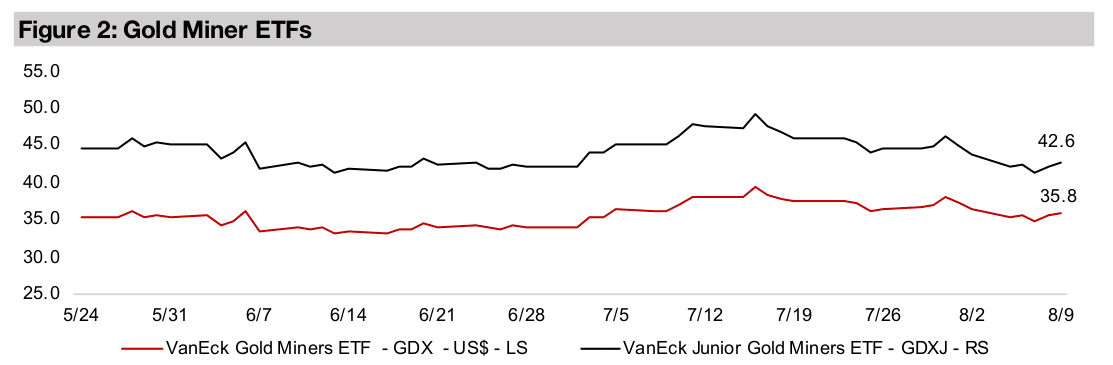
While gold stocks outperformed most sectors initially in the crash, the S&P 500 climbed back to flat by the end of the week, surpassing the -1.8% drop in the GDX, while the -2.0% decline in the Russell 2000 beat the -2.5% drop in the GDXJ.


Crash Resistant Metals
Gold rose 0.3% to US$2,432/oz, shrugging off a dip earlier in the week at the depths
of the market crash. The gold stocks ended the week down, with a -1.8% drop in the
GDX underperforming a flat S&P 500 which clawed back its losses for the week, while
the GDXJ’s -2.5% loss was beat out by a -2.0% drop in the Russell 2000. However,
as this week alone does not show the full extent of the shifts during the crash, which
was already well underway already in the previous week, pulling back to a view from
July 26 to August 9, 2024 gives a clearer picture of what has been unfolding.
The gold stocks held up better than most sectors from July 26 to August 9, 2024,
with the GDX ETF of producers down just -1.8%. There was a clear shift during the
crash away from riskier sectors where valuations had started to look excessive and
towards safer sectors with relatively low multiples (Figure 4). This was actually part of
a rotation that already been underway through much of the year and while we had
expected it would continue, did not anticipate it would become so severe so quickly.
One of the most obvious signs of the flight to safety, in addition to the relative strength
in gold stocks, was the dramatic outperformance of U.S. Utilities, the classic
defensive sector, up 3.3% from July 26 to August 9, 2024. Broadening the scope
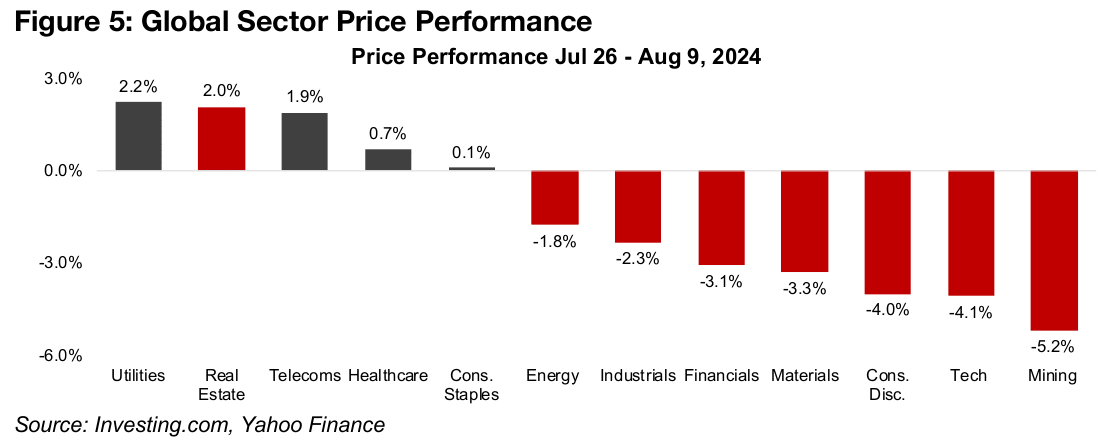
globally shows the same trend, with defensive sectors clearing outperforming (Figure
5). Global utilities led markets in the crash, rising 2.2%, and other ‘safe’ sectors
outperformed, with telecoms, healthcare and consumer staples up 1.9%, 0.7% and
0.1%, respectively. The only major sector that gained that was not clearly defensive
was real estate, with the global REITs up 2.0%.
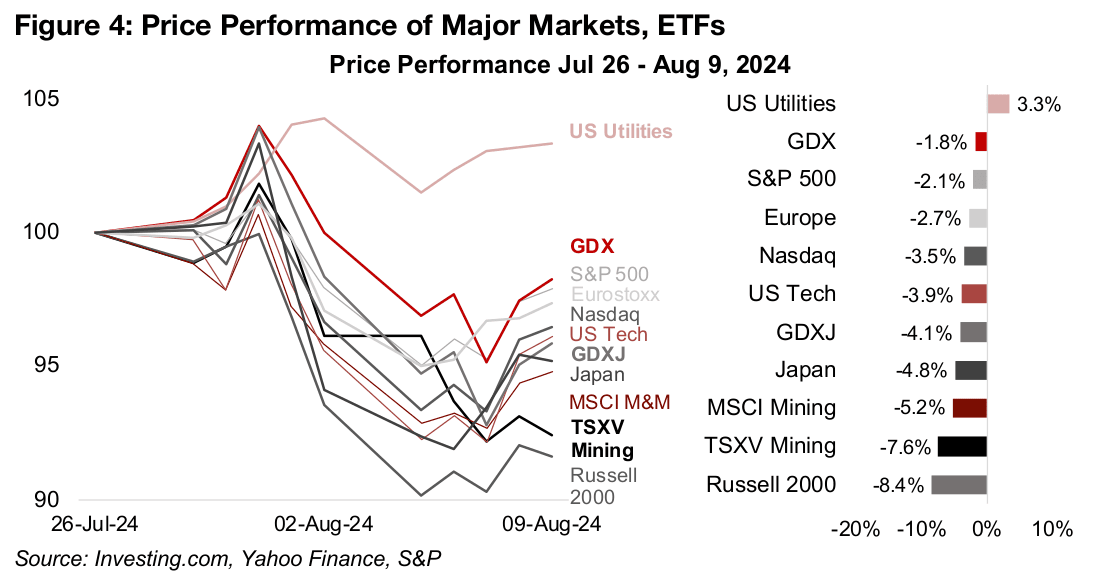
The clearest risk off sign was the -3.9% slump in US Tech, with the seemingly
unstoppable rise of the past several years finally collapsing under the weight of
increasingly extreme valuations. This dragged down the Nasdaq -3.5%, and both
significantly underperformed the -2.1% drop in the S&P 500. The slump in the small
cap Russell 2000 Index by -8.4% was another strong risk-off sign, reversing
significant gains in July 2024 and ending a brief trend of the market finally shifting
into risk beyond just US Tech. Other cyclical sectors including consumer
discretionary, materials, financials, industrials and energy all sold off, as expected in
a flight to safety, down -4.0%, -3.3%, -3.1%, -2.3% and -1.8%, respectively.
While larger cap gold stocks did well in the crash, the mining sector overall struggled,
with the MSCI Global Mining Producer ETF and iShares Global Mining Sector ETF
both down -5.2%. This was driven by a high weighting of stocks with large exposures
to iron ore and copper, which both dropped considerably in the crash. The risk-off
sentiment also hit the junior gold miners, which were affected by the broader sell-off
of small caps, although the -4.1% decline in the GDXJ was only just below the -3.9%
fall in US Tech. The S&P/TSXV Metals and Mining Index was down -7.6% given the
particularly risky nature of the pre-revenue microcaps making up most of the index,
although interestingly it still outperformed the Russell 2000.
While Europe underperformed the S&P 500, down -2.7%, Japan was the worst hit large international market, ending the tumultuous period down -4.8% even after a sharp rebound from over an -8.0% drop at the lows. This was because of an ‘unwinding Japan carry trade’, as we discussed at length last week. For years, investors borrowed at low rates in Japan, lent abroad at higher rates, made a wide spread, and then eventually paid off their borrowings, often more cheaply as the Yen depreciated against other currencies. However, US yields recently declined and Japanese yields rose especially after a surprise rate hike by the Bank of Japan. This caused the carry trade spread to contract and the Yen to appreciate significantly, making paying back borrowings in the currency suddenly more expensive.
Likely more sector rotation and carry trade unwinding to come
The abrupt rebound from the crash gave the market some hope that this was just a
temporary plunge. However, the fundamentals indicate that the two big trends driving
the slump, sector rotation and the unwinding carry trade, could continue. The price
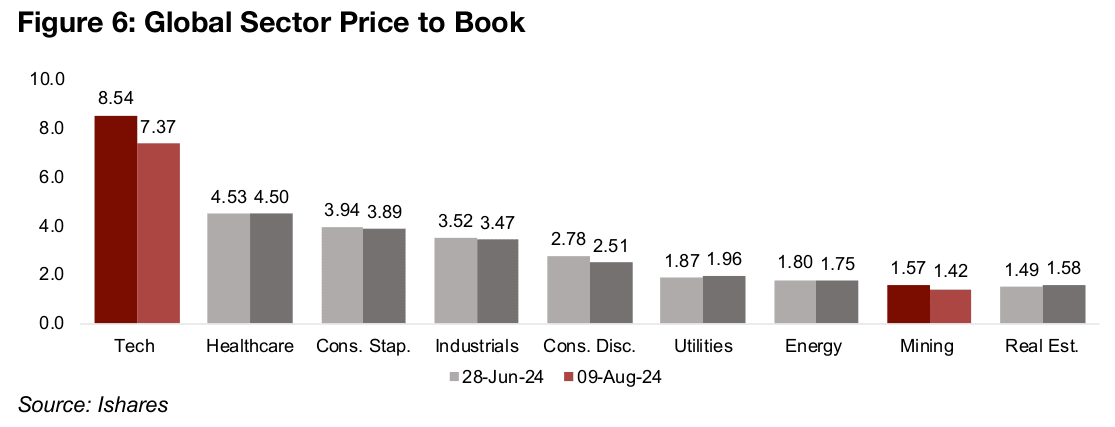
to book (P/B) valuations for the major global sectors still look imbalanced and have
room to converge further. Data available as of August 9, 2024, which account for the
crash show the Tech P/B still especially standing out, even after declining to 7.4x
from 8.5x at the end of June 2024 (Figure 6). This remains well above other sectors,
with the next two highest, healthcare and consumer staples, at just 4.5x and 3.9x.
While this has partly been driven by Tech’s relatively strong earnings growth, these
multiples imply that this can be sustained for a very long period, while the most recent
results season has shown some hints that growth could start to slow. Mining
continues to trade at exceptionally low multiples, and while this does reflect lower
earnings expectations, a long period of slow growth seems to be priced in, providing
a cushion to the downside. That the market sell-off of global miners was only just
below global tech, even given the substantial gap in growth expectations, indicates
that markets may have been more forgiving of the former and wary of the latter.
The Japan carry trade could also unwind further. While the recent increase in the base
rate to just 0.25% by the Bank of Japan is not excessive in an absolute sense, it has
to be compared to the even lower levels to which carry traders had become
accustomed. The base rate averaged -0.10% from early 2016 to early 2024, was
boosted to 0.10% in March 2024 and then to 0.25% at the end of July 2024. This is
a more than a tripling of borrowing costs this year, which is reflected in the rise in
Japan’s 10-year bond yields from 0.24% in January 2024 to 0.85% currently. This
obviously massively increased borrowing costs for carry traders and will put pressure
on the Japanese economy overall. It also implies a rise in discount rates, and
therefore a decline in equity valuations, and would have been partly the cause of the
major decline in Japanese stocks over the past two weeks.
The depreciation of the Yen over the past two years to a trough of JPY160/US$ is
also unprecedented over the past twenty-five years, with an average since 1997 of
about JPY110/US$, ranging from JPY80/US$ to JPY120/US$. While the exchange
rate has pulled back in the recent crash to JPY147/US$, a reversion to this long-term
average would indicate a much further decline. Overall we suspect that the recent
shock will see markets much more wary of engaging in this carry trade, at least as
aggressively as they had for the past several years.
Metals prove to be crash resistant overall
The metals prices proved quite crash resistant over the past two weeks overall and
seemed to get a vote of confidence from the market. This was partly because a major
correction for most metals had already run its course, with the sector declining
through June and July 2024 after a surge from March to May 2024 which looks quite
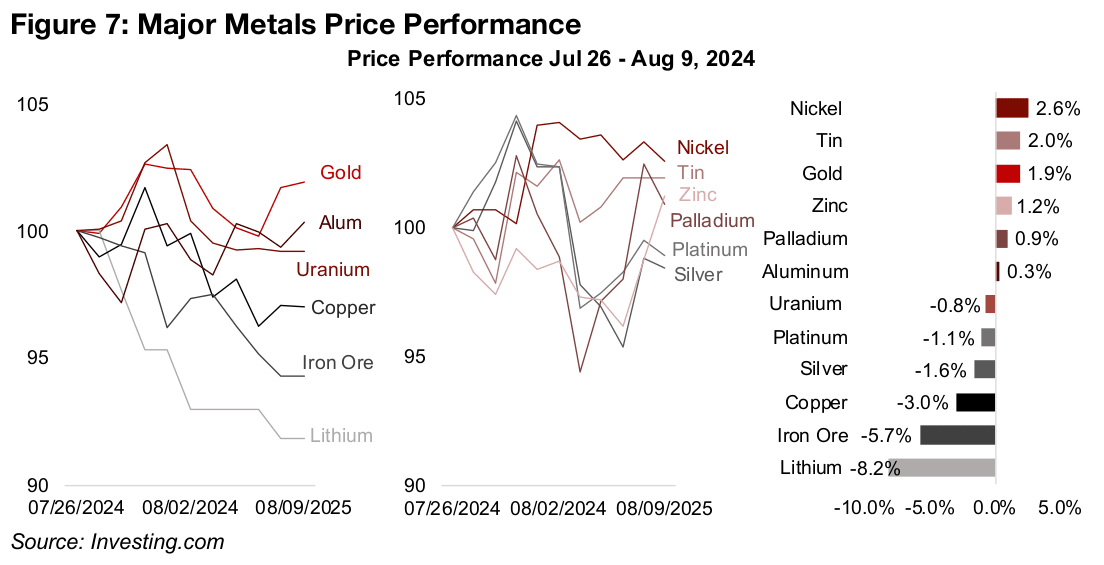
speculative in retrospect. Nickel tin, gold, zinc, palladium and aluminum all rose from
July 26 to August 9, 2024, and pullbacks in uranium, platinum and silver were only
moderate, and outpaced the declines in most major markets (Figure 7).
The drop in copper was larger, and somewhat of a concern given that it is a such a
key global bellwether for economic conditions. However, the metal had one of the
strongest up moves in mid-2024, and may still be correcting speculative excesses,
having only returned to March 2024 levels since the crash. The big losses were in
what are effectively China-driven metals, iron ore and lithium. For iron ore, the
majority of global demand comes from the country, especially for use in steel, for
which demand is weakening on lower construction activity. For lithium, the majority
of the global chemical production and electric vehicle purchases driving supply and
demand for the metal are in China, with the former expanding and latter slowing.
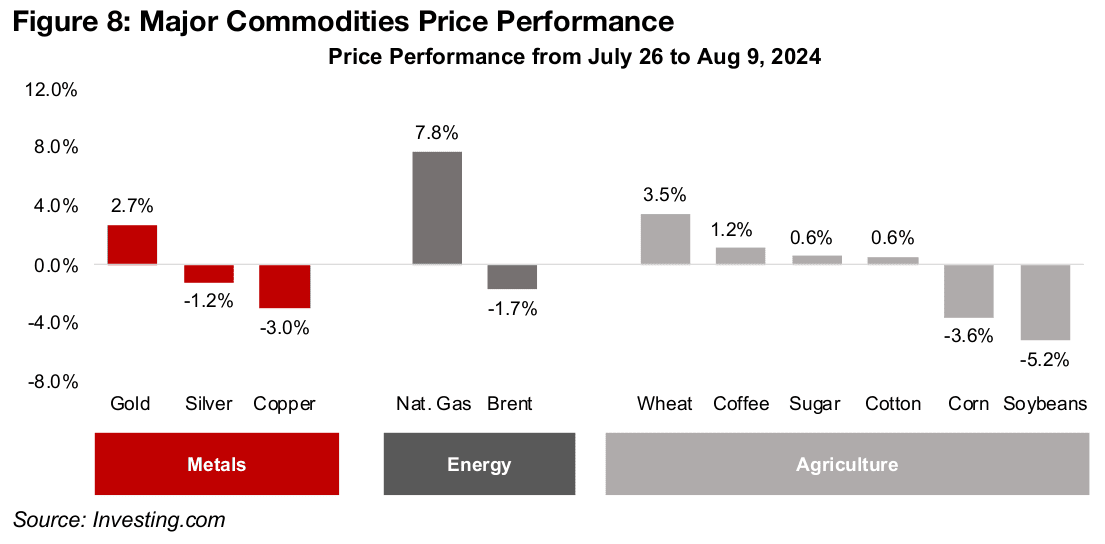
The resilient metals implied that the crash was likely not because of a spike in concerns over a global economic downturn, which would have likely dragged down the sector more substantially. Fears of such a decline would probably have also hit commodities prices more broadly, but they also held up well. Standouts to the downside were copper, corn and soybeans, but these moves were not particularly extreme (Figure 8). This implies that the crash was more about quite severe imbalances in valuations that had built up over the past two years starting to be corrected. Specifically it appears that the US$, US Tech and other risk sectors were trading too high, and the Yen, gold and safe haven equity assets trading too low.
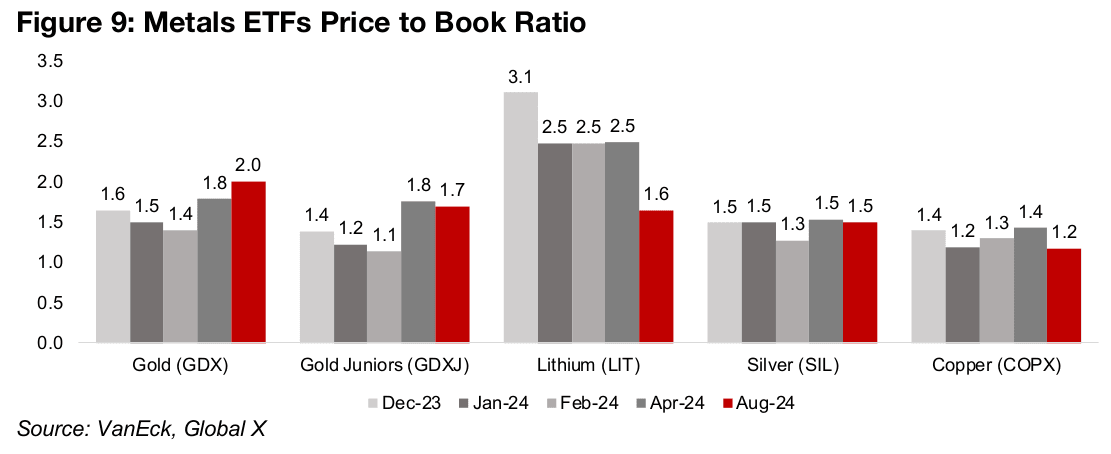
Metals ETFs valuations remain subdued
Even with the metals prices holding up during the crash, and even given the potential
start of a shift away from tech into other sectors, the metals ETFs overall haven’t
benefited much from this so far, leaving valuations still far from excessive. While the
gold stock ETFs have risen this year given the strength in the metal, at 2.0x for the
GDX and 1.7x for the GDXJ they still have a huge gap with the Tech multiples which
could contract (Figure 9). The P/B of the SIL silver ETF has remained flat at around
1.5x for most of 2024.
The COPX copper ETF P/B multiple looks especially low at just 1.2x, nearing the 1.1x
levels hit by the GDXJ in April 2024 just before it rebounded. A P/B below 1.0x is
generally considered inexpensive for companies not in significant distress. The LIT
lithium ETF has seen the largest contraction in its P/B multiple to 1.6x from 2.5x early
in 2024, as the markets finally seem to have abandoned hope of a rebound in the
metal price anytime soon. We note that COPX, SIL and LIT valuations are as of August
9, 2024, but the GDX and GDXJ valuations are from the end of July 2024, and likely
have moved since the crash.
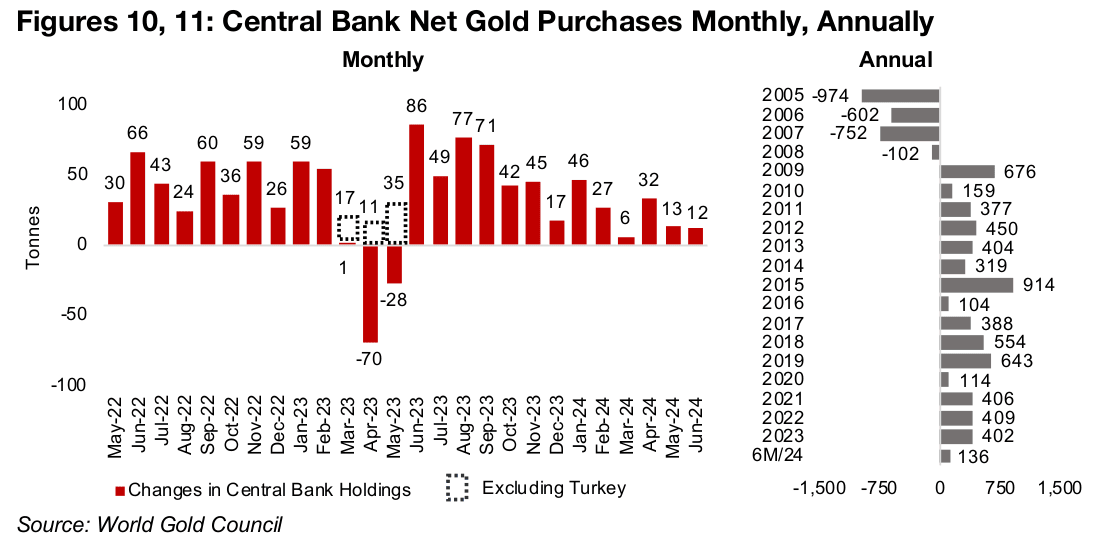
Central bank gold buying slows
Central bank net gold buying slowed considerably in May and June 2024, to 13 and
12 tonnes, respectively, after a strong start to the year, with purchases of 46, 27 and
32 tonnes in January, February and April 2024 (Figure 10). However, there was a hint
of weakness with only 6 mn tonnes bought in March 2024, the lowest since March
2022, excluding extraordinary selling by Turkey in H1/23. This brings the H1/24 total
to 136 tonnes, putting buying on a run rate for under 300 tonnes this year (Figure 11).
While this would be weaker than the past three years at just over 400 tonnes, and
below the annual average since 2009 of 421 tonnes year, it is still ahead of the fifteen-
year lows at just over 100 tonnes in 2014 and 2020. While net selling over H2/24
dragging down the H1/24 gains cannot be entirely ruled out, we do not expect large
central bank sales given that we see the probability weighted to a further rise in gold.
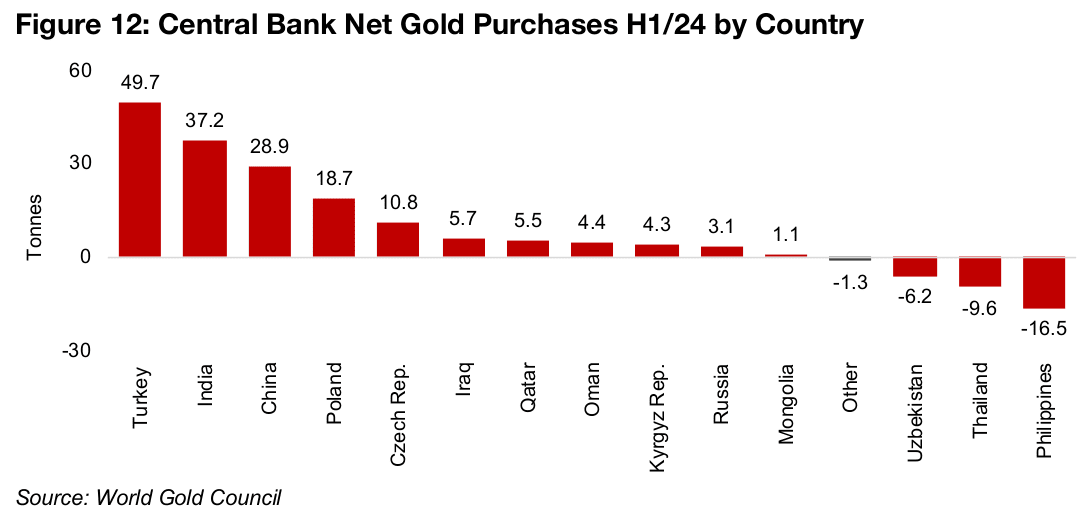
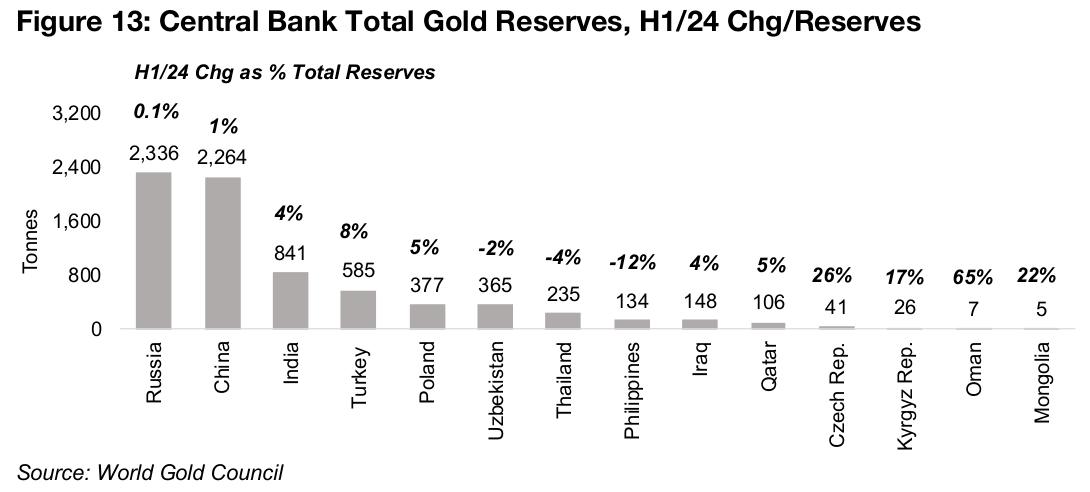
That India and China continue to be major net buyers, at 37.2 and 28.9 tonnes over
H1/24, is a good sign for the gold price, being two of the largest economies in the
world (Figure 12). However, net purchases need to be compared a country’s total
reserves to assess their relative magnitude. For China, they have been low, at 1% of
total reserves, indicating they could continue at this rate for an extended period and
only marginally add to reserves, while for India they are higher, at 4% (Figure 13).
Turkey has had the largest gold purchases over H1/24, as it continues to stabilize an
inflation-ridden financial system, at a quite high 8% of its total reserves. The
combined purchases of Poland and the Czech Republic, at 29.5 tonnes, comprising
5% of the former’s, and a huge 26% of latter’s, reserves, just surpass China’s buying.
The big net sellers have been Uzbekistan, Thailand and the Philippines, at -6.2, -9.6
and -16.5 tonnes, respectively, which is -2%, -4%, and -12% of their reserves.
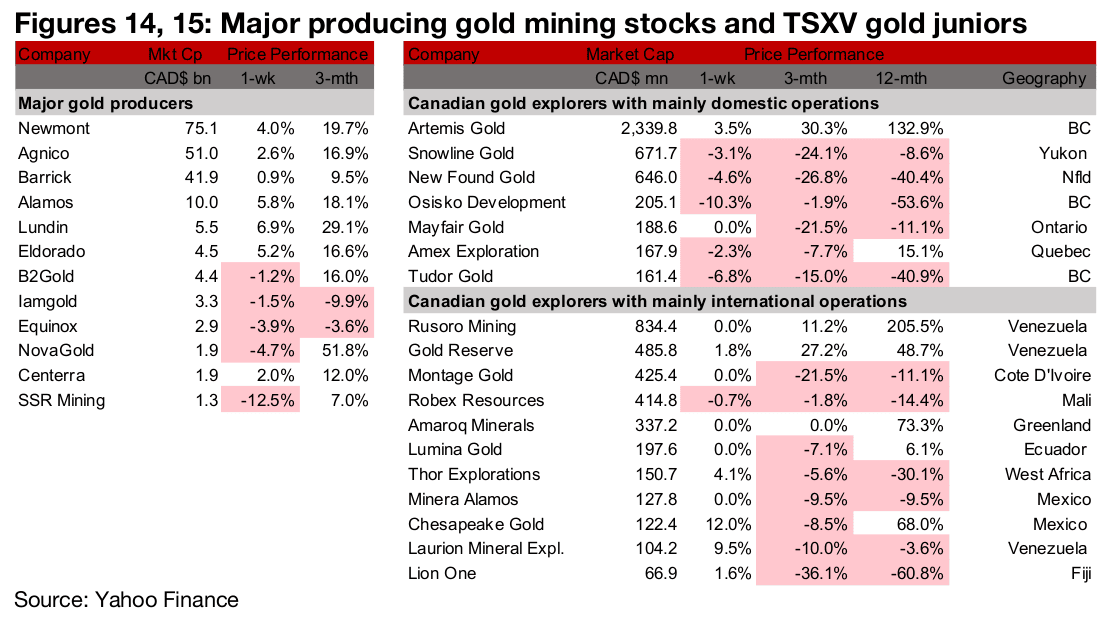
Large producers and TSXV gold mixed in crash rebound
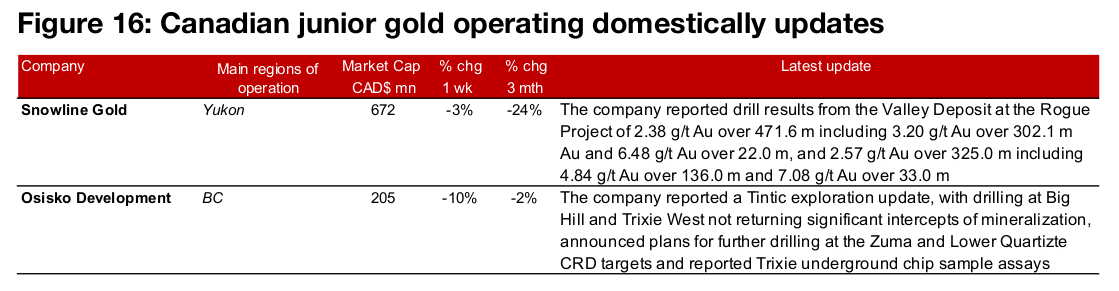
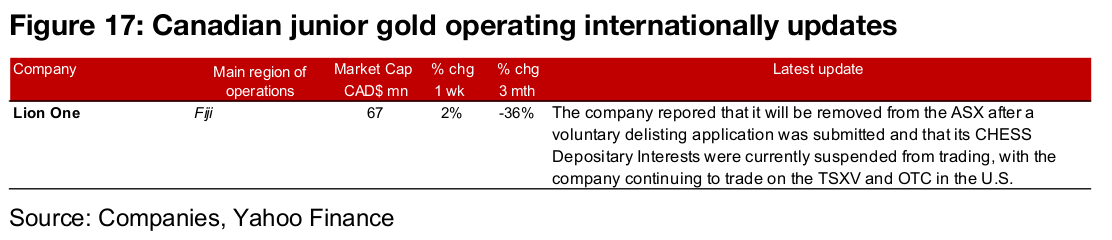
The large gold producers and the TSXV large gold were mixed as the markets crashed early in the week but then rebounded strongly (Figures 14, 15). For the TSXV gold companies operating domestically, Snowline Gold reported drill results from Rogue and Osisko Development an exploration update from Tintic (Figure 16). For the TSXV gold companies operating internationally, Lion One delisted from the ASX (Figure 17).
Disclaimer: This report is for informational use only and should not be used an alternative to the financial and legal advice of a qualified professional in business planning and investment. We do not represent that forecasts in this report will lead to a specific outcome or result, and are not liable in the event of any business action taken in whole or in part as a result of the contents of this report.