April 07, 2025
Crash Resistant Gold
Author - Ben McGregor
Gold price holds up in market crash
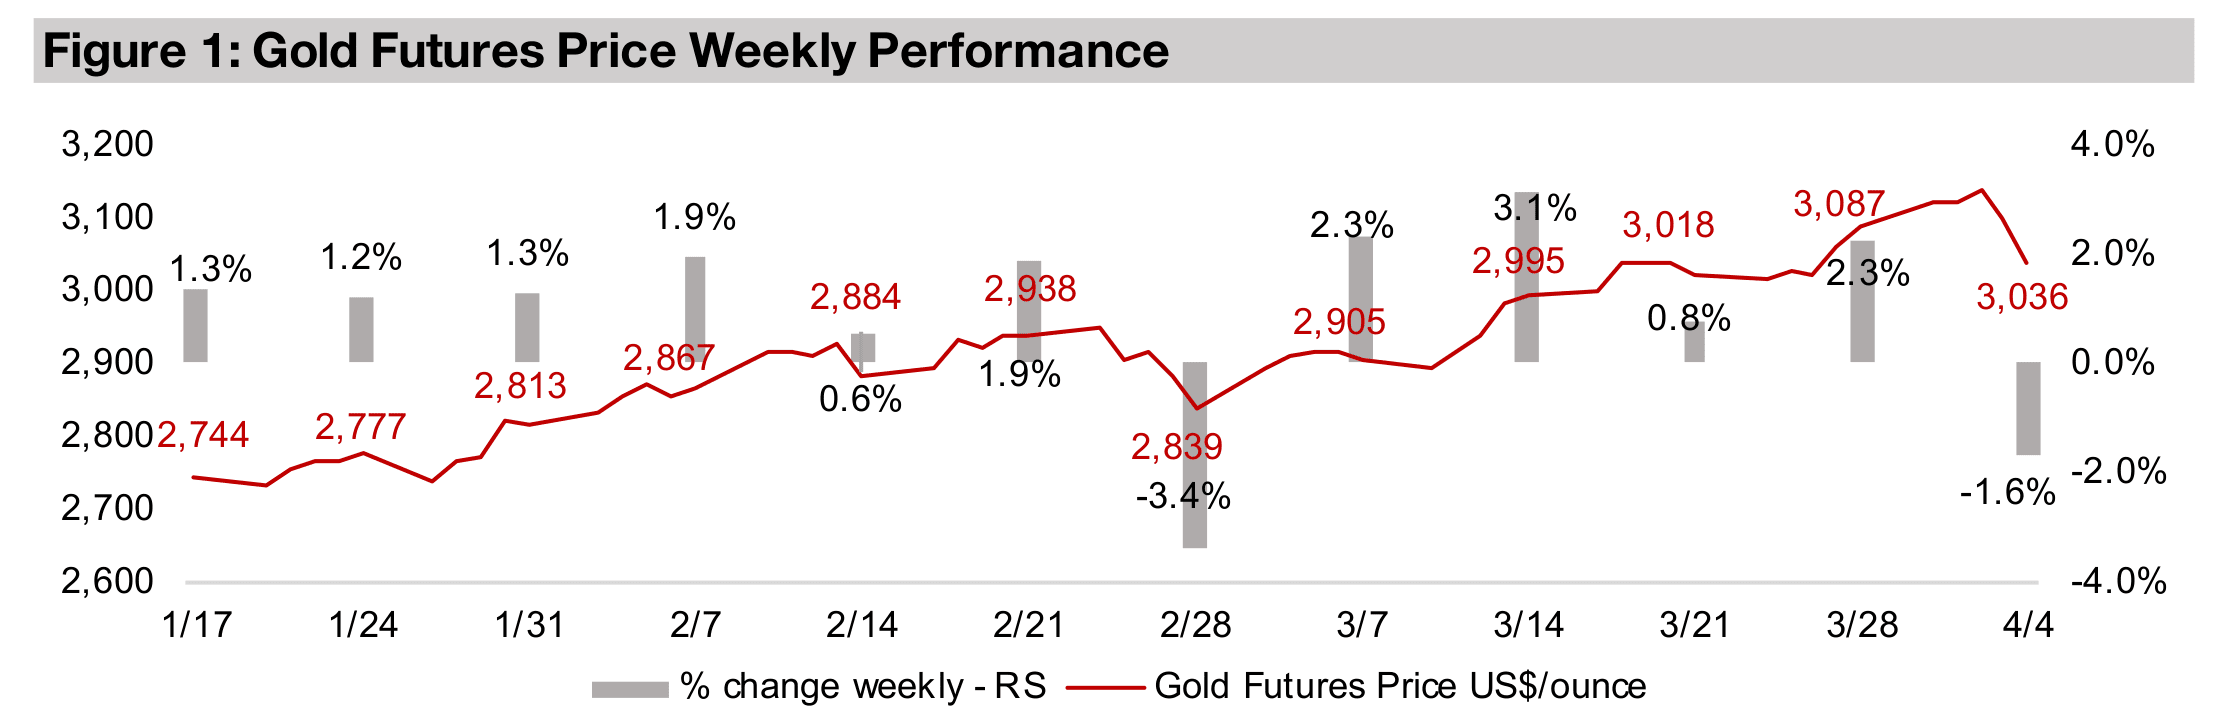
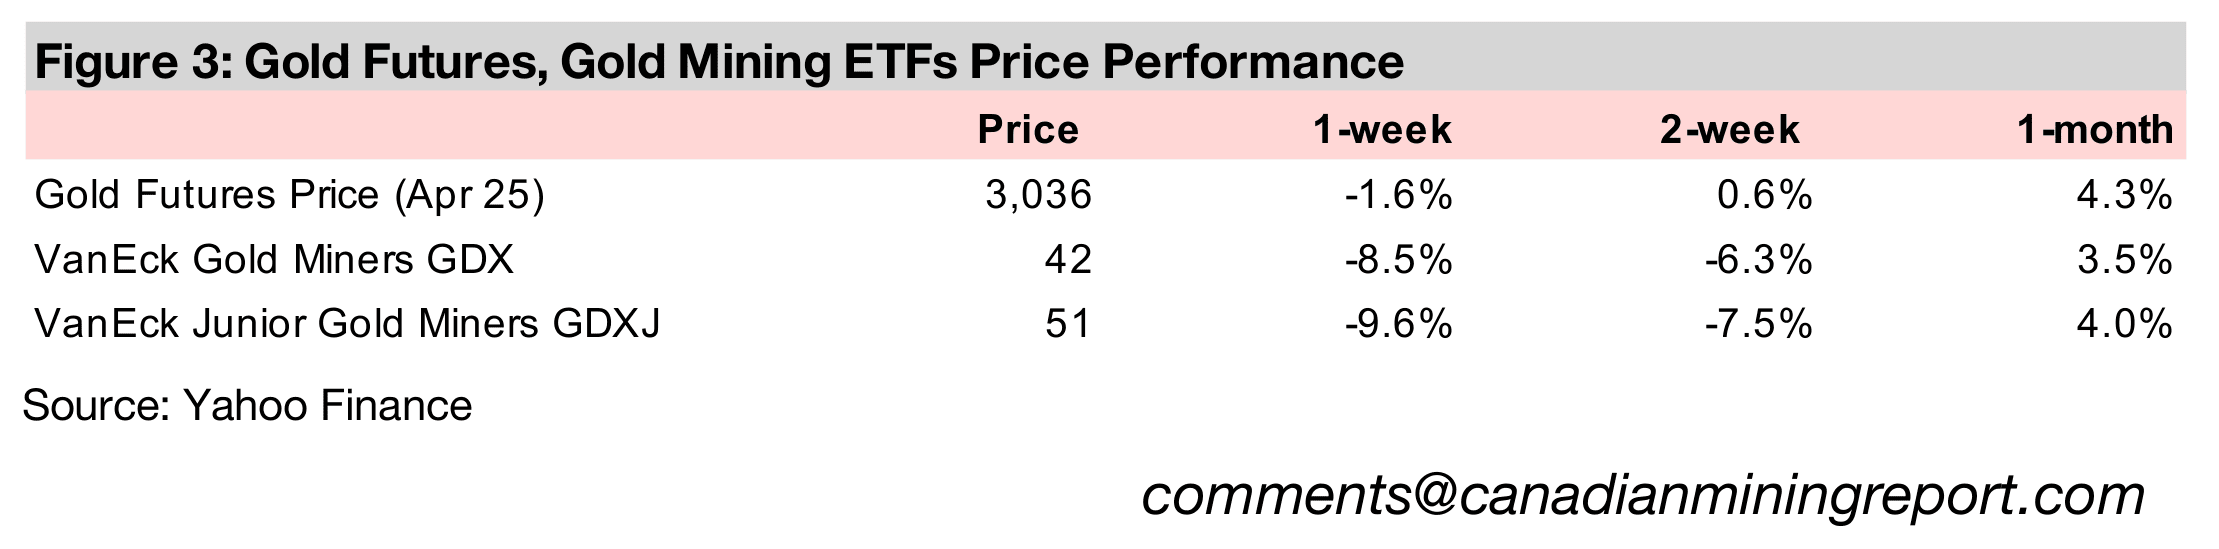
The gold price declined just -1.6% to US$3,036/oz, an outstanding performance in a week where many metals and several major equity indices crashed by over -5.0% as the latest US tariffs and the global reaction to them sent markets into a freefall.
Gold stocks succumb only on second day of plunge
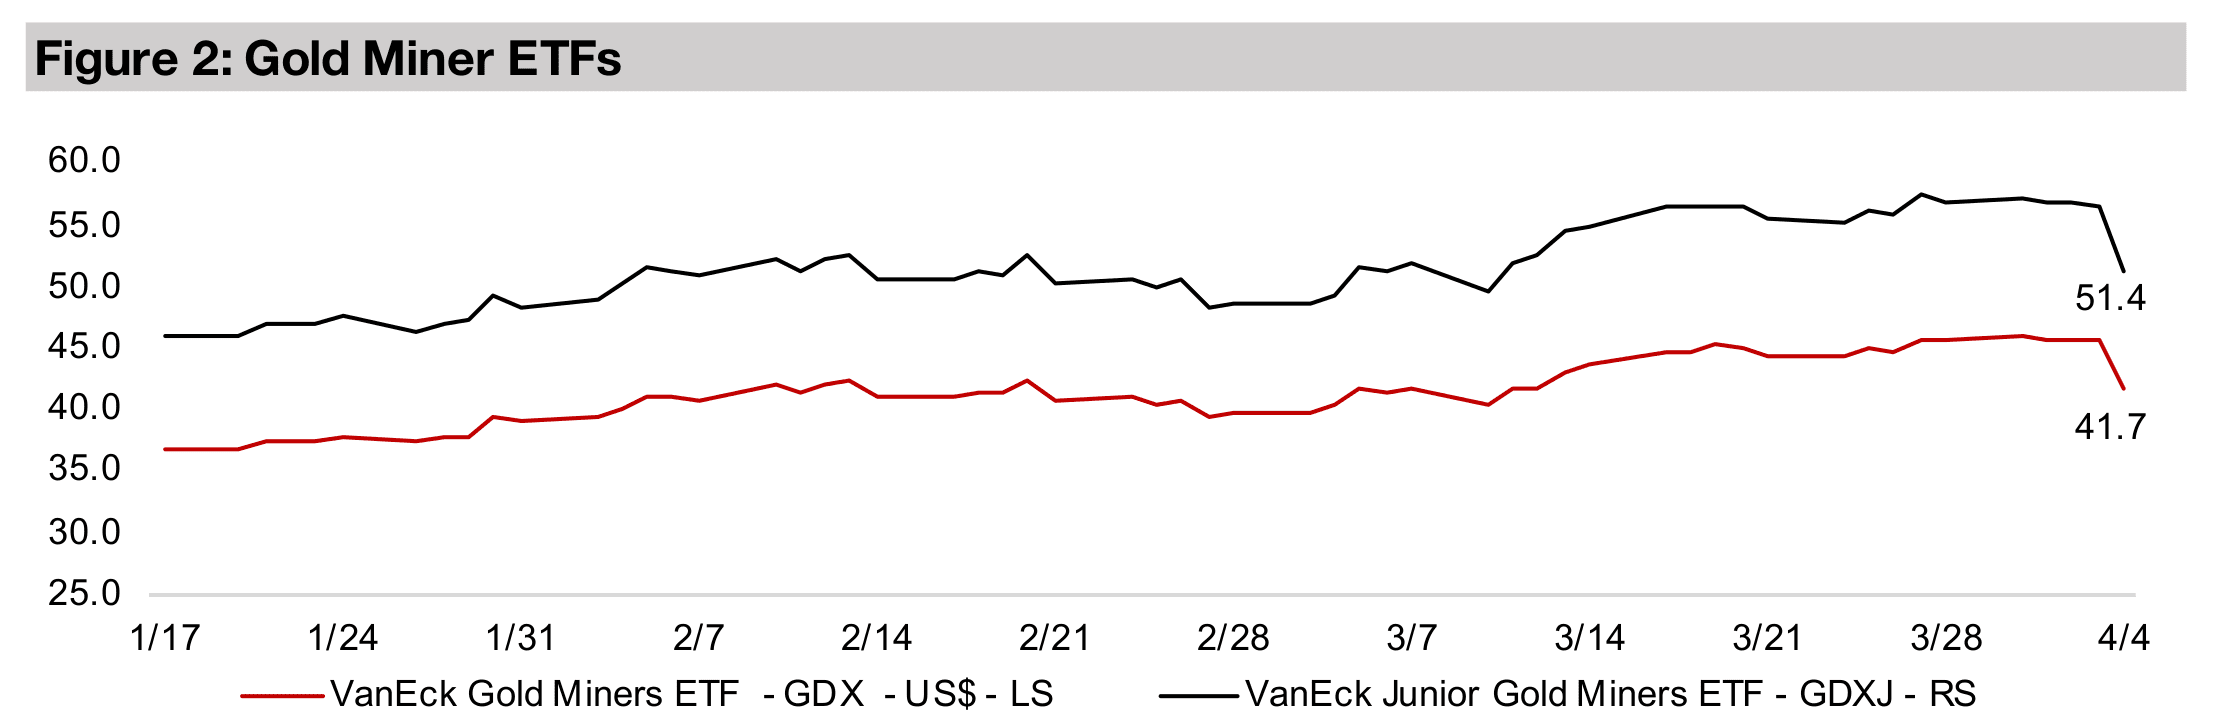
While gold stocks slumped with the GDX off -8.5% and GDX down -9.6%, they held flat on the first day of the crash before declining on the second day, and while underperforming the S&P 500’s -8.2% drop, they are far ahead of the index YTD.


Crash Resistant Gold
Gold declined -1.6% to US$3,036/oz, which was an exceptional outperformance
given the violent market crash which saw slumps of over -5.0% for many major metals
and most major markets. The S&P was off -8.2%, driven especially by a decline in
tech, the Nasdaq down -8.5%, and there was a similar drop in small caps, with the
Russell 2000 down -8.6%, on a severe risk off move by markets. This was driven
mainly by the unveiling of another round of major US tariffs and a strong retaliatory
response globally, including a major increase in tariffs by China.
Icon and logotype combination
While the crash seems sudden it was really just part of a broader shift towards risk
aversion ongoing for some time put into significant overdrive. Markets had paused
by March 21, 2025 and started to weaken, and there were signs of increasing hedging
as early as mid-2024 which increased towards the year’s end, indicating any bull
market was losing steam. While the peak for the S&P 500 came on February 15, 2025,
the tops for the Nasdaq and Russell 2000 were much earlier on December 16, 2024
and November 29, 2024. While the ‘Big Bang’ this week likely heralded the official
start of an extended bear market, there had been a long buildup of caution before
tech-mageddon and tariff-mageddon catalyzed the collapse.
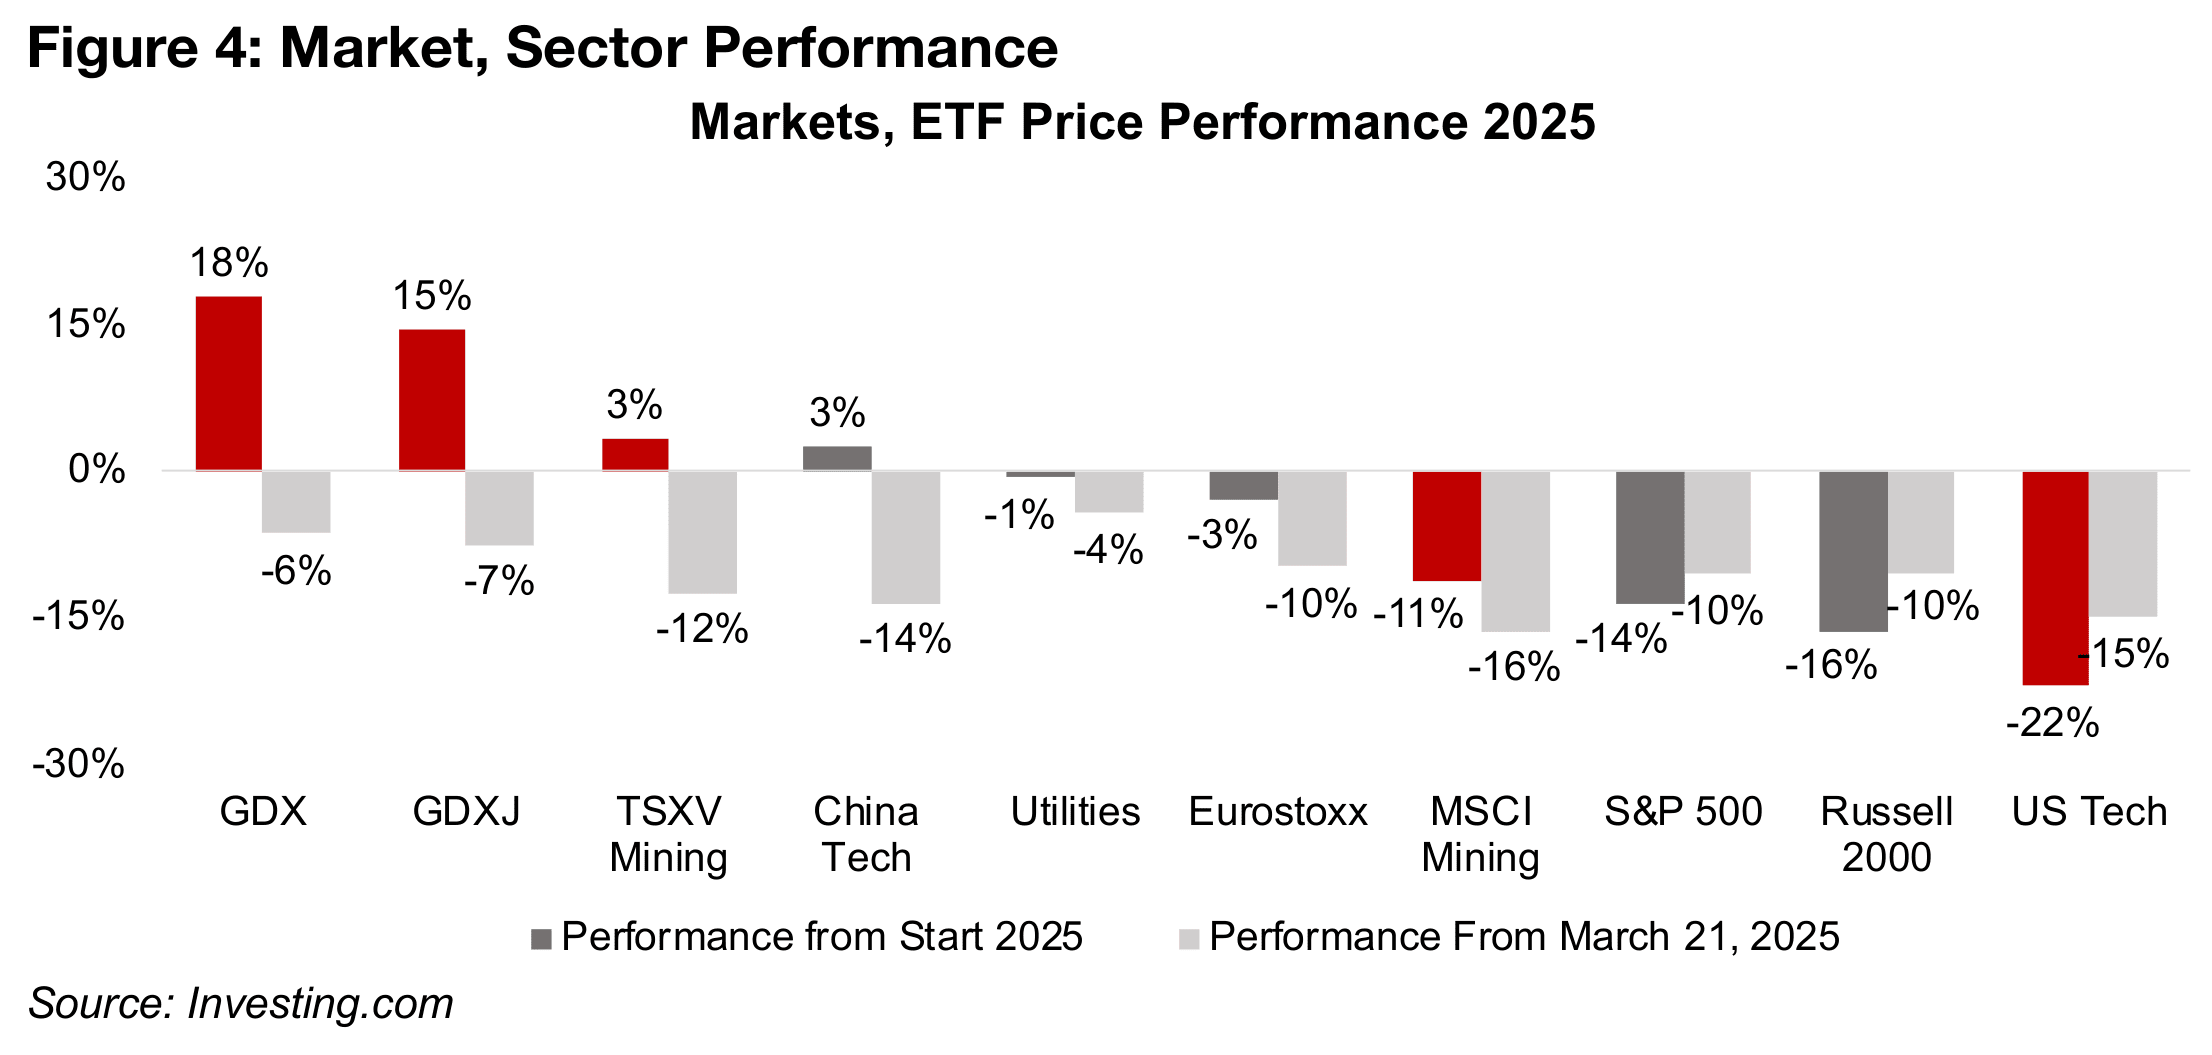
A slump in tech was a main driver of the decline, especially given what a large
proportion of global markets it had become, with the sector in the US down -22%
YTD and -15% since March 21, 2025 (Figure 4). China tech reversed most of its big
gains this year from the announcement of advances in AI, losing -14% this week, and
is up just 3% YTD. Europe has outperformed in 2025, down just -3% after the -10%
slide since March 21, 2025, versus -10% drops in the S&P 500 and the Russell 2000
over the past two weeks, and losses of -14% and -16% YTD, respectively, with the
latter lower given the higher risk of small caps.
Gold stocks hold up for first day of crash before cratering
For the broader mining indices, while TSXV Mining slumped -12% this week, it
remains up 3% for the year, beating most major global markets, supported by its
heavy weighting to gold stocks, offset somewhat by a high proportion of copper and
lithium stocks which will have been a drag on the performance. It far outperformed
the MSCI Metals and Mining, which is heavily geared to iron ore, which was already
weak YTD, and copper and aluminum, which saw major reversals this week.
While gold stocks took a major hit, with the GDX down -8.4% and -9.6%, they
interestingly held up flat for the first day of the crash, with the GDX barely moving
even as gold edged down 1% (Figure 5). The GDX and GDXJ are also only down -6%
and -7%, respectively, since March 21, 2025, as they had continued up on the rising
gold price in the two weeks before the crash even as other assets had started to falter.
Both the GDX and GDXJ are still far outperforming major markets and sectors, up 18%
and 15% YTD. However, these robust gains may have worked against them, causing
the drop on the second day of the crash. This is when panic really took hold and may
have driven a sell off even of safe-haven assets, especially those with large gains, to
lock in profits and potentially cover leveraged losses in other assets.

Gold still far outperforming other metals this year
Gold has been by far the strongest performing metal this year, with its move this week not outside of typical volatility, and the metal flat since March 21, 2025 and up 16% YTD (Figure 6). The big question now is which force dominates, the pressure upward from a move into safe haven assets, or downward from forced selling of strong gainers to cover losses in other assets. While the latter is a possibility, and caused a drop at the start of the global financial crisis of 2008-2009 and health crisis in 2020, we still see the probability weighted towards gold continuing to be crash resistant.
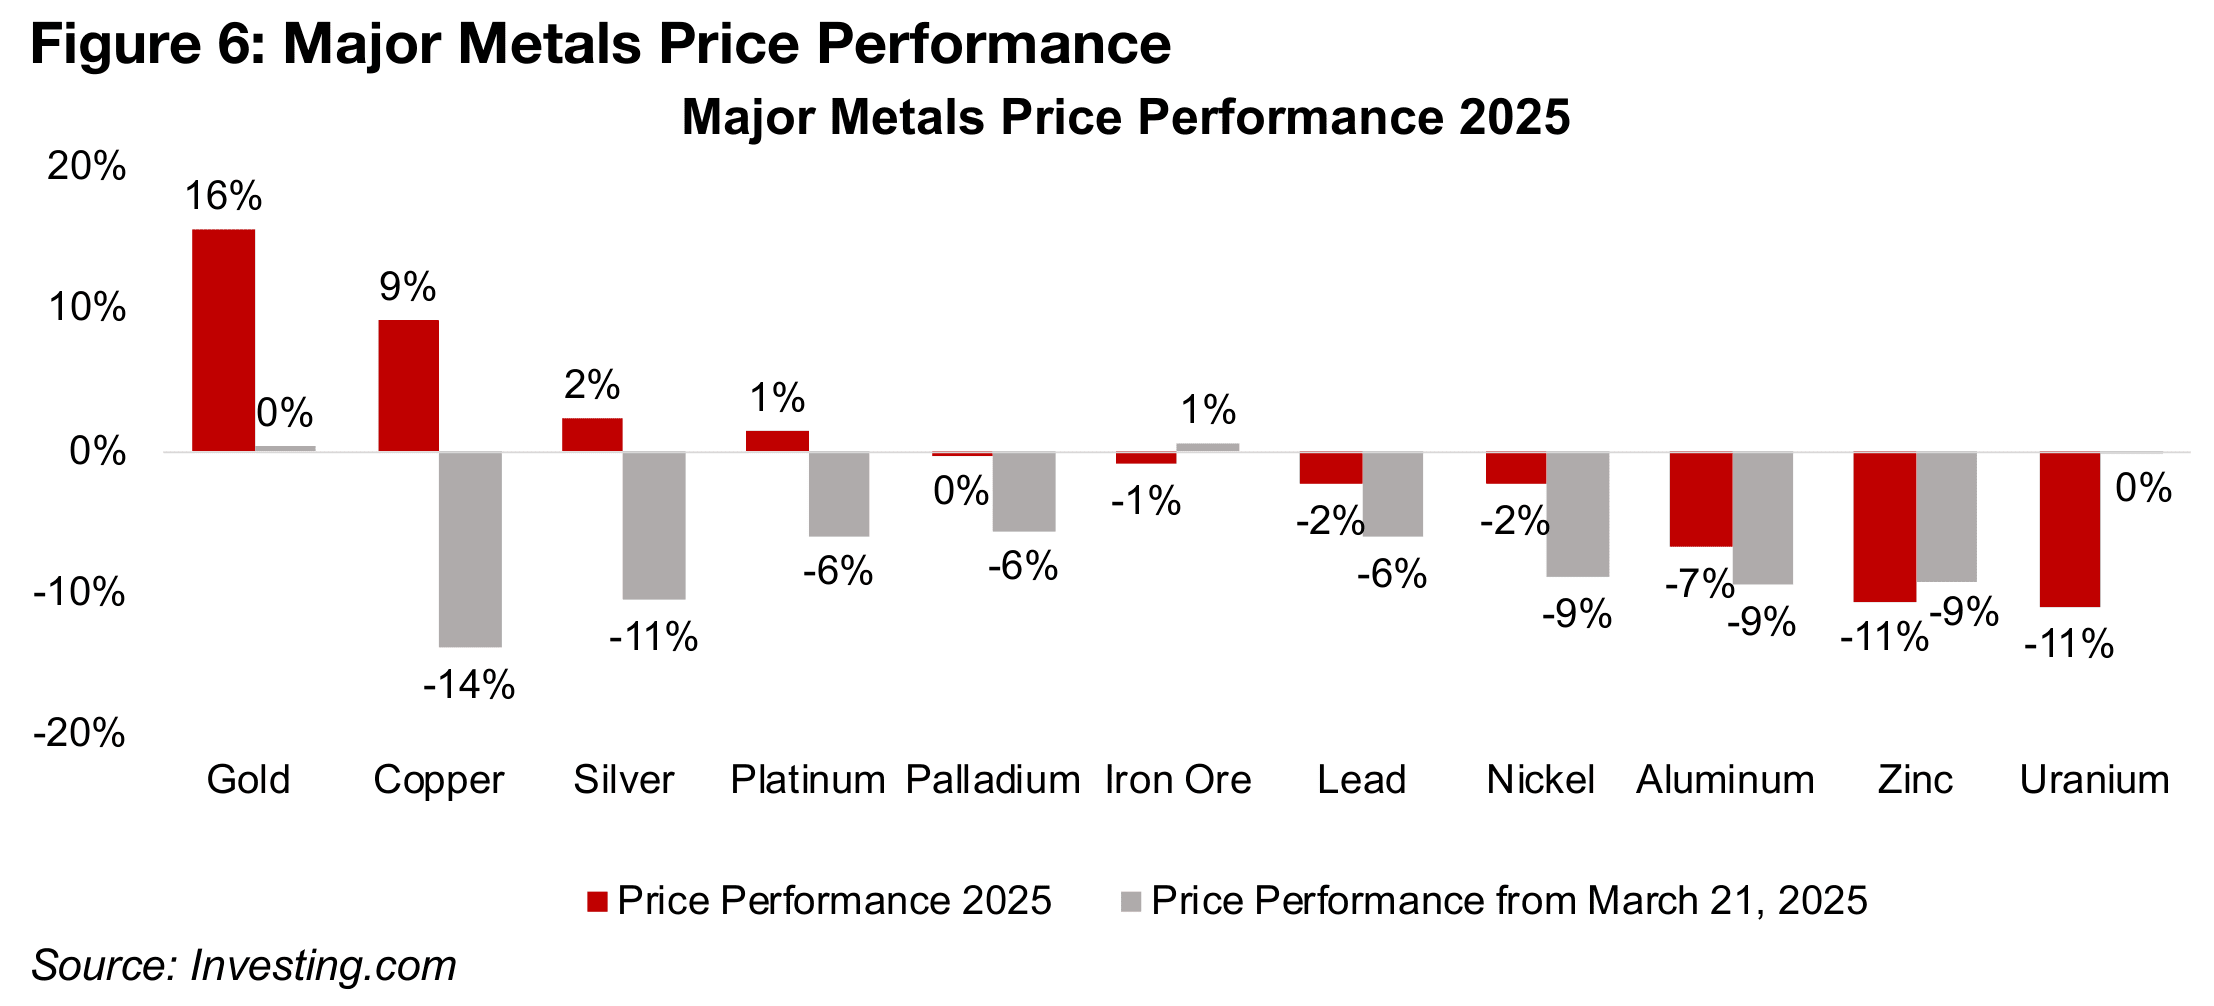
Copper took the biggest hit of the major metals by far, down -14% since March 21,
2025. This ended a run where it had just moved ahead of its previous May 2024 highs,
before slumping back down to near the average of the past year, although it is still up
9% for the year. Silver and nickel also saw big declines, down -11% and -9%, and
platinum, palladium and lead, more moderate ones, all down -6%, although all of
these metals are still near flat year to date.
Iron ore was an interesting standout, up 1% during the crash and down just -1% YTD,
seemingly because its slump had been so extended and severe over the past year as
to have already incorporated what the market suddenly priced into other metals this
week. The metal especially reflects growth prospects in China, which the market is
apparently viewing as quite neutral given the lack of major moves this year.
Aluminum and zinc both declined -9% and have seen major falls this year of -7% and
-11%, respectively, and while uranium is also down -11% YTD, it has held flat since
in the crash. The declines in copper and aluminum, which are two of the largest
metals markets and proxies for overall economic demand, seem to indicate that the
market is pricing in a decline in global demand from the tariff war.
Current bear market more ‘standard’ than three previous major declines
The current bear market has been quite a ‘standard’ textbook crash, with a gradual
move away from risk over time, including a shift into more defensive sectors and
move out of highly cyclical ones. The riskiest group of companies, the small caps,
where the first to peak and start to decline, followed by the tech sector, which is only
moderately cyclical but also had very high valuations versus other sectors. Broad
moves towards risk aversion had been occurring as early as mid-2024, where safe
havens had temporarily overtaken tech, but it had repeatedly regained the upper hand
before its final capitulation in H2/24.
The selling over the past two weeks has now shifted to encompass most of the
market, including well established lower risk blue chips, with only a few very defensive
sectors actually seeing gains, which is typical in a major bear market. So the shock
this week has actually just been an exacerbation of an already ongoing move out of
risk which had been developing for quite some time.
This slump is very different especially from the three previous crises, which were quite
‘non-standard’, the dotcom bust in 2000, the GFC in 2008-2009 and the global health
crisis in 2020. While the current decline has quite a clear trigger in the form of new
tariffs, the previous declines were more of a shock to markets. There had also been
the negative driver of a disproportionately large tech sector with elevated valuations,
which was well known to markets, and bound to eventually reverse.
The GFC was almost entirely precipitated by a wildly overvalued and overleveraged
US housing sector, especially in the subprime segment, the fallout from which spilled
out to the global economy. Interestingly in the current crisis the valuations of the real
estate ETFs are quite muted versus other sectors. The causes of the decline during
the global health crisis was obviously completely apart from any standard economic
crisis. This allowed for a huge policy response and abrupt market rebound, driven by
a surge in tech sector given a global population largely stuck inside, and to some
degree set up the elevated valuations that are part of the current problem.
While the dotcom bust has parallels with the current crash, a major difference is that
the companies now driving tech are well established with strong earnings. In the
dotcom bust, many companies had zero value, with flimsy business models and no
revenue. This could see the current tech slump have more of a floor under it than the
dotcom bust, as megacap tech may be overvalued, but is certainly not valueless.
Crash driven by tech and highly cyclical sectors
Global tech has been the major driver of the crash, collapsing -14% since March 21,
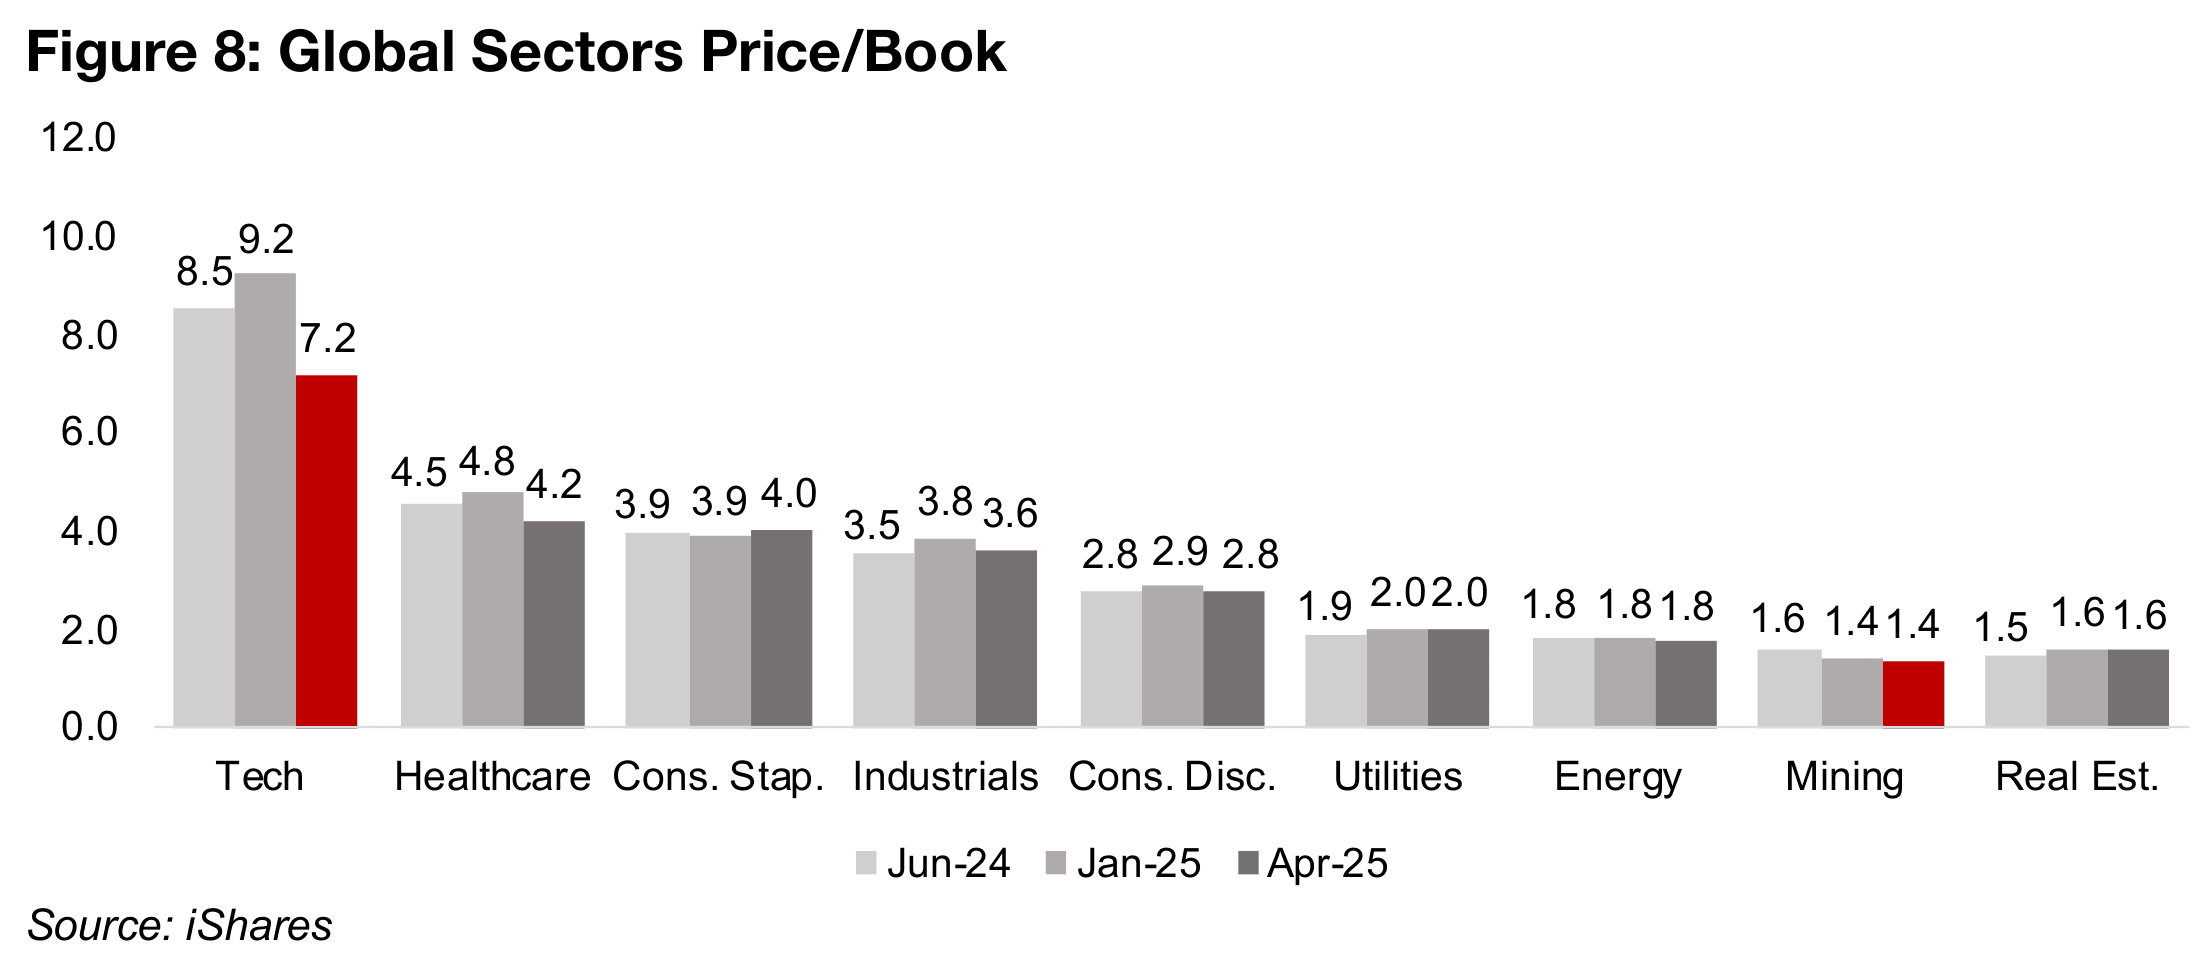
2025, and down -8% year to date (Figure 7). It is the only sector where there has been
a severe drop in valuations, to a price to book (P/B) of 7.2x, from 9.2x at the start of
2025 (Figure 8). While the sector’s elevated multiples versus other sectors are partly
supported by higher earnings growth, if a recession develops and tech earnings start
to miss still relatively high market expectations, there seems to be room for the
multiple to converge towards the rest of the market.
Two other highly cyclical sectors also saw a major pullback, consumer discretionary
and industrials, down -10% and -5%, respectively, over the past two weeks. However,
their P/B multiples are much more moderate than tech and have only ticked down in
the crash. While telecoms is usually considered a defensive sector, it fell -6% in the
crash, although it has held up YTD with only a -1% decline.
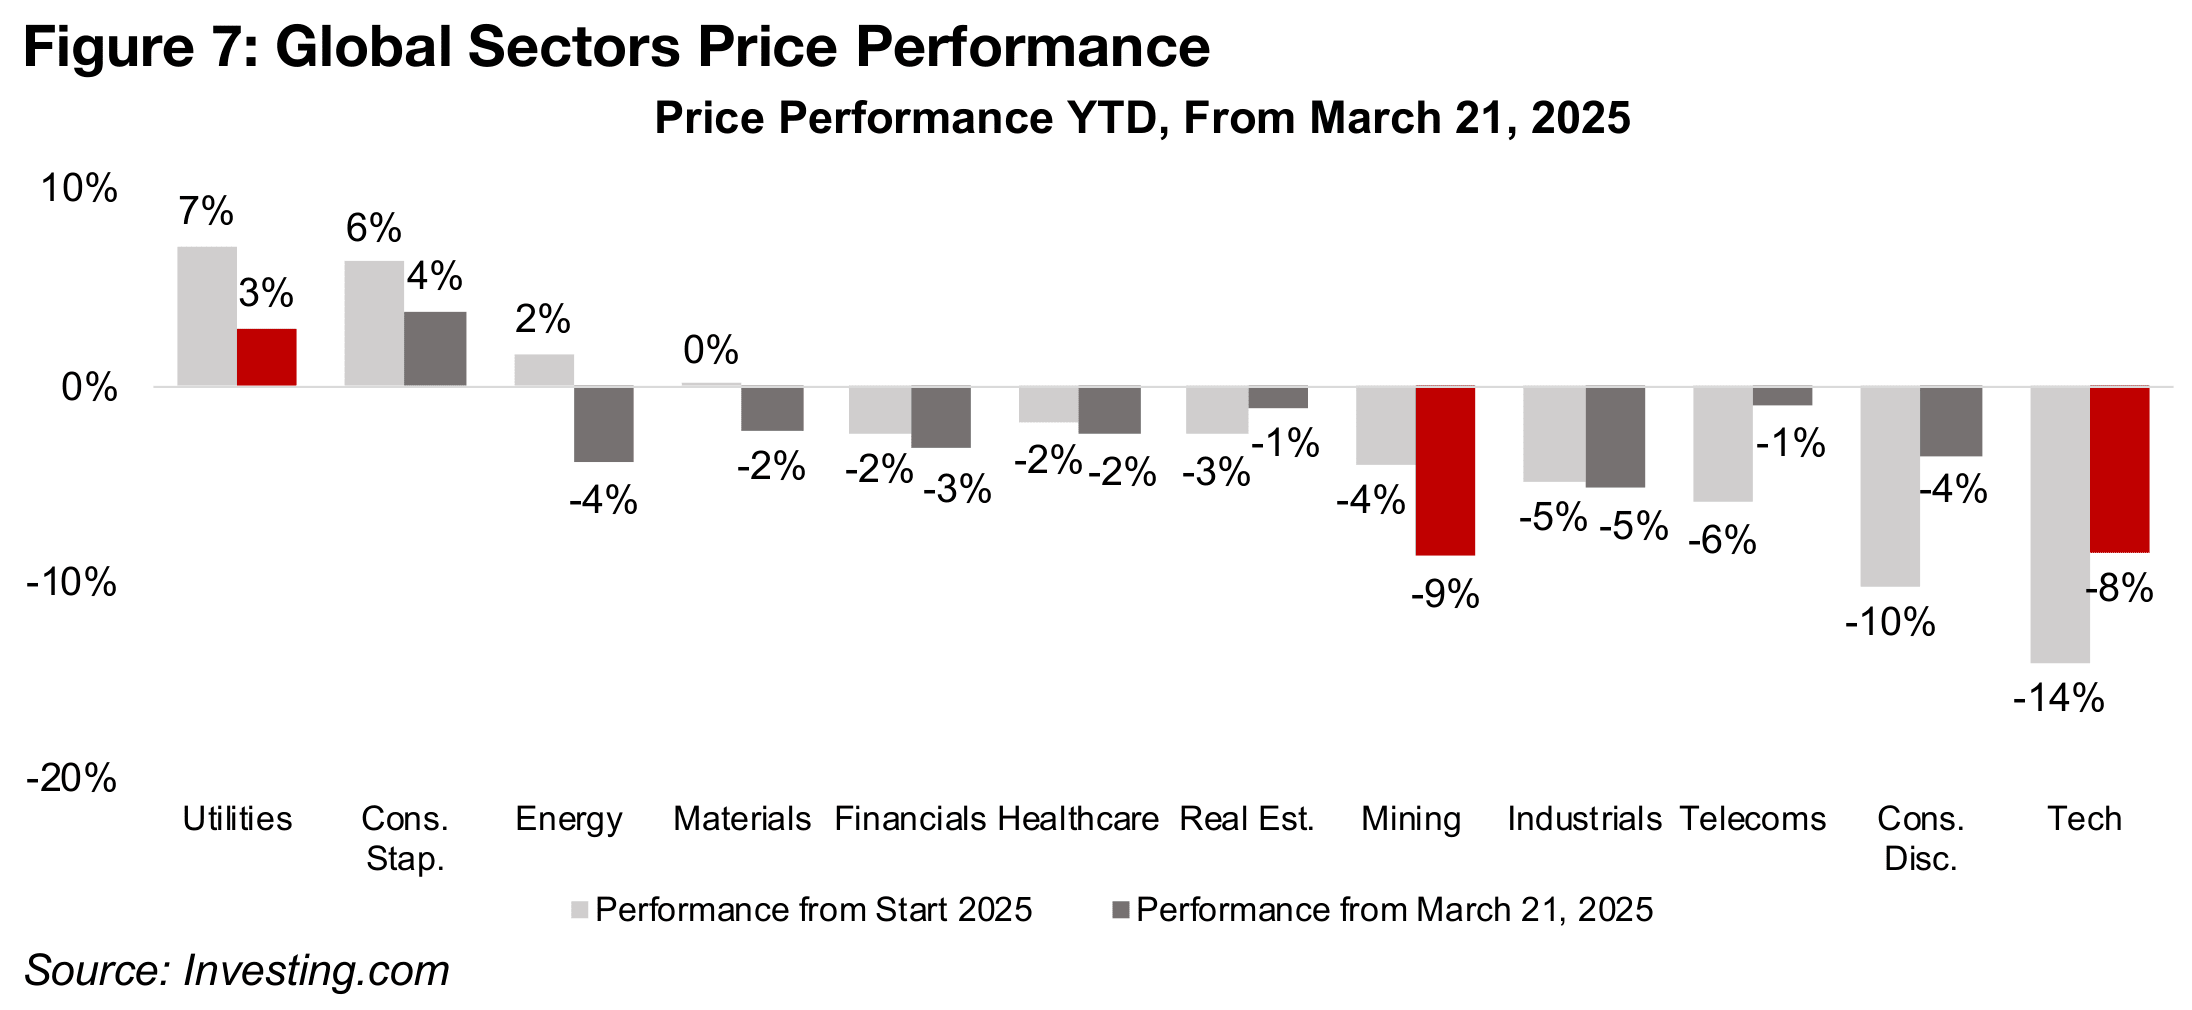
The highly defensive sectors have strongly outperformed, as would be expected in a
standard bear market, with utilities up 7% since March 21, 2025, and 3% YTD, and
consumer staples up 6% and 4% over the same two periods. Financials, healthcare
and real estate all have had only slight declines in the crash and year to date, and the
cyclical energy sector is actually up over the past two weeks, although down for 2025.
While the materials sector is cyclical, it has been flat in the crash and down just -2%
YTD, but its global mining subsector dropped 4% over the past two weeks and has
had the weakest performance of the major sectors YTD, down -9%. This is because
it has a high weighting of companies with a large proportion of earnings from copper
and aluminum, which plunged in the crash, and iron ore, which has been flat, and a
lower weighting to the gold stocks.
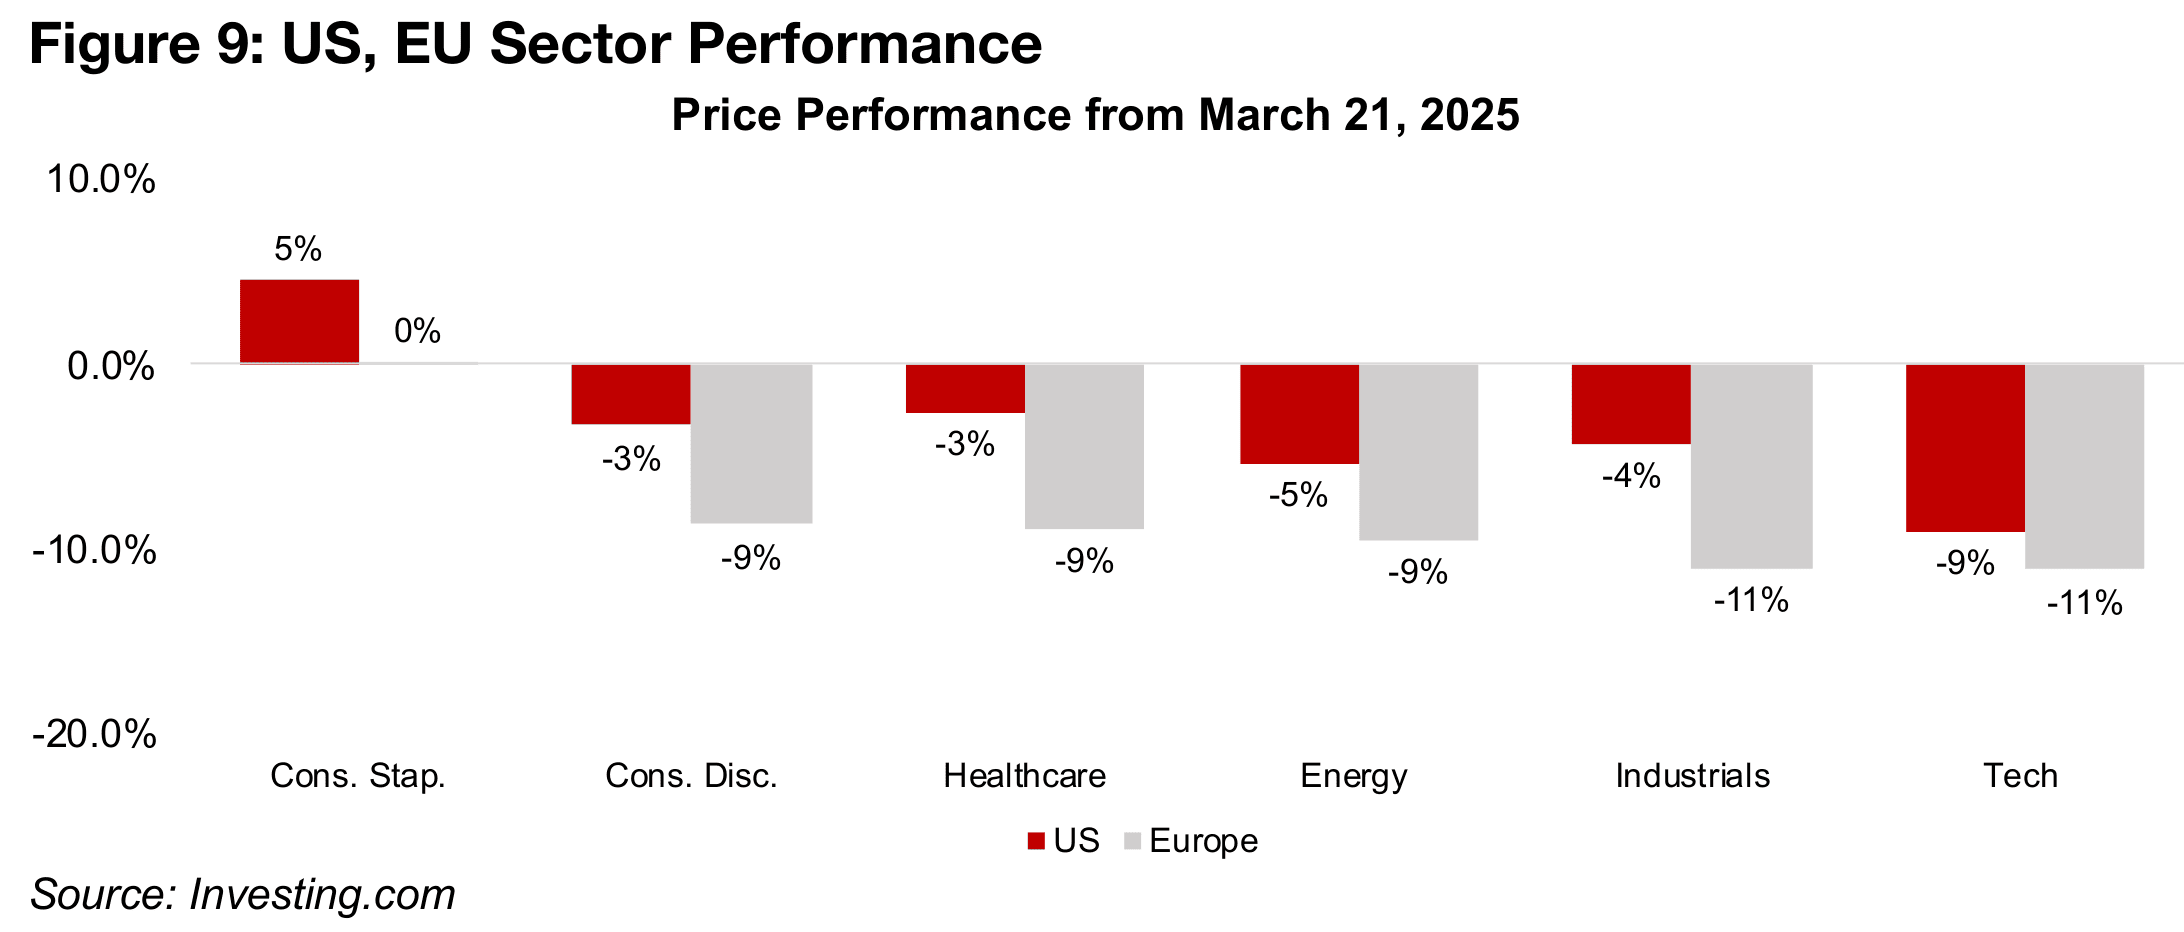
Sector ETFs in the US and EU show how the crash has been similar between the two
regions. There has been an outperformance of the defensive consumer staples sector
for both regions, up in the US 5% since March 21, 2025, and flat in the EU (Figure 9).
The tech sector has had the worst performance by far for both, down -9.0% for the
US and -11% for the EU, followed by other heavily cyclical sectors, the industrials,
down -4 and 11%, and energy, down -5% and 9%.
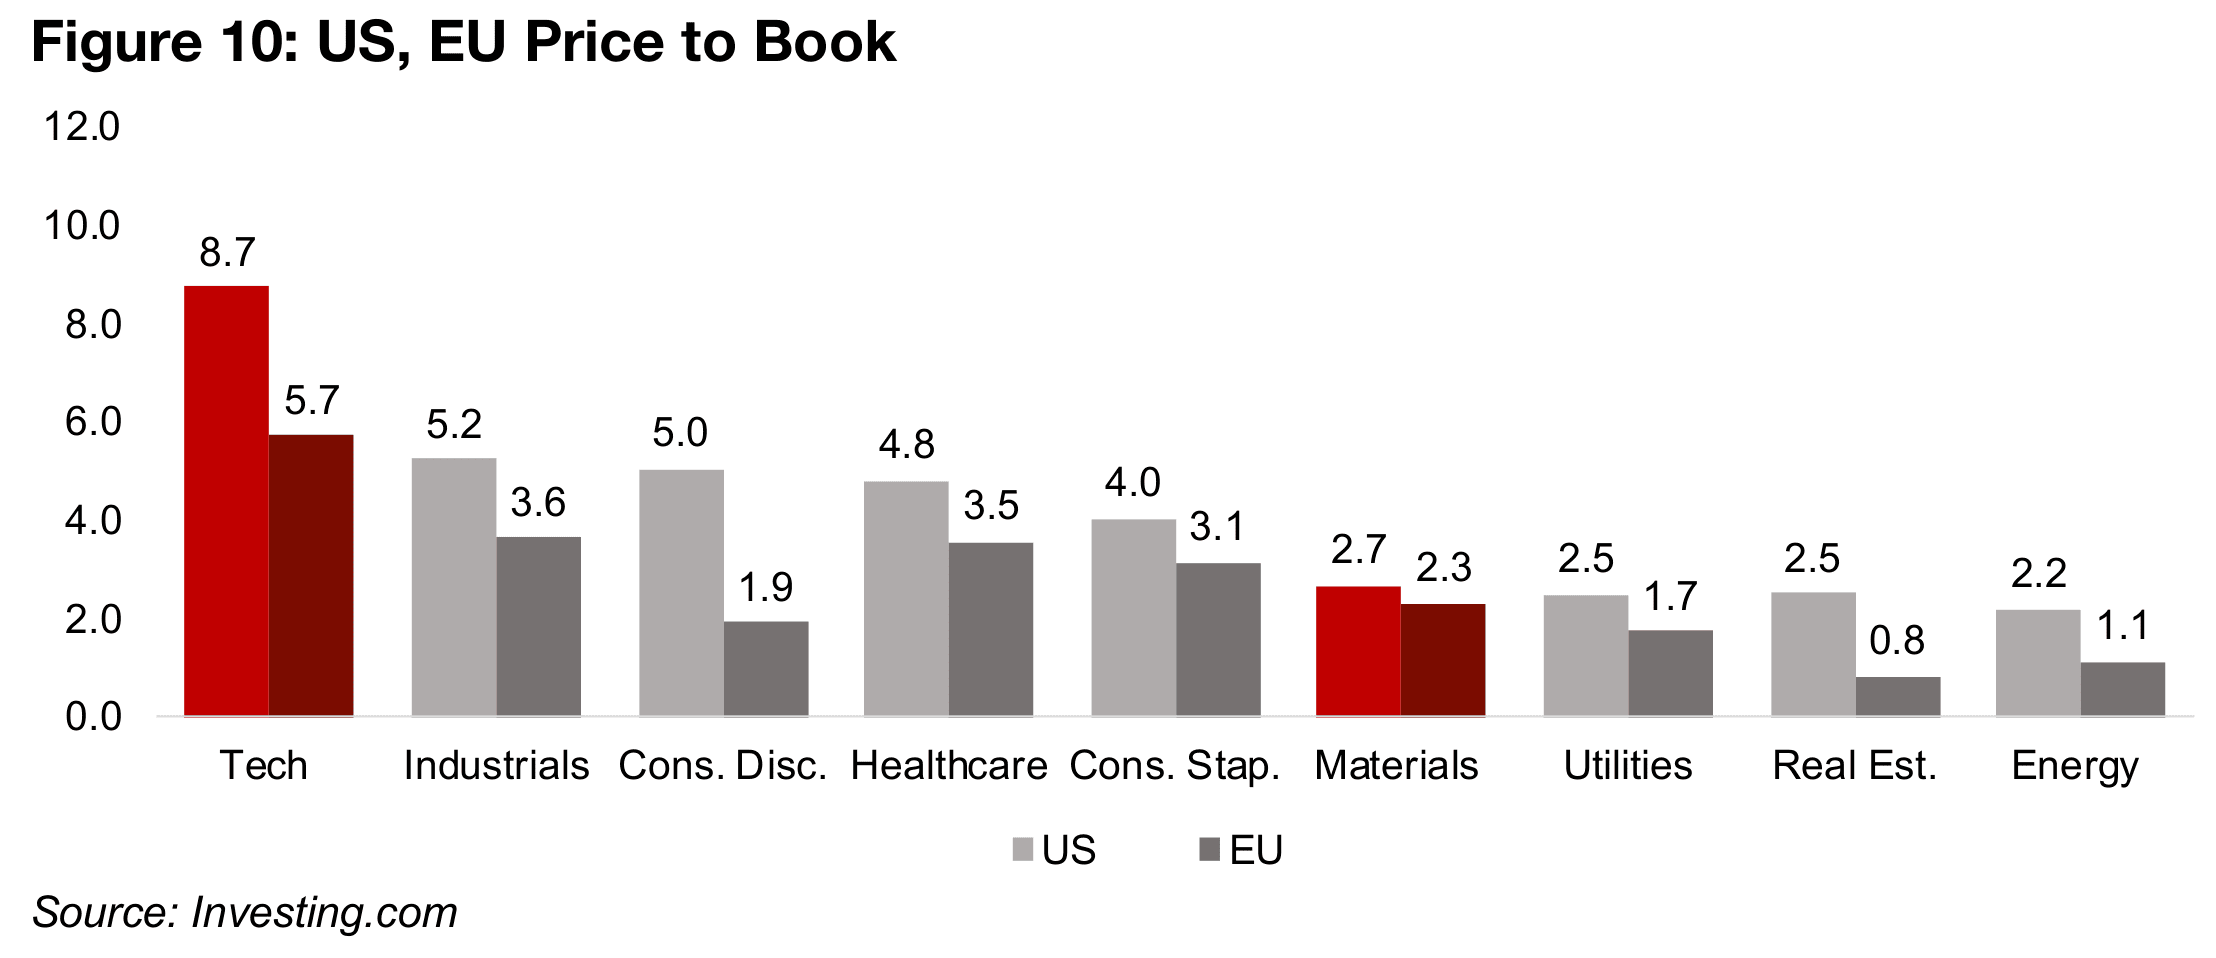
Tech valuations in both the US and the EU remain far higher than other sectors and
a continued convergence towards the rest of the market could drive further market
decline, with the gap historically not this wide, and only becoming severe in the past
five years (Figure 10). The high industrial sector multiples are also a concern as if
markets continue to shift out of more cyclical sectors, it could further pull down
markets beyond just tech. While multiples for consumer discretionary, another highly
cyclical sector, are elevated in the US, they are more muted in Europe.
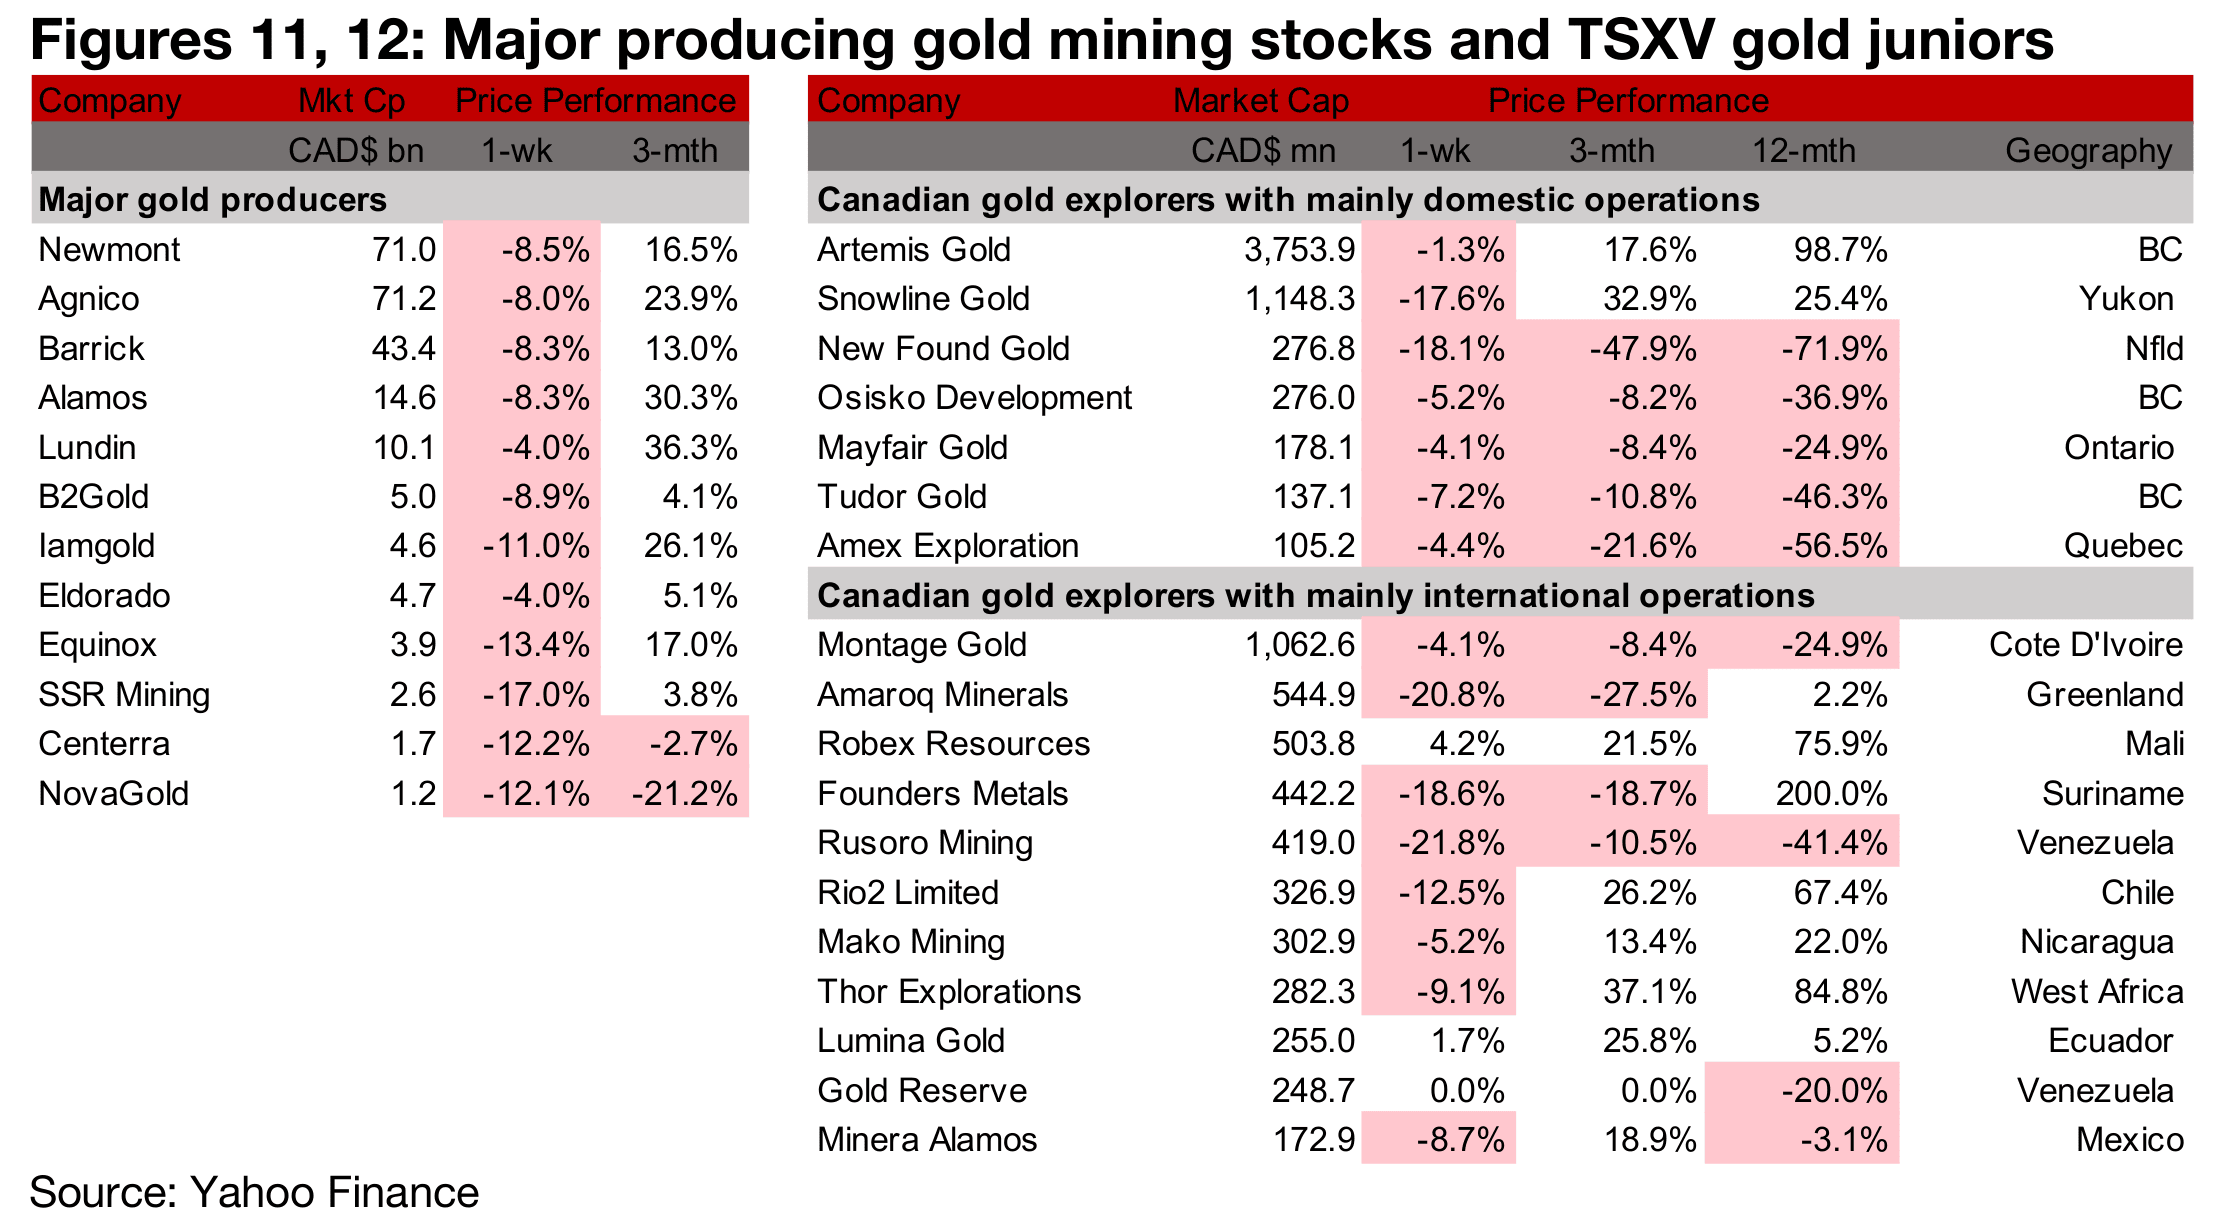
All major producers and most large TSXV gold slump
All of the major gold producers slumped by –8.0% or more with the exception of
Lundin and Eldorado, both down 4.0% (Figures 11, 12). While nearly all of TSXV large
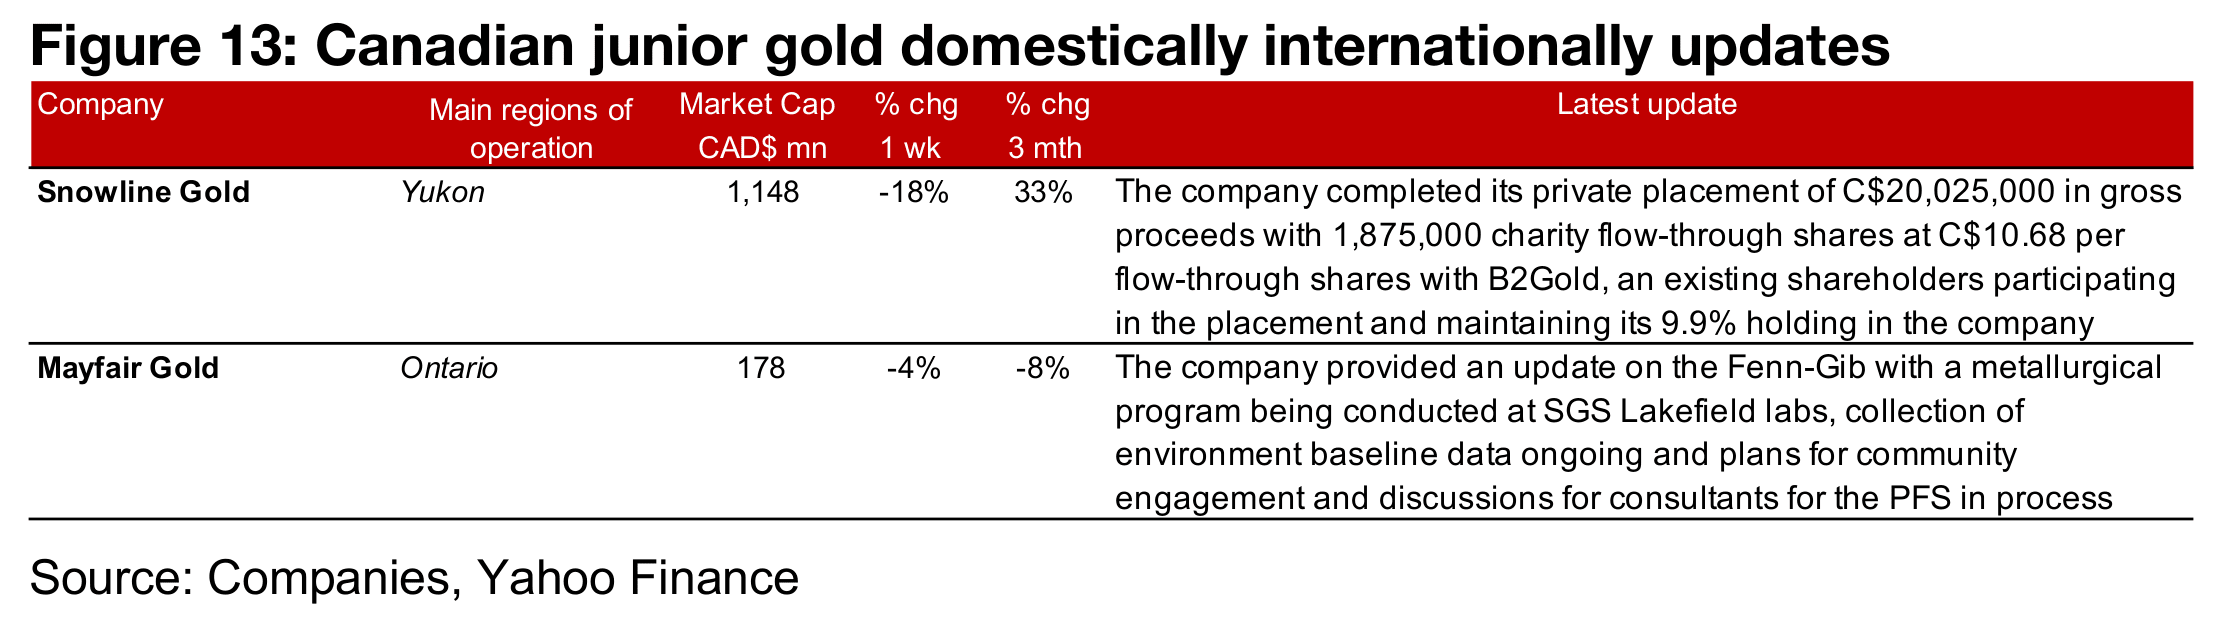
gold declined, there were wide differences in the degrees of weakness (Figure 13).
There was significant news flow only on two of the large gold stocks, with both
operating domestically, Snowline Gold, which closed a C$20.0mn private placement,
and Mayfair Gold, that provided an update on its Fenn-Gibb project.
There seems to have been some respite for the TSXV gold producers this week, which
have a much lower level of risk than the average junior on the index given that they
already generate cash flow. Artemis Gold, which recently reached first gold pour for
its huge Blackwater project, was down just -1.3%, and Robex Resources was up
4.2%, the biggest gain for the group. While producer Thor Explorations did see a
major -9.1% decline, this could have been more because of a conflict with Osun State
in Nigeria over its Segilola mine, and its shares are still up 85% over the past year.
Some of the biggest decliners were companies at the initial resource estimate stage
or earlier, that have had strong runs up in their share prices in recent years which
drove up their valuations, including Snowline Gold, New Found Gold, Founders
Metals and Amaroq Minerals. Markets are likely pulling back from these companies
on concerns that they have a long process of development ahead of them before
reaching production and cash flow and securing financing may be more difficult with
the outlook for markets deteriorating substantially over the past two weeks.
Disclaimer: This report is for informational use only and should not be used an alternative to the financial and legal advice of a qualified professional in business planning and investment. We do not represent that forecasts in this report will lead to a specific outcome or result, and are not liable in the event of any business action taken in whole or in part as a result of the contents of this report.