
October 07, 2024
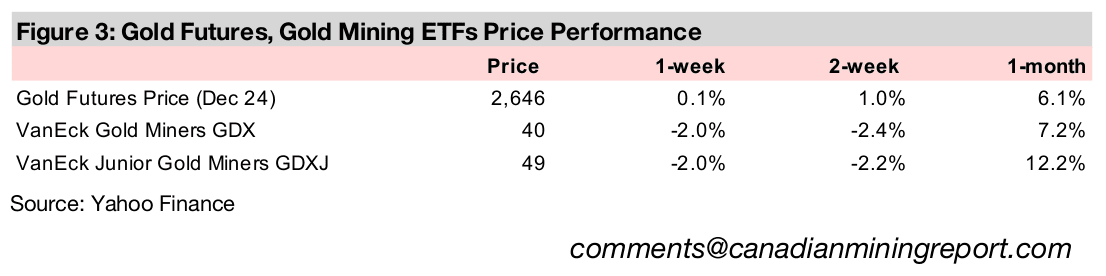
Gold was near flat, up 0.1% to US$2,646/oz, pausing after around a US$150/oz jump in just a month, while some major base metals including iron ore and aluminum continued to rise for a second week following China’s major stimulus measures.
The copper outlook for 2025 remains mixed, with the ICSG looking for a surplus next year but the AOCE a slight deficit and a 4.2% rise in the gold price, while WB’s near flat forecast for the copper price is from April and could shift in its update this month.
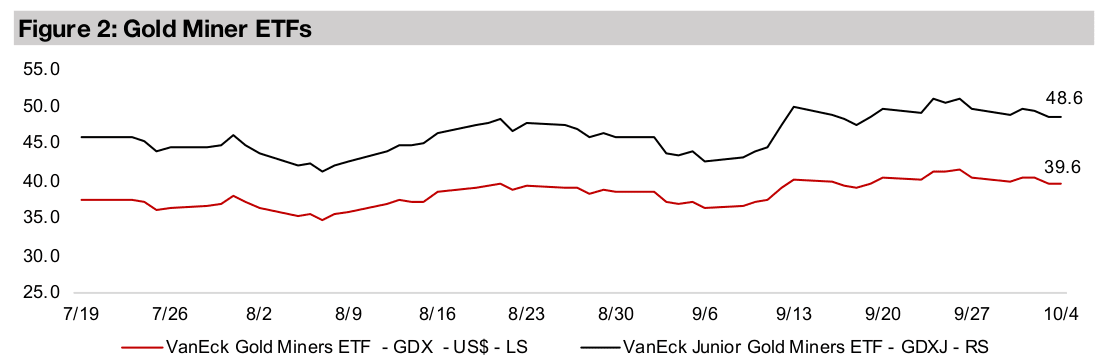
Gold stocks declined with the GDX and GDXJ both down -2.0% as the metal price was roughly flat and equities were mixed with the S&P 500 and Nasdaq both up 0.4% but the Russell 2000 declining -0.2% and large TSXV gold was mostly down.


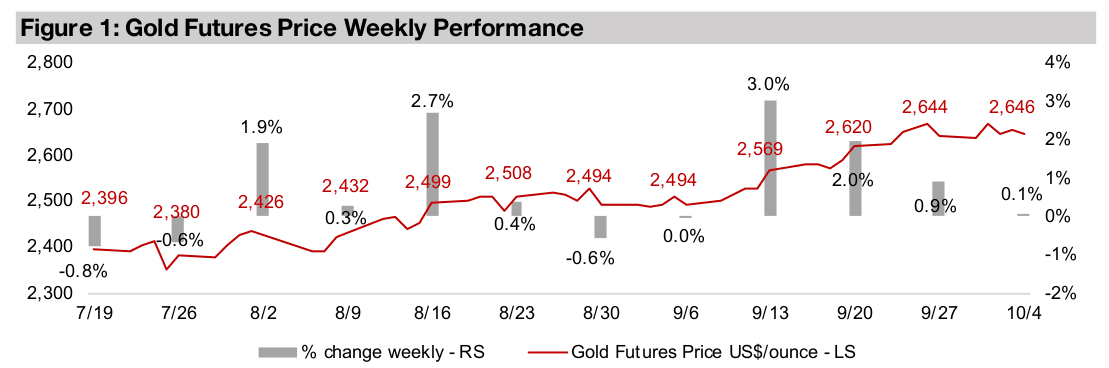
The gold price edged up 0.1% to US$2,646/oz, pausing after an aggressive run that
has seen it gain over US$150/oz in a month. The key economic news this week was
US employment data and a suspension of the port strike in the country. US nonfarm
payrolls of 254k in September 2024 came in far ahead of the 159k consensus
estimate, and while an agreement with port workers was reached on wages, the
automation issue remained unresolved, putting the strike on hold for 100 days. While
the jobs data looked inflationary, putting into question how aggressive further Fed
rates cuts could be, reopening the ports removed some risk of supply shortages
driving up prices. This left equity markets mixed, with the S&P and Nasdaq up 0.4%
and Russell 2000 down -0.2%. The flat metal price and lukewarm equity markets saw
gold stocks decline, with the GDX and GDXJ both off by -2.0% for the week.
While gold flattened this week, two of the major base metals, iron ore and aluminum,
continued to rise, up 17.1% and 0.8%, respectively, apparently still propelled by
China’s stimulus, although copper declined -0.6% (Figure 4). Iron ore is up 17.9%
since the stimulus was announced on September 25, 2024, as China accounts for
over 50% of the metal’s global consumption and over 70% of its global imports. While
this was a particularly parabolic move after the metal had remained flat for most of
September, it is still down -20% after a major downtrend for most of 2024.
While aluminum has risen 5.1% since the stimulus announcement, it was already in
a broader uptrend off recent lows at the end of July 2024, when it was down about
5% for the year, and is now up 14% so far in 2024. China is the world’s largest
aluminum producer and consumer, at around 60% of the global total for both. While
copper saw less of a decline through the middle of the year, it did reach as low as a
3.0% gain as of mid-August 2024, but has rebounded to a 17% rise for the year.
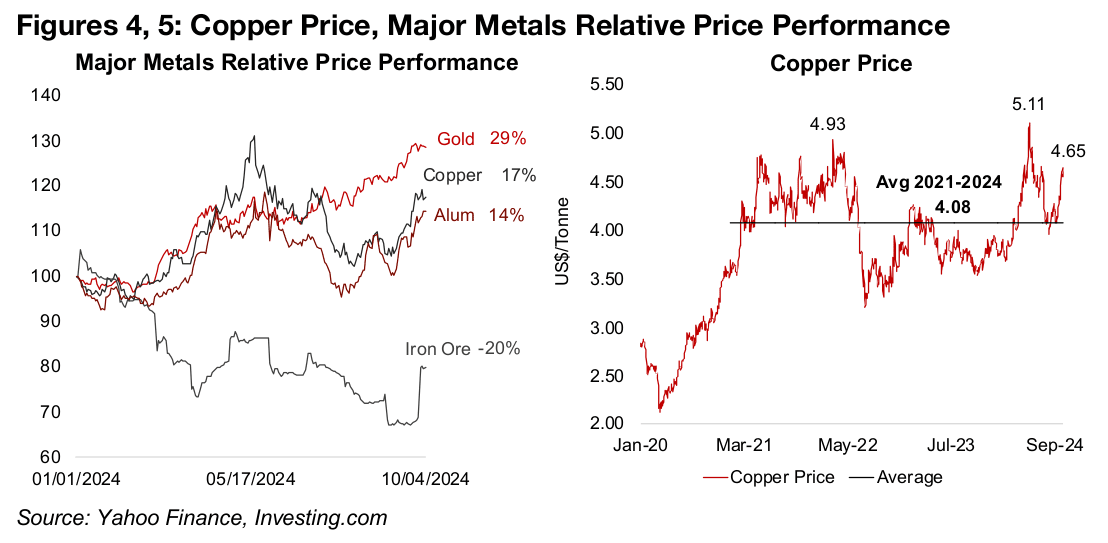
The copper price has traded at an average US$4.08/lb since 2021, ranging from
about US$3.50/lb to US$5.00/lb (Figure 5). The current price of US$4.65/lb sees it
again heading towards the top of this range, raising the question of whether it will
break out to higher levels, similar to gold. Overall key forecasters seemed mixed on
copper for 2025, and not particularly bullish. This could be because of concerns that
even as central banks come through with rate cuts, they could continue to be gradual
given the risk of reigniting still high inflation, at the same time that global economic
growth could be sluggish, generating some degree of stagflation.
The two main publicly available and regularly updated forecasts for copper supply
and demand are from the International Copper Study Group (ICSG) and Australia’s
Office of the Chief Economist (AOCE). Both sources have released updated forecasts
in just the last few weeks, so there is no issue with differences arising because one
forecast is much newer than the other. Also, with only three months left in 2024, data
covering the majority of this year will be well known and incorporated into the copper
price, so the market will now be looking ahead to 2025 forecasts.
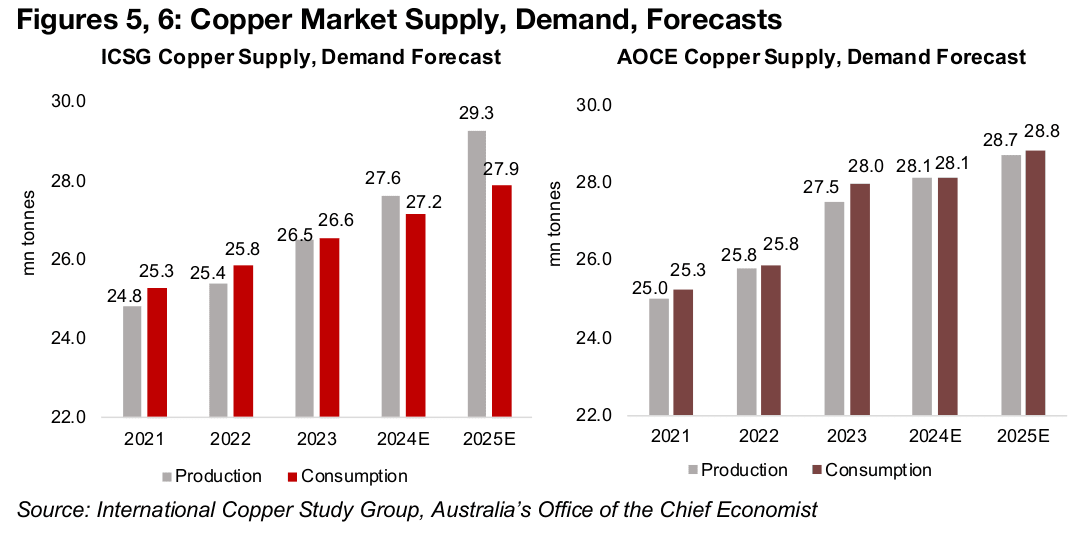
The two sources differ substantially in their outlooks, with the ICSG expecting a 5.9%
jump in production to 29.3 mn tonnes for 2025, versus a 2.7% rise in consumption
27.9 mn tonnes (Figures 5, 6). The AOCE expects a much more subdued 2.1% rise
in supply to 28.8 mn tonnes, and a similar 2.5% rise in demand. This leads to a major
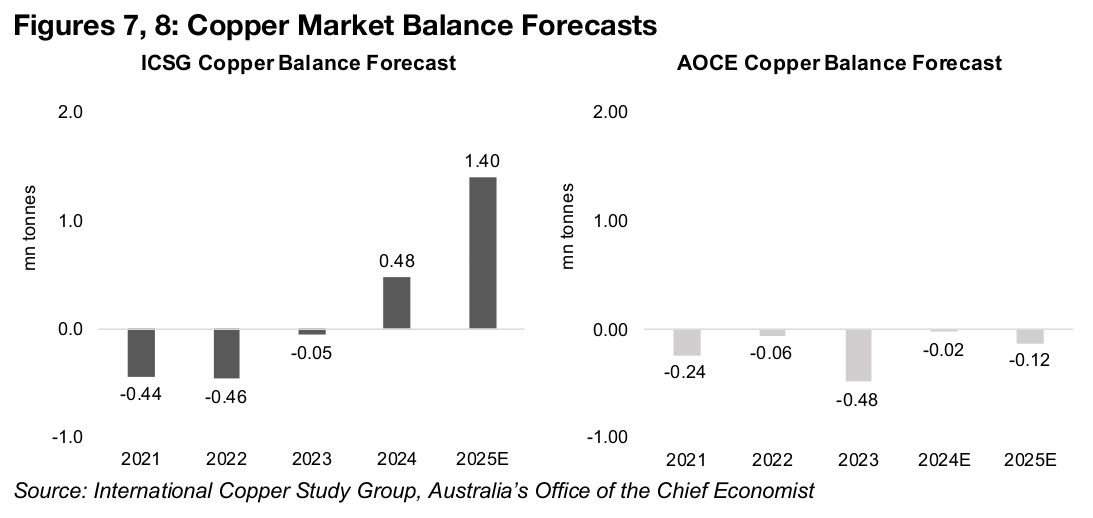
difference in the copper market balance between the sources, with a considerable
surplus of 1.40 mn tonnes for the ISCG and slight -0.12 mn tonne deficit from the
AOCE (Figures 7, 8). The ICSG’s large surplus would tend to imply more downward
pressure on the copper price than the AOCE’s forecasts.
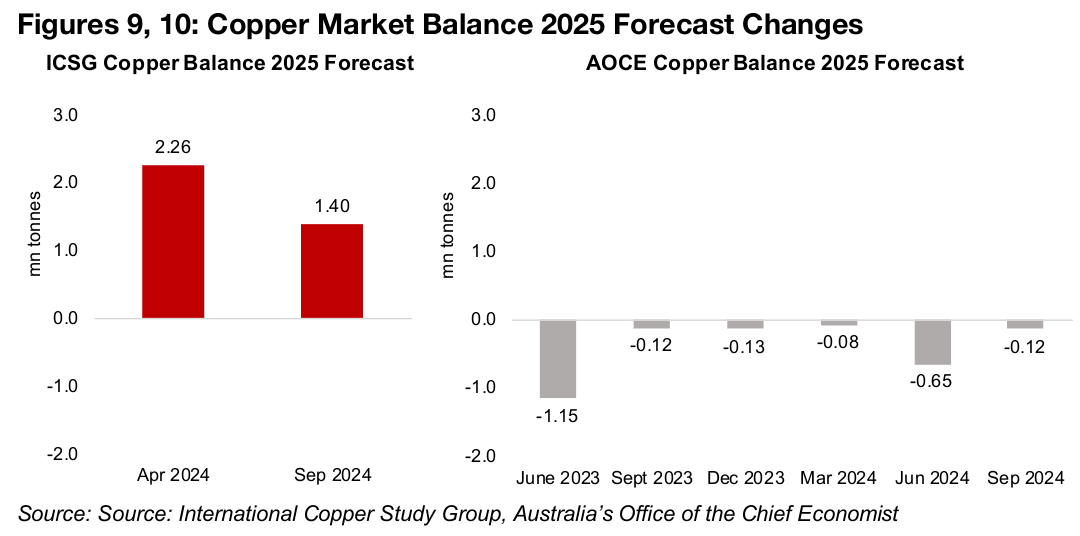
The ICSG’s forecast surplus for 2025 has contracted however, from 2.26 mn tonnes as of April 2024, mainly because of a drop in its production estimate from 30.1 mn tonnes (Figure 9). The AOCE’s forecast deficit for 2025 has contracted from -0.65mn tonnes in June 2024, but from a reduction in its consumption estimate, bringing it back near the flat balance for 2025 from September 2023 to March 2024 (Figure 10).
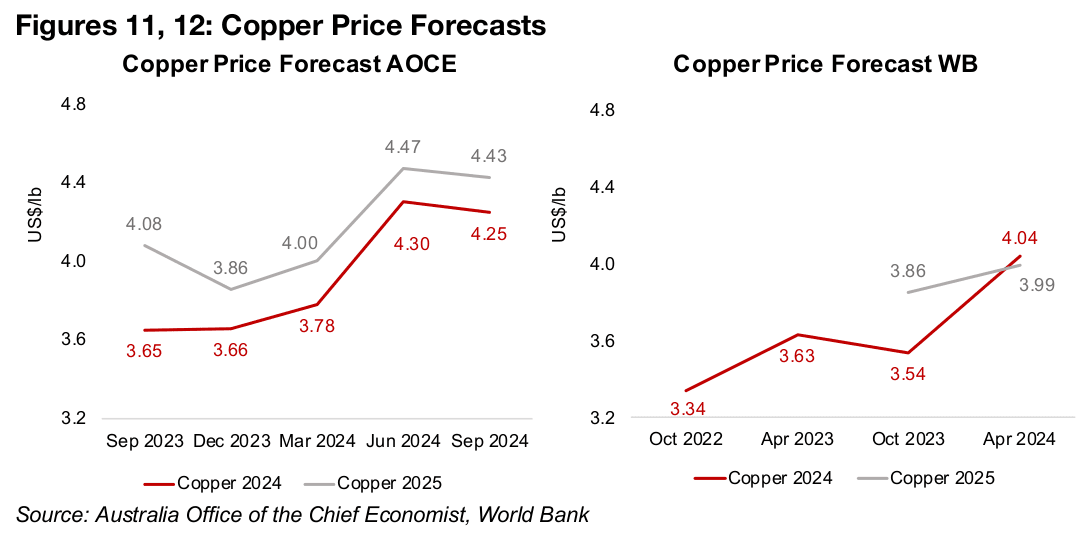
While AOCE also releases copper price estimates, the ICSG does not include explicit
price forecasts. The World Bank (WB) releases copper price estimates, allowing for a
comparison versus the AOCE, but not detailed supply and demand data. The AOCE
expects a moderate 4.2% rise in the copper price to US$4.43/lb, from US$4.25 in
2024, which is almost exactly at the US$4.23/lb average year to date (Figure 11).
The AOCE’s copper price forecasts have increased considerably over the past year,
from just US$3.66/oz for 2024 and US$3.86/oz for 2025 as of December 2023, as the
institution boosted estimates along with the metal’s gain this year. The World Bank
expects the copper price to be near flat year on year, edging down to US$3.99/oz in
2025 from US$4.04/oz (Figure 12). However, this 2024 forecast is becoming quite
dated, having been released in April 2024, and is well below the average this year.
While we expect that the WB’s copper estimate for 2024 is likely to rise when its new
targets are released later this month, it is unclear whether it will maintain its 2025
estimate, which would imply a decline in copper year on year and in turn have bearish
implications for the global economy. While there is no clear consensus emerging from
these sources on the outlook for the copper price next year, taken together we can
conclude they do not appear particularly bullish on the sector.
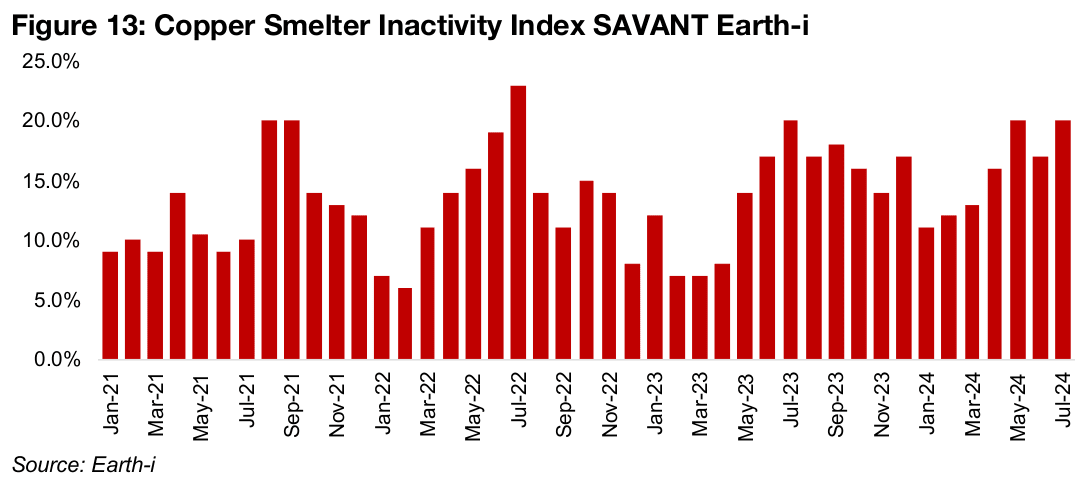
There has been a considerable focus on copper smelter activity recently, of which
China operates 97% of the global capacity, which can have a considerable effect on
the copper price. Earth-i’s SAVANT copper smelter inactivity index shows the
sector’s unused capacity has risen to an average 15.6% in 2024 through to July 2024,
up from an average 13.9% in 2023 and 13.2% in 2022 (Figure 13).
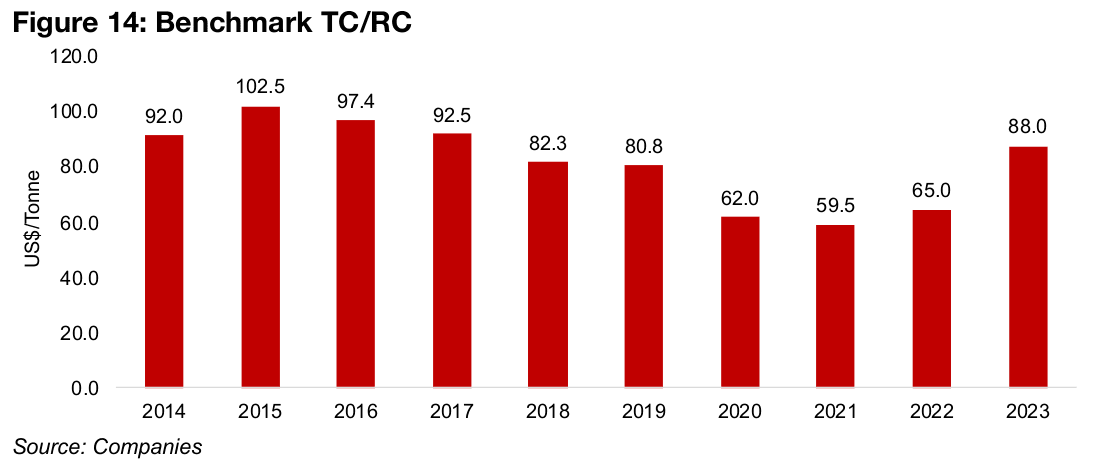
This is partly because processing fees for the copper smelters to convert copper
concentrates into refined metal have reportedly declined this year, which can cause
capacity in the industry to be shut down as production becomes unprofitable. After
the benchmark Treatment Charges and Refining Charges (TC/RC) had become low
from 2020-2022, it recovered in 2023, but is expected to drop again for 2024-2025,
with an announcement expected as early as this month (Figure 14).
The pressure on the TC/RC rates has been driven in large part by a major increase in
China’s copper smelter capacity in recent years, which had been outpacing the
country’s supply and imports of concentrates to be processed. This has driven down
the TC/RC charges as smelters compete for available concentrates with lower rates.
While this could lead to lower refined copper production in 2025, this trend is well
known to the markets, and likely already incorporated into ICSG and AOCE forecasts.
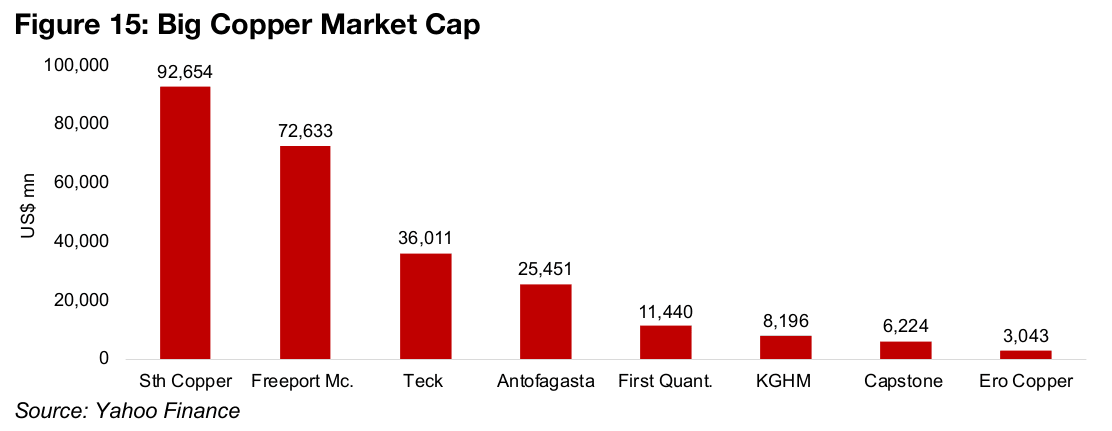
Big Copper, including companies where the metal is a majority of revenue, Southern
Copper, Freeport McMoran, Teck Resources, Antofagasta, First Quantum Minerals,
KGHM, Capstone Copper and Ero Copper, has had a strong year (Figure 15). While
there are some industry giants that are huge copper producers with output of the
metal above the levels of some of these names, including BHP and Glencore, they
are far from copper pure plays and have large contributions from other metals.
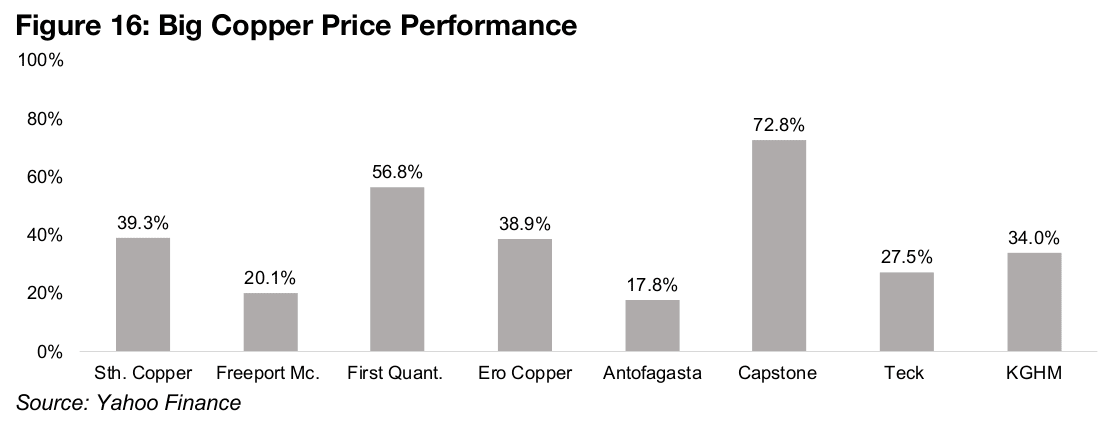
The entire group gained at least 18% this year, and four of eight are up over 30%
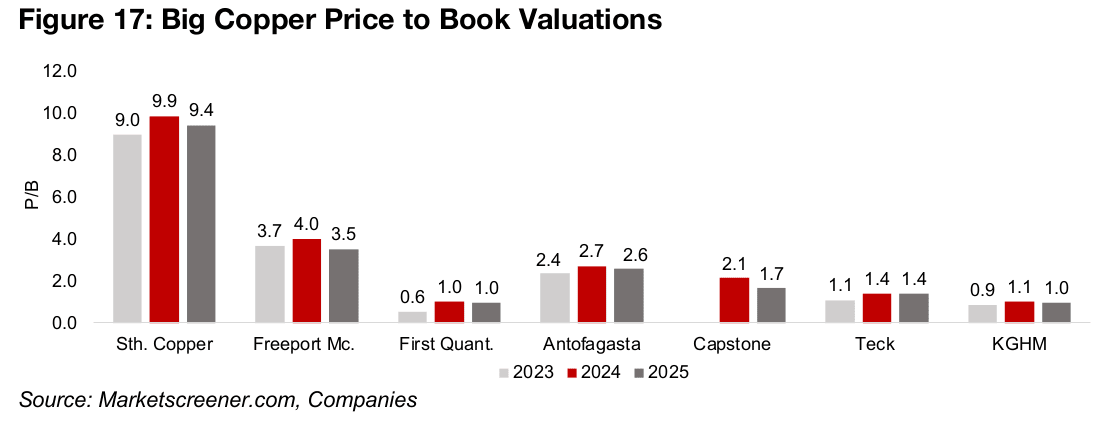
(Figure 16). However, valuations overall remain subdued, with only Southern Copper
extremely elevated, with a price to book (P/B) multiple at 9.9x 2024. Freeport-
McMoran and Antofagasta also stand out for relatively high price to book ratios at
4.0x and 2.7x for 2024, but the multiples for the rest of the sector are low, at 2.1x for
Capstone, 1.4x for Teck and 1.0x for First Quantum and KGHM (Figure 17).
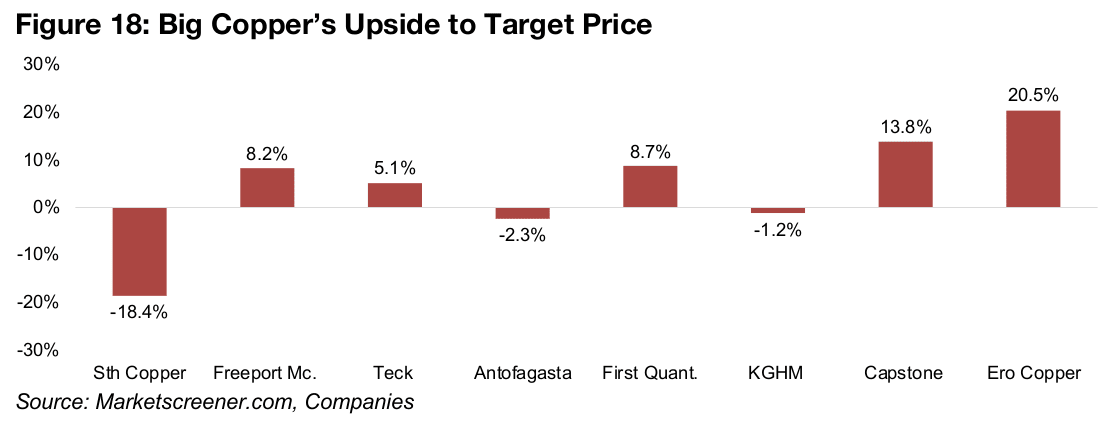
The market does see Southern Copper, with its very high multiple, as overvalued, with -18.4% downside forecast to its target price, but is mixed on the other two high P/B stocks, with -2.3% downside to Antofagasta’s target, and 8.2% upside expected for Freeport-McMoran (Figure 18). The highest upside is forecast for First Quantum, Capstone and Ero Copper, at 8.7%, 13.8% and 20.5%, respectively, with a moderate 5.1% upside forecast for Teck and a slight -1.2% downside to KGHM’s target.
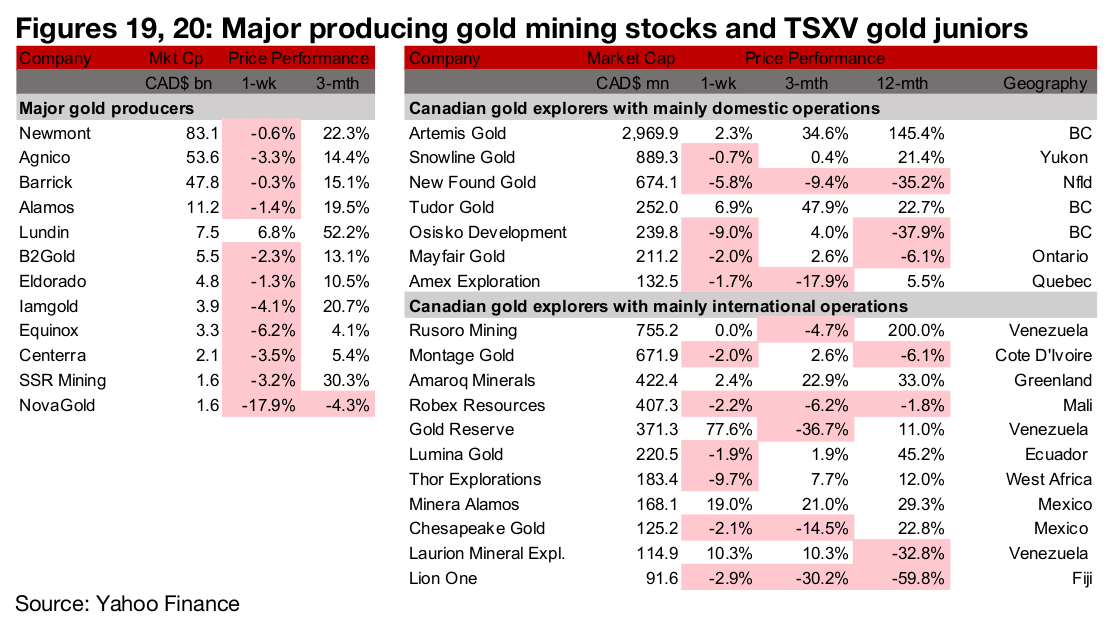
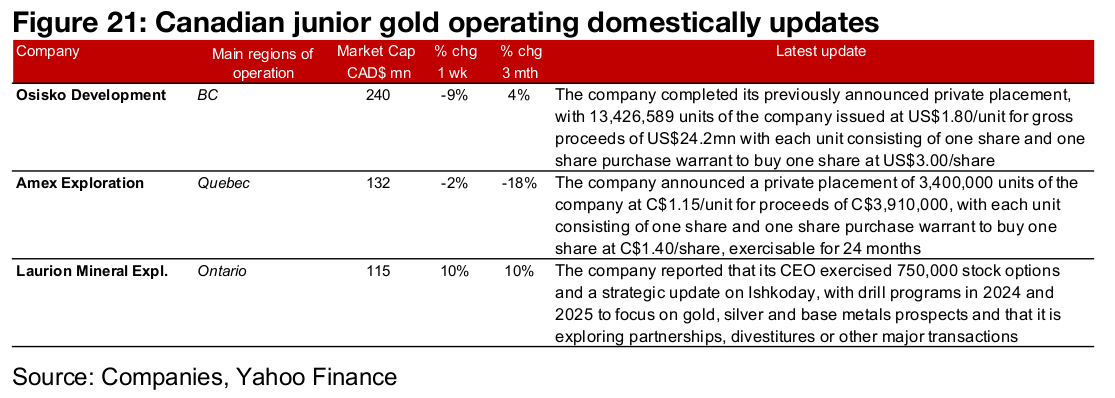
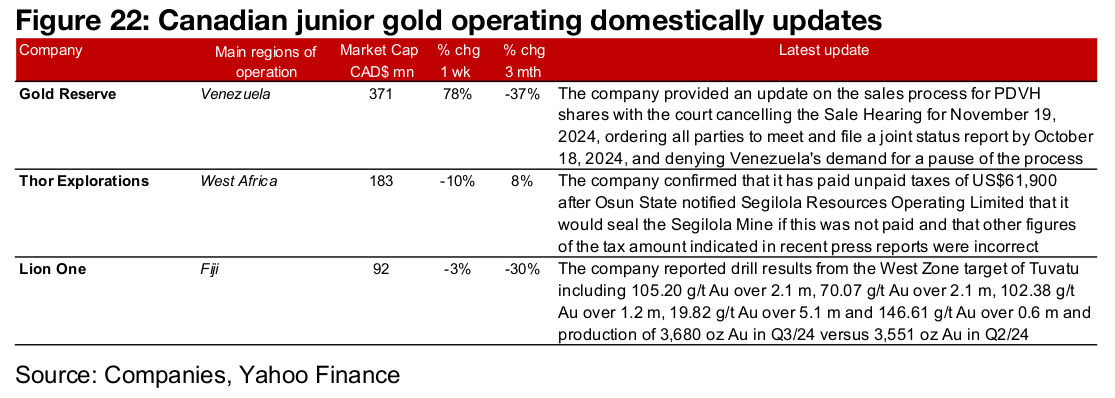
Most of the gold producers and TSXV gold were down on the flat gold price and mixed equities (Figures 19, 20). For the TSXV gold companies operating domestically, Osisko Development completed a private placement for proceeds of US$24.2mn, Amex Exploration announced a new private placement for proceeds of CAD$3.9mn and Laurion announced an exercise of stock options by its CEO and a strategy update for Ishkoday (Figure 21). For the TSXV gold companies operating internationally, Gold Reserve provided an update on the sales process for PDVH shares, Thor Explorations commented on press reports regarding an unpaid tax payment for Segilola and Lion One reported drill results from the West Zone of Tuvatu and Q3/24 gold production (Figure 22).
Disclaimer: This report is for informational use only and should not be used an alternative to the financial and legal advice of a qualified professional in business planning and investment. We do not represent that forecasts in this report will lead to a specific outcome or result, and are not liable in the event of any business action taken in whole or in part as a result of the contents of this report.
Author
Ben McGregor authors the Weekly Roundup at CanadianMiningReport.com, providing sharp analysis of the metals and mining sector. With a talent for spotting trends, Ben distills complex market shifts into clear, engaging insights on TSXV junior miners. His weekly updates cover gold, copper, uranium, and more, blending data-driven perspectives with a knack for identifying opportunities. A vital resource for investors, Ben’s work navigates the dynamic junior mining landscape with precision.