July 22, 2024
Canada Remains Mining M&A Heavyweight
Author - Ben McGregor
Canada second most significant player in global mining M&A
This week we look at Canada’s global mining M&A activity, which has been reasonably strong over H1/24, while the country is second only to China for total M&A value, and just behind leader Australia based on M&A value to GDP, in recent years.
Gold stocks hit by pullback in metal price
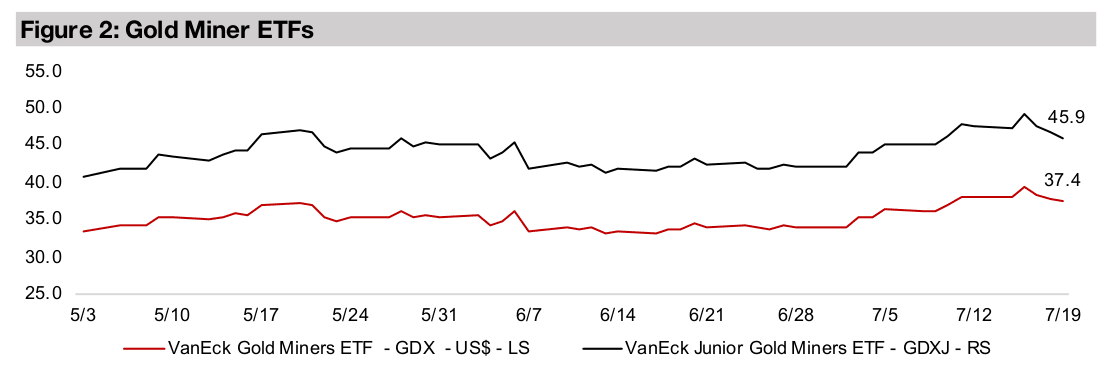
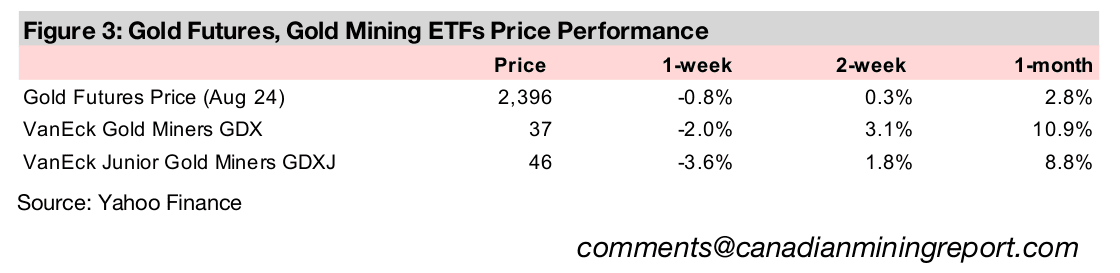
Gold stocks were hit by the drop in the metal price, although the -2.0% decline in the GDX outperformed the -2.3% fall in the S&P 500, while the GDXJ lost - 3.6% and was not buoyed by continued small cap gains, with the Russell 2000 up 1.0%.


Canada Remains Mining M&A Heavyweight
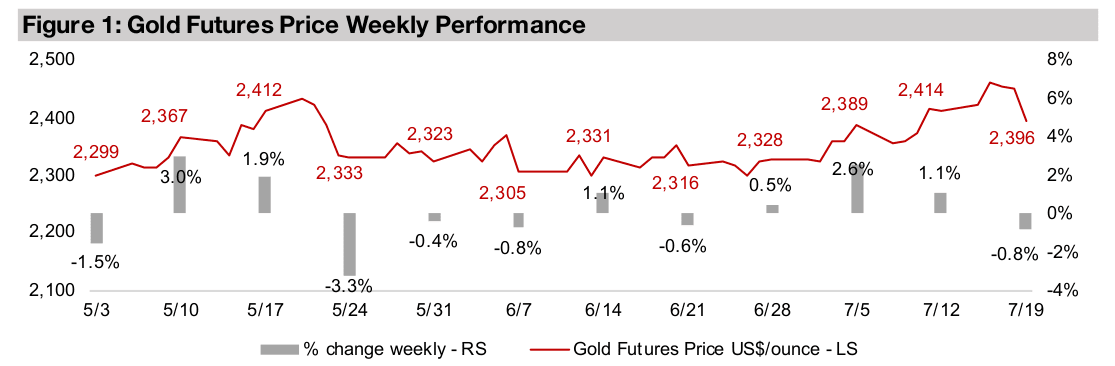
Gold declined -0.8% to US$2,396/oz, dipping just below the key US$2,400/oz level
after holding above it for most of the week. Major economic news was taken as
neutral by the markets, with comments by Fed Chairman Powell to start the week,
and inflation data to end it, not driving substantial moves. However, equities were
roiled by a pullback in tech, as markets are apparently finally becoming concerned
about elevated tech sector valuations, and at the end of the week a Crowdstrike-
driven disruption of global IT systems pulled down markets further.
While this rise in risk might have been expected to drive up gold, some of the short-
term potential for an increased incidence of adverse events may have been priced in
with a gain of around US$100/oz over six weeks. The tech equity weakness obviously
hit the Nasdaq, which dumped -4.1% and drove most of the -2.3% decline in the
S&P 500, although small caps continued to be strong, with the Russell 2000 adding
1.0% for the week. The gold stocks declined on the drop in the metal price, although
the GDX ETF of producers outperformed the S&P 500 with a -2.0% pullback. The
GDXJ ETF of juniors was not buoyed by the small cap strength and fell -3.6%.
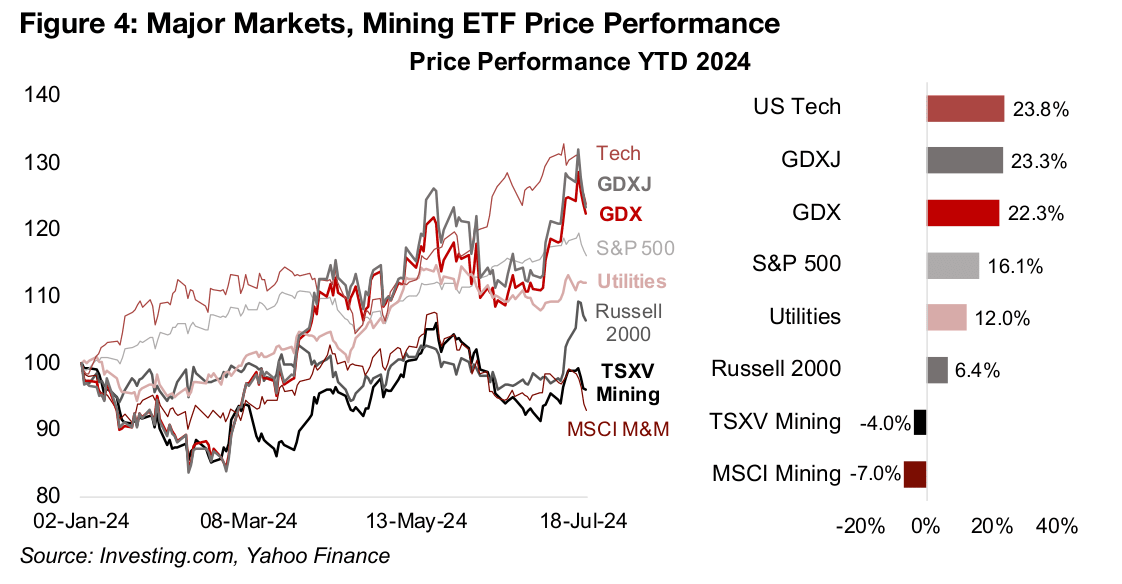
Over the past two weeks we have seen the gold stocks once again catch up with
tech, with the first convergence in mid-May 2024 before gold stocks pulled back
through June (Figure 4). However, US Tech, up 23.8% year to date, is now only just
ahead of the GDXJ and GDX, which have risen 23.3% and 22.3%, respectively, after
the recent ramp up in gold stocks. There has also been a parabolic Russell 2000
move over the past two weeks, with markets aggressively moving into other risk
sectors, while at the same time pulling back from tech, for the first time this year.
Plenty of potential for continued rotation out of tech
Even after the significant decline in the Nasdaq this week, there still appears to be
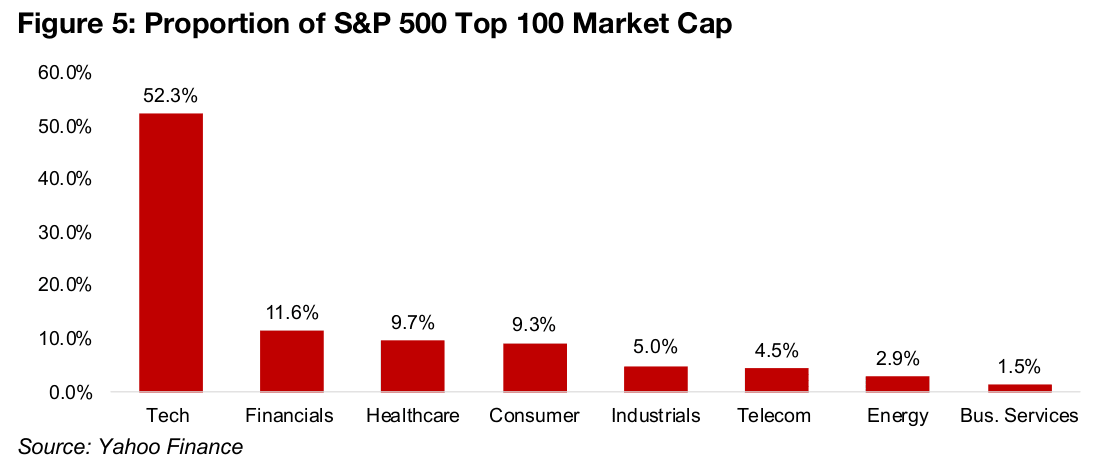
plenty of potential for a rotation out of Big Tech and into other sectors. US Tech
comprises 52.3% of the market cap of the Top 100 S&P 500 stocks, with the next
three largest sectors around a fifth of this level (Figure 5). While this has partly been
driven by rising earnings, there has also been a huge rise in valuation multiples, which
indicate how long the market expects the current growth rate can be sustained.
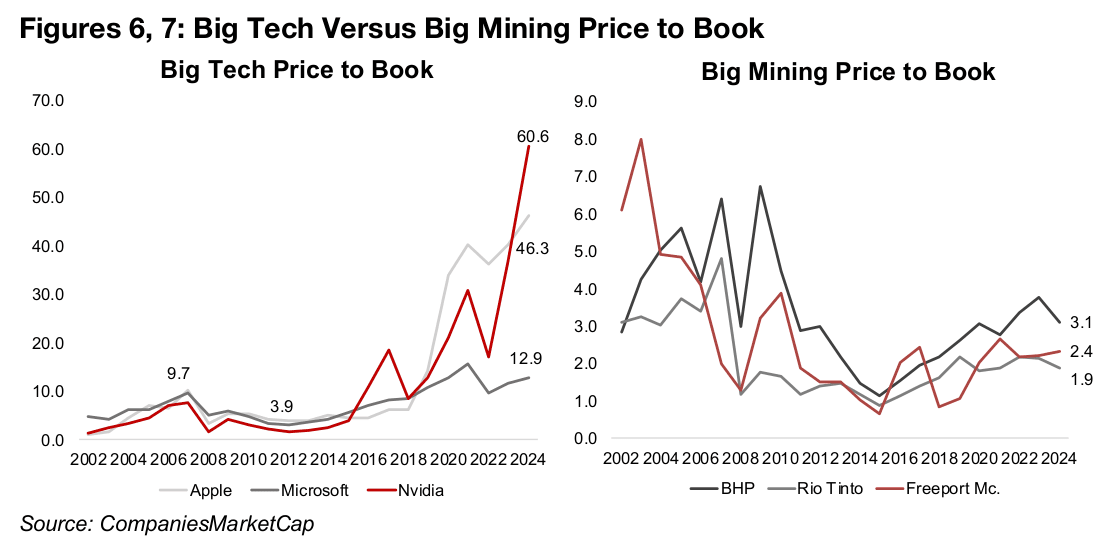
The current ramp in the price to book (P/B) multiples of the three biggest tech giants
is extreme, as they remained below 10.0x from 2002 to 2018, but have surged to
60.6x, 46.3x and 12.9x for Nvidia, Apple and Microsoft, respectively (Figure 6). This
contrasts with Big Mining, with BHP, Rio Tinto and Freeport McMoran P/Bs well
below twenty-year highs, and only moderately up from 2014-2018 lows (Figure 7).
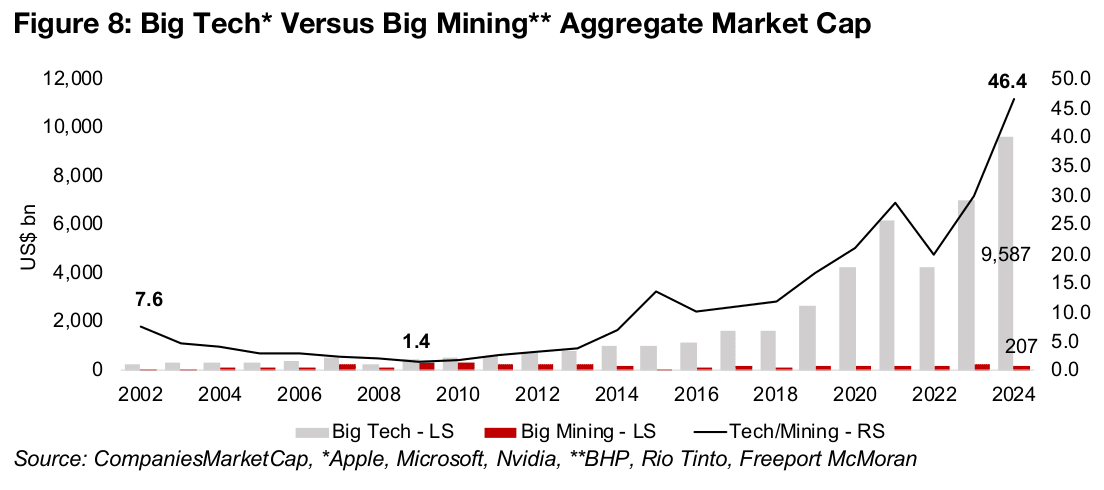
Big Tech to Big Mining market cap ratio increasingly extreme
The aggregate market cap of the three Big Tech stocks is now US$9,587bn, or 46.4x
the US$207bn level of the Big Mining stocks (Figure 8). This has certainly not always
been the case, with Big Tech’s market cap at just 1.4x Big Mining’s in 2009 after the
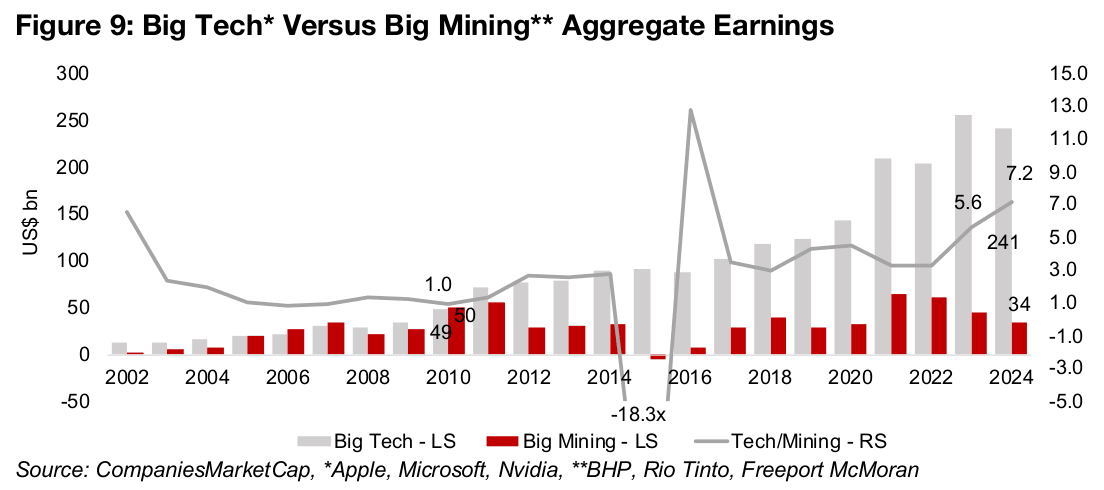
global financial crash. This can of course be partly justified by far stronger growth in
Big Tech’s earnings, which were near equal to Big Mining in 2008 at around US$49bn,
but had risen to US$241bn, or 5.6x the level of Big Mining by 2023 (Figure 9).
This would suggest that a Big Tech/Big Mining market cap ratio of 6.0x would
certainly be reasonable, and even 10x or 20x plausible, if the market had a bullish,
but still reasonable, outlook on the prospects for tech earnings. However, a ratio near
50x is effectively assuming perfection for Big Tech earnings and perpetual doldrums
for Big Mining. This could be setting up Big Tech for an eventual major earnings
disappointment while Big Mining’s low valuations offer a cushion to the downside.
Still significant room for further rise in global mining M&A
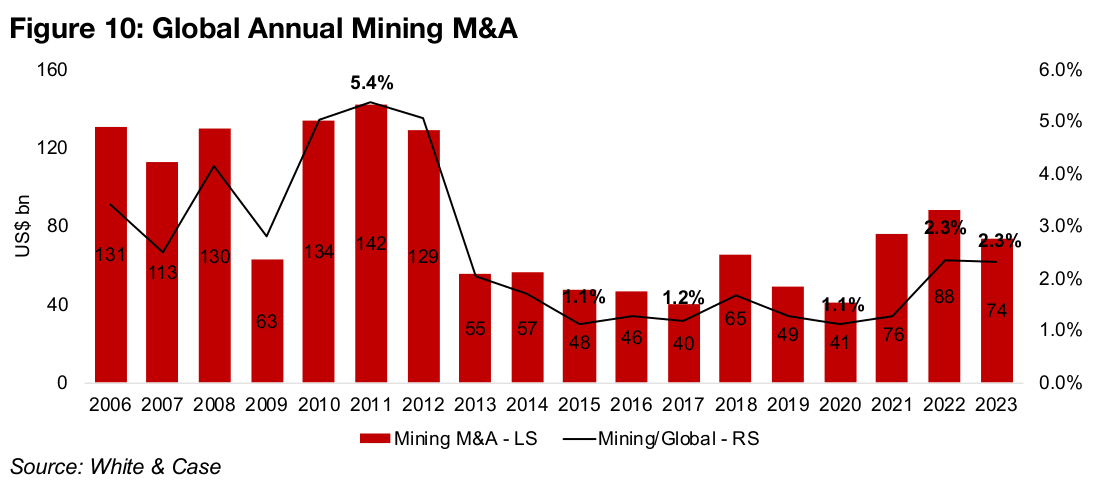
The low level of global mining valuations combined with an uptrend in metals prices in recent years have increased opportunities for M&A in the sector with many deals attractive under these conditions. Global mining M&A was US$74bn in 2023, or 2.3% of total global M&A, and averaged US$79bn over the past three years (Figure 10). This is a clear improvement over the lull in mining M&A activity from 2013-2019, with an average US$51bn per year, and 2017 low of US$40bn, at 1.2% of the total M&A.
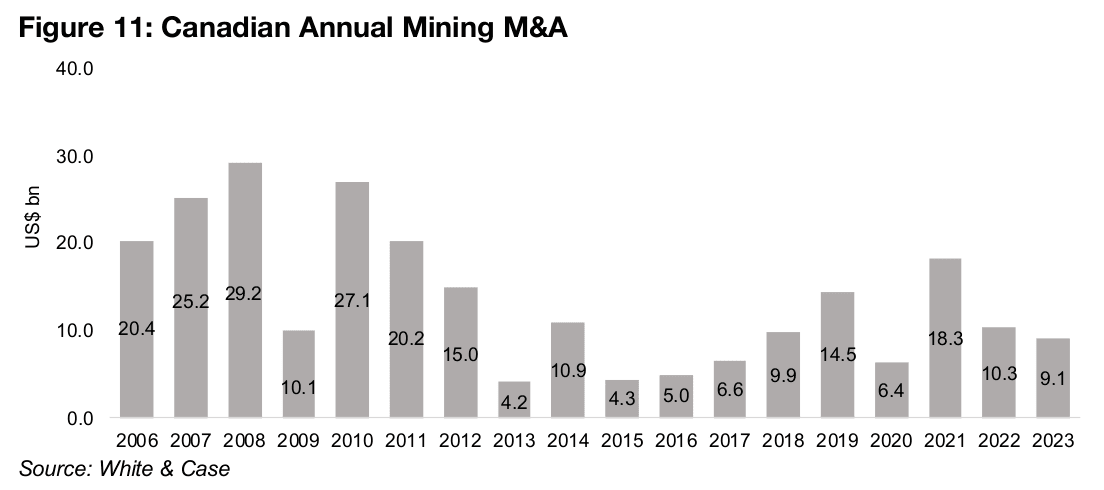
Canadian M&A mining activity followed a roughly similar trend, with a strong period from 2006 to 2012 and weakness for several years from 2013. However, it started to pickup in 2018, in contrast to 2021 for global mining, and apart from a weak 2020, generally trended up to a peak of US$18.3bn in 2021 (Figure 11). While the country’s mining M&A for 2022-2023 declined to an average US$9.7bn, this was well above the US$6.2bn average from 2013-2017, but only a third of the peak US$29.2bn in 2008.
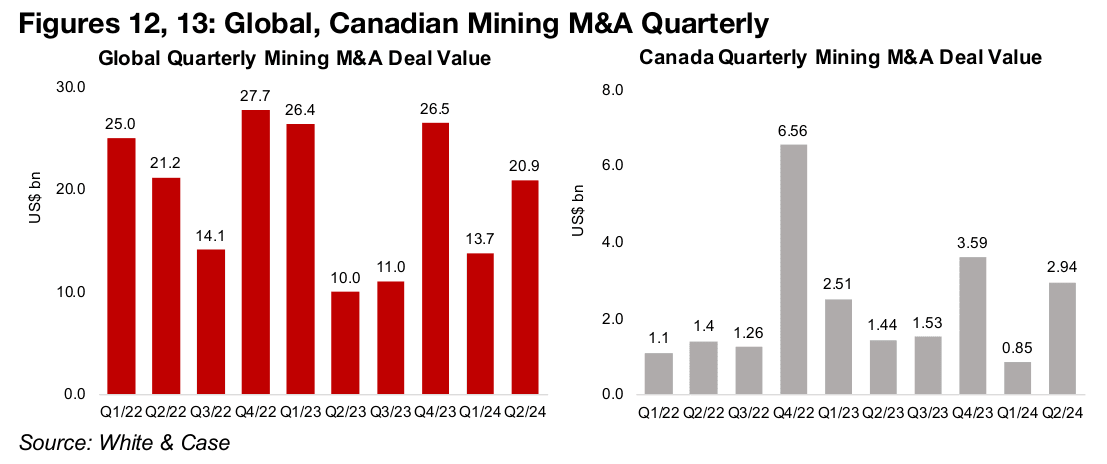
Quarterly global mining M&A data indicates a relatively strong year in 2024 so far, with H1/24 at US$34.6bn, or 47% the level of 2023, putting in on track to potentially match last year (Figure 12). Canadian M&A was US$3.9bn over first half, or about 42% of last year, which could see it also get to last year’s level with some moderate growth half on half for H2/24 (Figure 13).
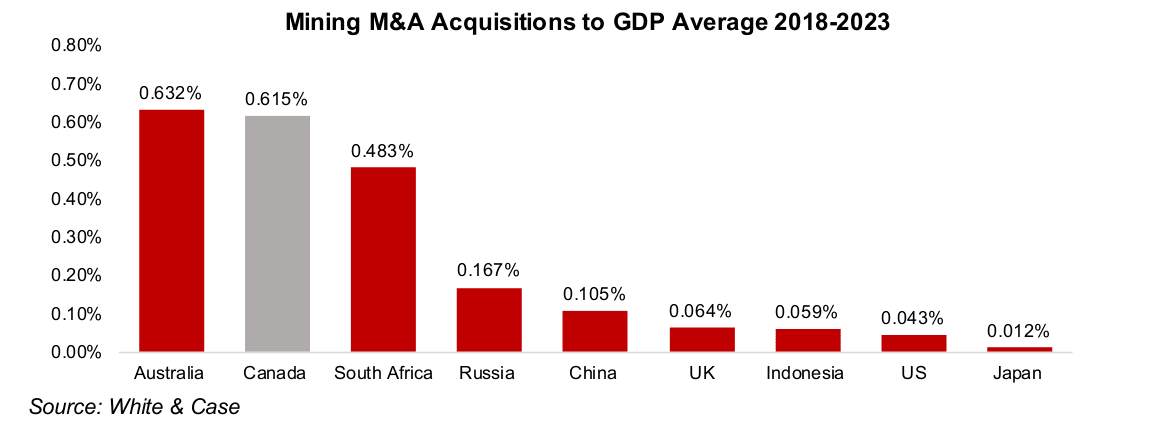
Canada is second most significant global mining M&A player
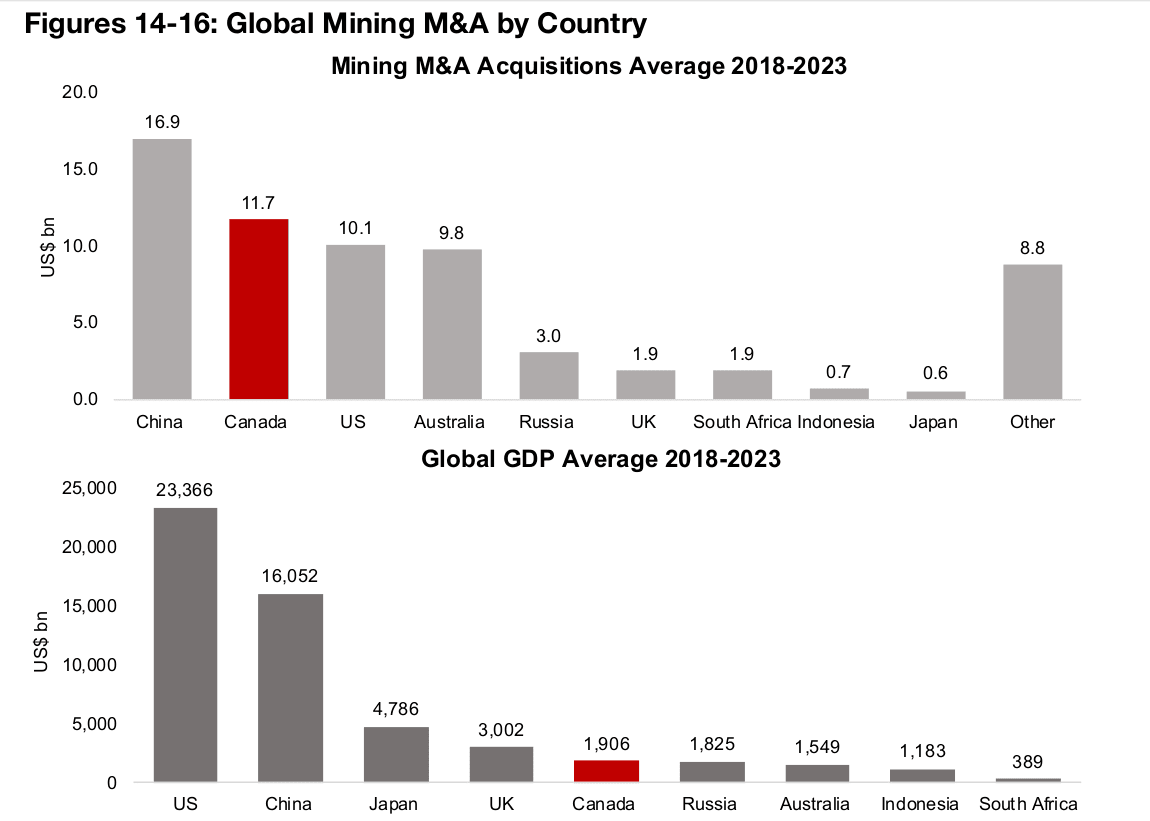
Canada has been the second largest player in terms of global M&A in absolute terms,
averaging US$11.7bn per year from 2018-2023, second only to China, at US$16.9bn
(Figure 14). However, Canada’s GDP, averaging only US$1,906bn from 2018-2023 is
of course far smaller than China’s, at US$16,052bn (Figure 15). This gives the former
a much higher Mining M&A/GDP ratio of 0.615% versus the latter at just 0.105%
(Figure 16). This puts Canada almost at the global top for Mining M&A/GDP over the
past six years, with only Australia marginally higher, at 0.632%.
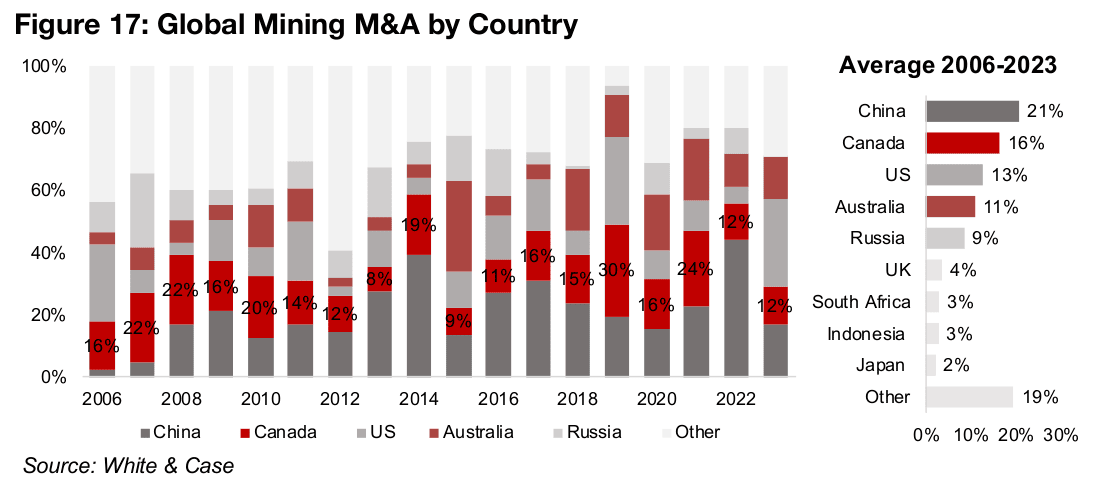
Looking back farther to 2006, while a country’s share of global mining M&A by
country can change dramatically from year to year, the average gives the same
country ranking as the 2018-2023 data. China, Canada, the U.S. and Australia are the
market the leaders with 21%, 16%, 13% and 11% shares (Figure 17). Russia is the
fifth largest player over both periods, but its M&A share has dropped recently, to just
3% from 2018-2023 versus 9% since 2006. For both periods, the shares of the other
major players are all in low single digits.
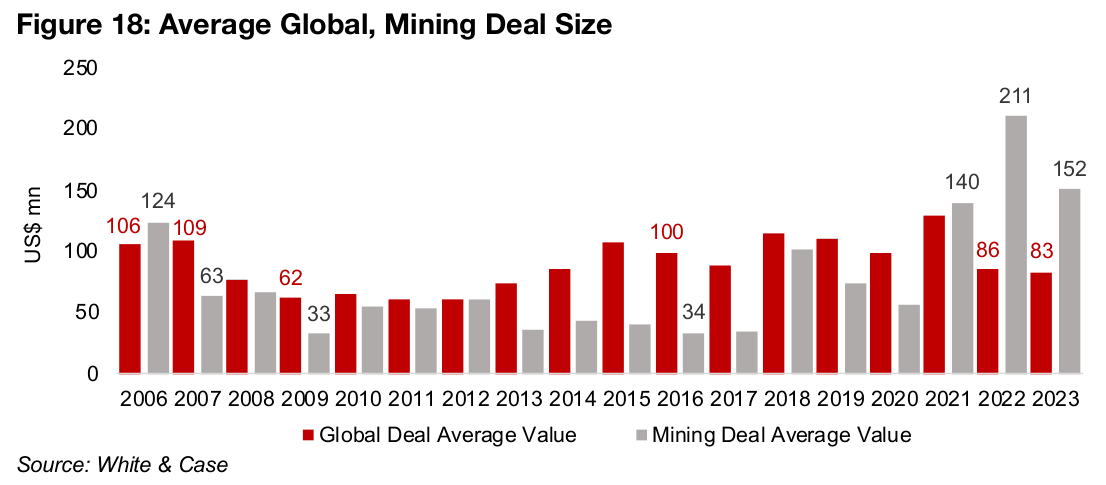
Mining M&A deals have been getting bigger over time, with a spike especially over
the past three years. The average mining deal size of US$54mn from 2007 to 2020,
had been -38% below the average for all global M&A deals at US$87mn over the
period (Figure 18). However, the mining deal size moved ahead of the global average
in 2021, to US$140mn, spiked to US$211mn in 2022, and was still a high US$152mn
in 2023, nearly twice the level of the average global M&A deal.
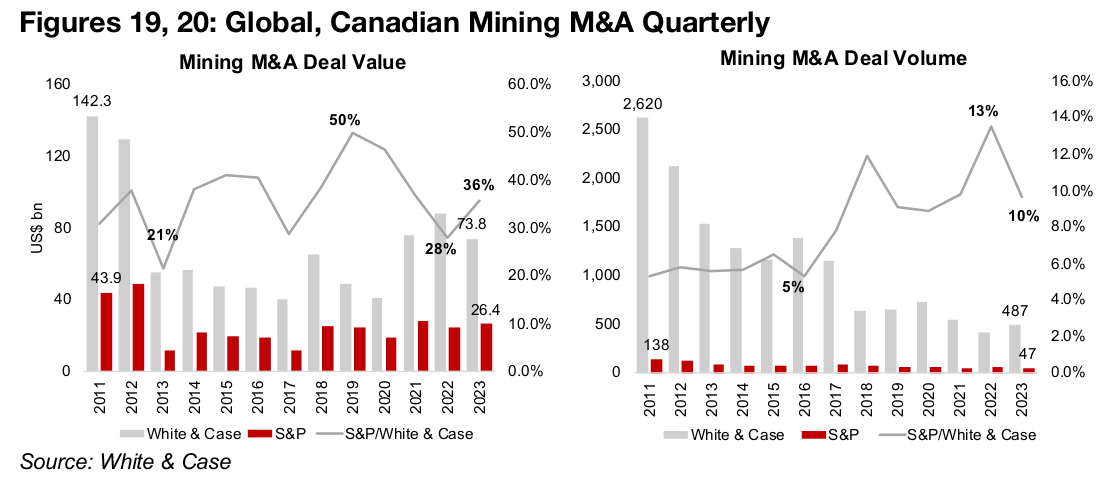
The above data from White & Case is extremely comprehensive and covers practically every global mining deal, no matter its size. However, this data is not split out by metal as is the S&P Global Data on Mining M&A, which provides data on both gold and the base metals. However, the S&P Global Data includes a much more limited number of deals, given criteria for a minimum size of US$10mn and at least 1.0mn oz of gold or 100k MT of base metals in reserves and resources. In 2023, this led to a total 47 deals with a US$26.4bn value being covered by S&P Global (Figure 19), compared to 487 deals with a value of US$76.4bn for White & Case (Figure 20).
Even split between gold/base metals M&A, era of megadeals continues
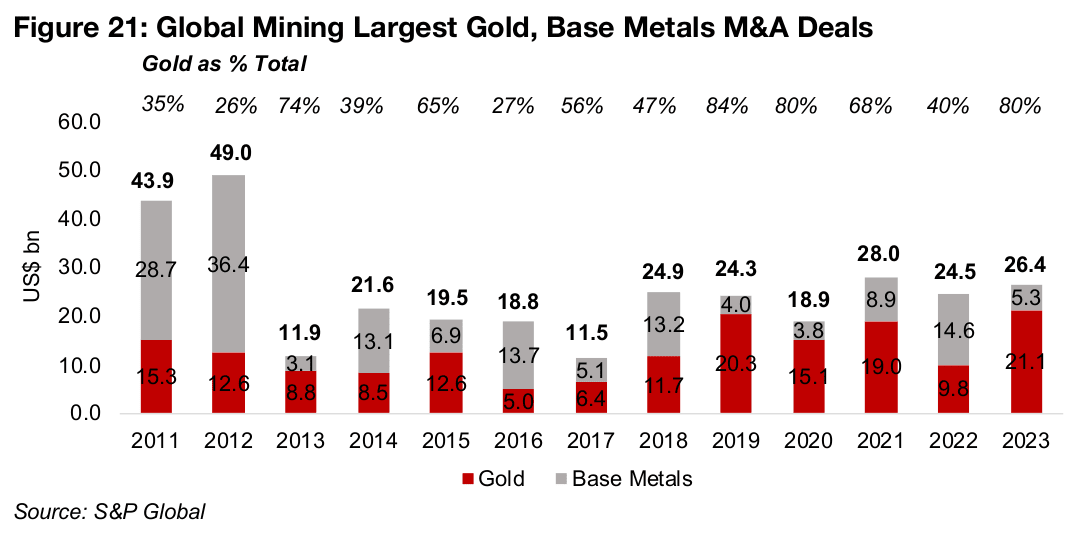
Gold deals dominated the largest global mining M&A deals in 2023, at US$21.1bn, or 80% of the total, while base metals were the majority in 2022 and 2021 (Figure 21). Gold deals also dominated in 2019 and 2022 at 84% and 80% while base metals led the market from 2014 to 2018. On average from 2011 to 2023 the total value has been roughly balanced between gold and base metals, at 51% and 49%, respectively.
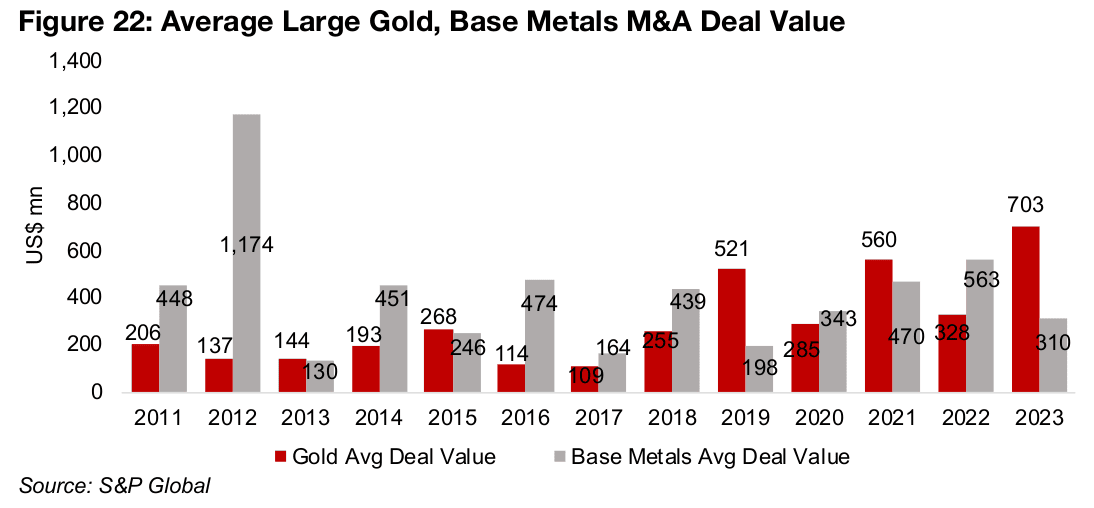
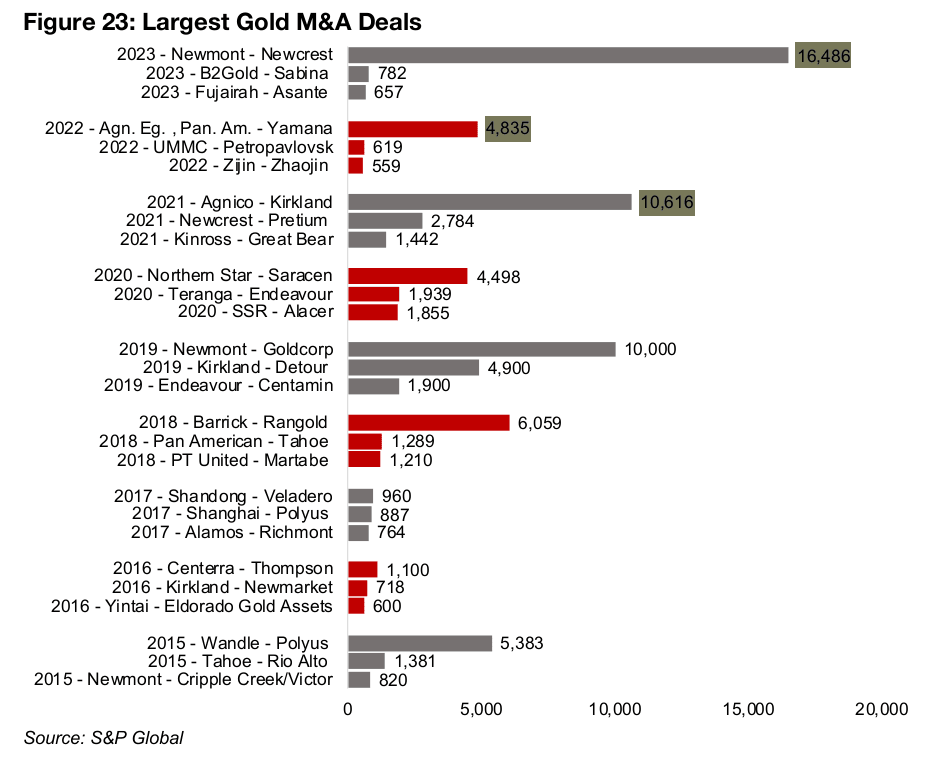
Similar to White & Case, the S&P Global data shows a considerable rise in the average deal value for the sector in recent years, for both gold and base metals deals, with the former at US$703mn and latter at US$310mn in 2023 (Figure 22). The new era of mining M&A megadeals, which started with Newmont’s US$10.0bn acquisition of Goldcorp and was followed by Agnico Eagle’s US$10.6bn purchase of Kirkland, continued in 2023, with Newmont’s US$16.5bn buyout of Newcrest (Figure 23).
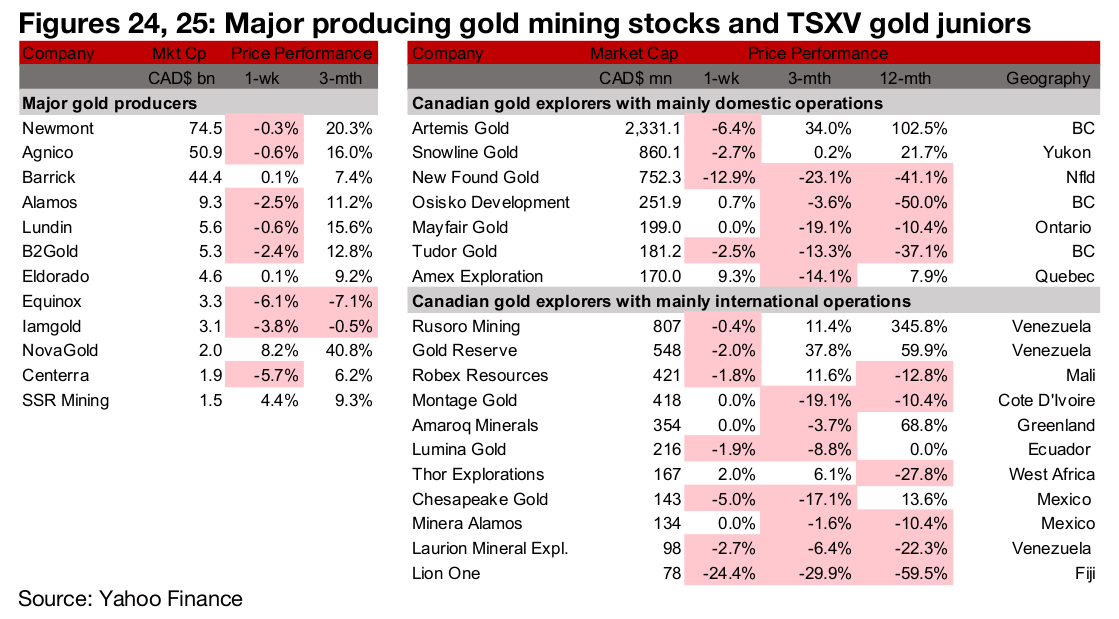
Major producers and large TSXV gold mixed
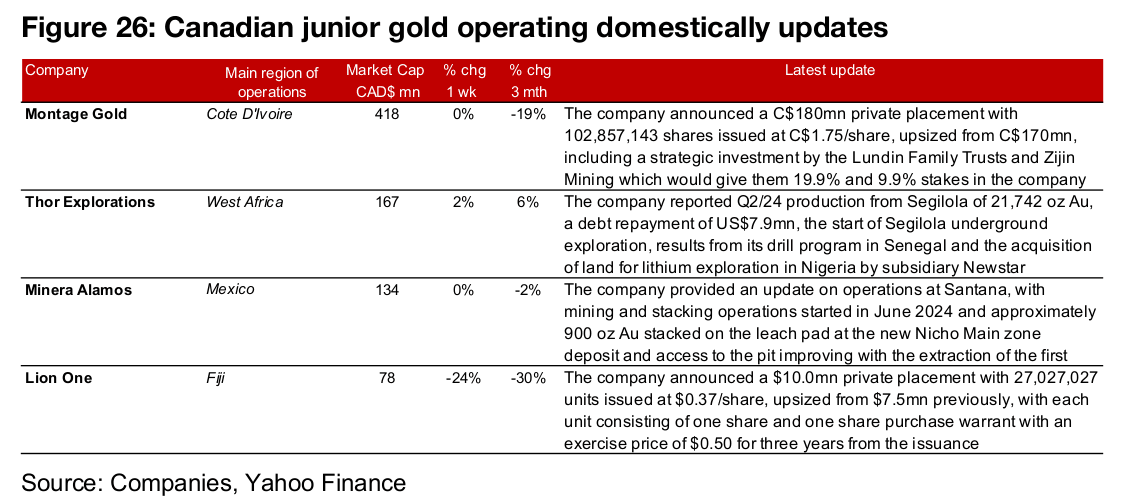
The major producers and large TSXV gold were mixed as the metal price and large cap equities fell but small caps rose (Figures 24, 25). For the TSXV gold companies operating domestically, there were no major news releases. For the TSXV gold companies operating internationally, Montage Gold and Lion One announced upsized private placements, Thor Explorations reported Q2/24 production and operational updates and Minera Alamos provided an update on operations at Santana (Figure 26).
Disclaimer: This report is for informational use only and should not be used an alternative to the financial and legal advice of a qualified professional in business planning and investment. We do not represent that forecasts in this report will lead to a specific outcome or result, and are not liable in the event of any business action taken in whole or in part as a result of the contents of this report.