March 10, 2025
Big Q4/24 for Big Gold
Author - Ben McGregor
Gold breaks through benchmark level for third time
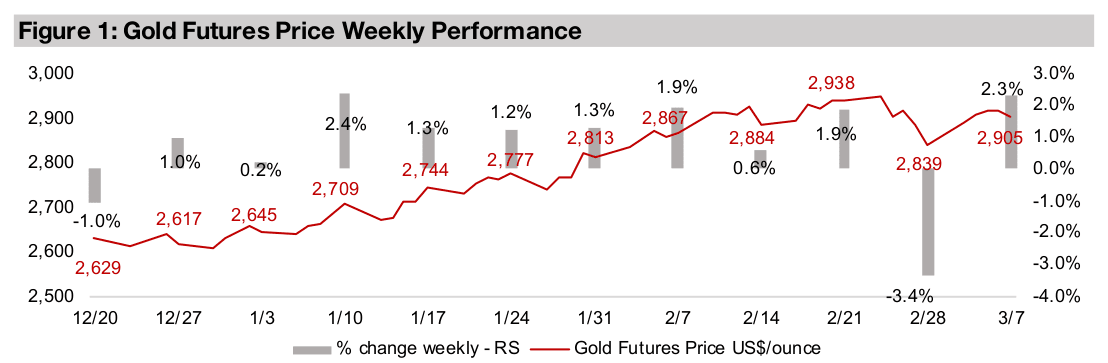
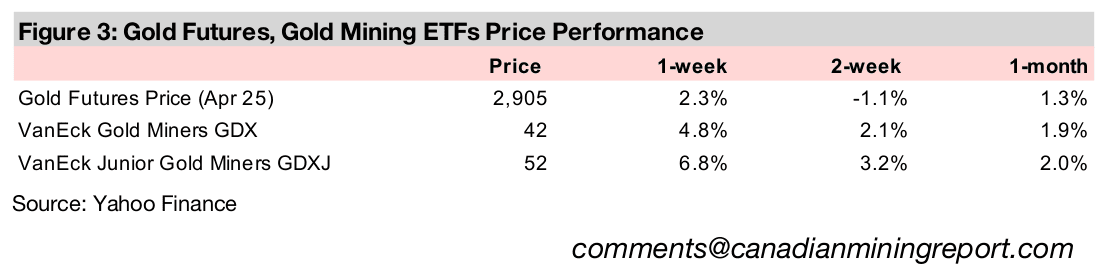
Gold rose 2.3% to US$2,905/oz, breaking through the US$2,900/oz benchmark level for the third time in a month, as markets apparently see risk rising with new US tariffs going into effect and US payroll numbers coming in below expectations.
Gold stocks back near highs
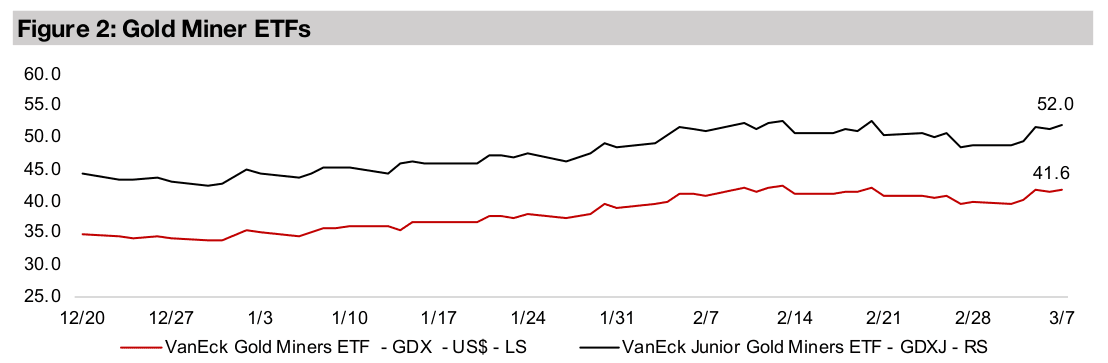
Gold stocks rose, with the GDX up 4.8% and GDXJ gaining 6.8%, back near mid- February highs, outperforming in the worst week for equities markets in months, with the S&P 500 down -3.3%, Nasdaq off -3.8% and Russell 2000 down -4.2%.


Big Q4/24 for Big Gold
Gold rose 2.3% to US$2,906/oz, breaking through the key US$2,900/oz level for the
third time in a month. The biggest single driver was likely the official implementation
of US tariffs on Tuesday, March 4, 2025, which are expected to be inflationary and
therefore could boost the gold price. The tariffs have also already caused retaliatory
moves by other countries and increased overall economic risk, which is another driver
for the metal. The release of US payroll data that came in below expectations likely
supported gold, as it was a further sign stagflation may be developing, as there are
concerns US growth is waning even while inflation remains relatively high.
This official start to the global trade war and weak jobs data hit equity markets hard,
with the S&P down -3.3% and Nasdaq losing -3.8%. Both remain in shaky positions
given a high weighting to a tech sector with extreme valuations, which has left them
open to a slump on any clear negative drivers, which so far this year have included
new AI developments in China. Small caps also declined, with the Russell 2000
sliding -4.2%, indicating the downturn was broad based, as opposed to recent
months where many risky sectors outperformed tech. This dragged down most of the
large TSXV stocks, although the GDXJ ETF of gold juniors was resilient even with the
small cap decline, adding 6.8%, and the GDX ETF of gold producers rose 4.8%.
Big Gold has strong Q4/24
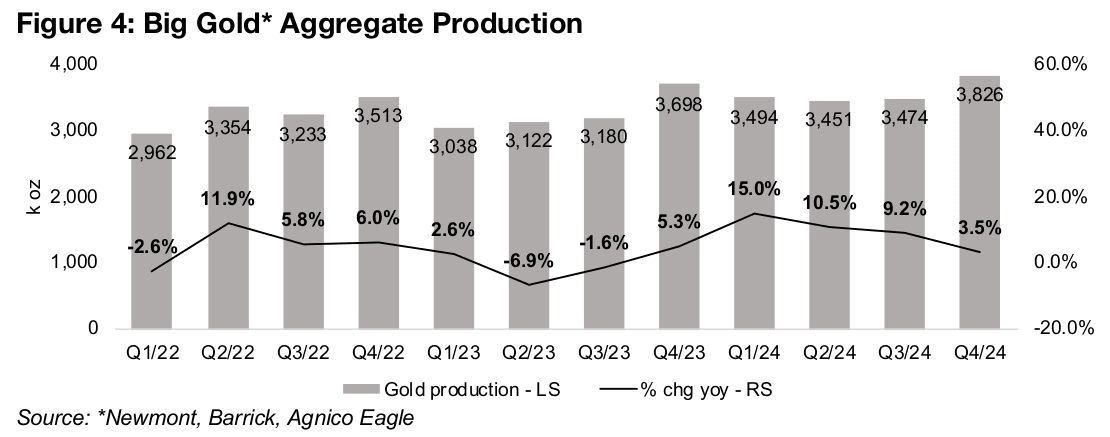
The Big Gold stocks, comprising Newmont, Barrick and Agnico Eagle, had very strong fourth quarter results, with the former two beating estimates but the latter missing expectations. Aggregate production growth was 3.5% yoy and while this has slowed from the recent 15.0% peak in Q1/24, the strong growth in 2024 and 2022 were exceptional periods (Figure 4). The rise in 2022 was driven by Agnico Eagle’s acquisition of Kirkland which was completed in February 2022, and in 2024 Newmont boosted production. As long-term global production growth for the industry averages about 2.0% per year, the Q4/24 level was still relatively robust.
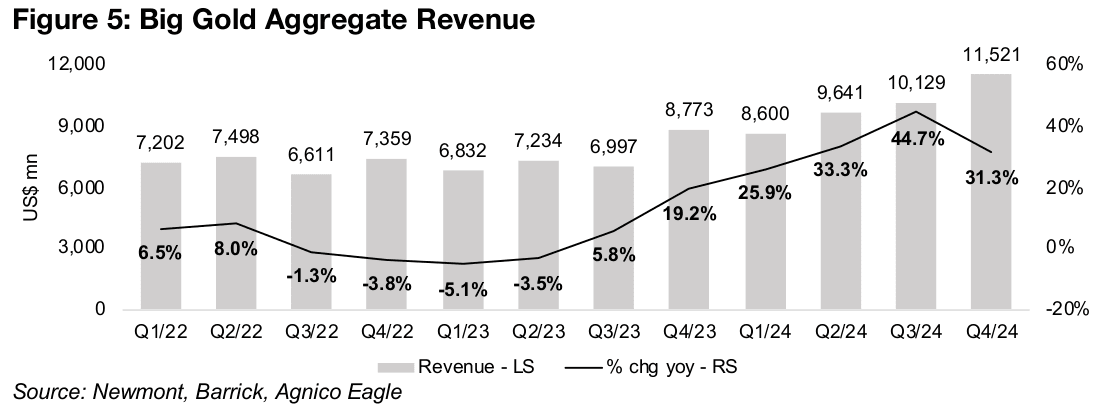
Strong revenue growth continues while costs ease
The extremely strong revenue growth that we have seen for the past year continued,
with a 31.3% rise yoy to US$11,521mn, although this was down from 44.7% in Q3/24
(Figure 5). This was because of the production growth decline, as the realized gold
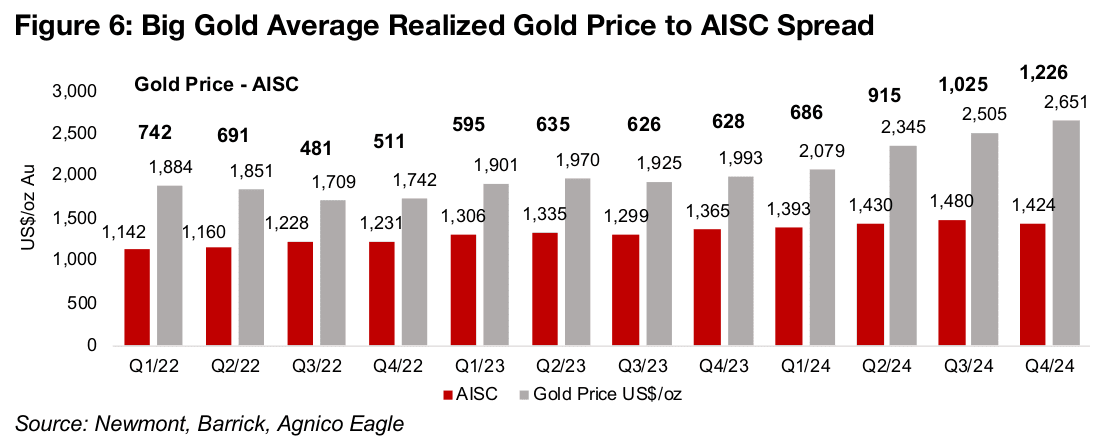
price continued to see a major rise both yoy and qoq, to US$2,651 /oz (Figure 6).
Cost issues also eased, with the all-in-sustaining-cost (AISC) per ounce actually
declining quarter on quarter for the first time in several years to US$1,424/oz, after a
long uptrend on the back of the rise in global inflation.
This saw the realized gold price to AISC spread, which indicates the core level of
profitability, rise about US$200/oz to US$1,226/oz. A continued increase in inflation
driving up costs and closing the gold price to AISC gap had been a market concern
through 2023 and H1/24. This has clearly become less of an issue in Q4/24 given the
jump in gold and a rise in core profitability to nearly double the levels of the first three
quarters of 2023. With gold continuing to surge in early Q1/25, and global inflation
remaining only slightly elevated, with an increase of around 3.0% yoy, it seems likely
that this gold to AISC gap could widen further this quarter.
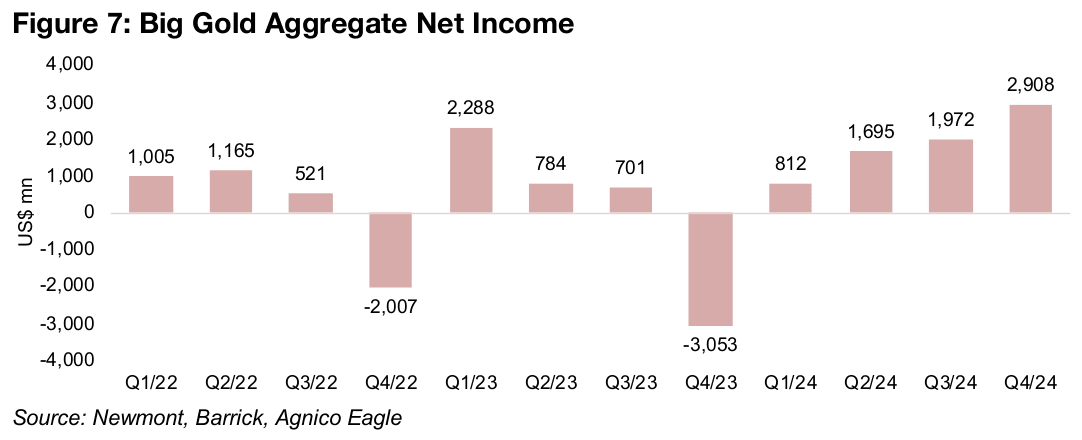
The rise in core profitability translated into nearly a US$1.0bn rise in net income for Big Gold, to US$2,908mn, up 47.5% qoq from US$1,972mn in Q3/24, with the leverage of a strong gold price above a relatively fixed cost base gaining momentum over the past three quarters. (Figure 7). The Q4/23 loss of US$-3,053mn is not entirely comparable as it includes large exceptional items, as does the major Q4/22 loss, with both not representative of the core operational performance. The last time profitability was near the Q4/24 level was in Q1/23 at US$2,288mn, although this was also affected by exceptional items, but gains, rather than losses.
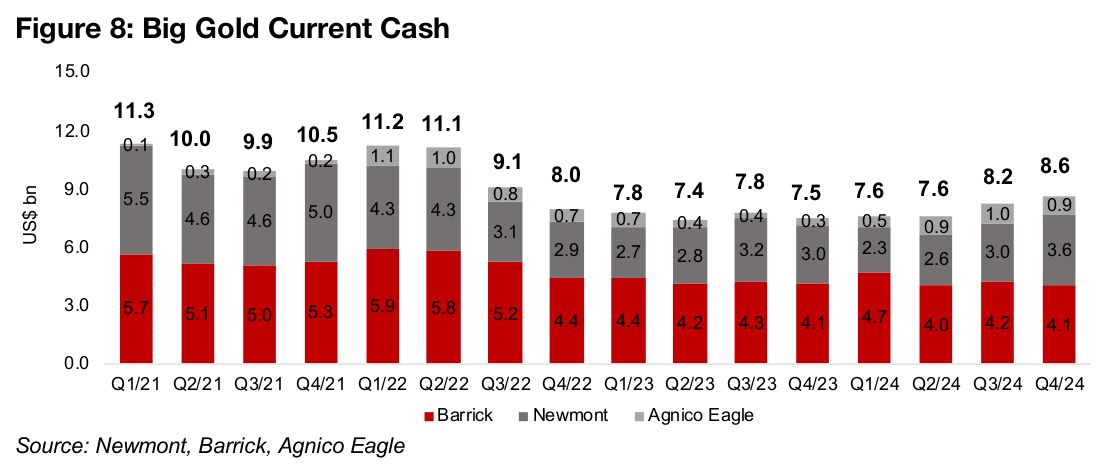
Big Gold’s total cash rose to US$8.6bn, a level not reached since Q3/22. Most of this continues to be Barrick and Newmont with US$4.1bn and US$3.6bn, respectively, while Agnico Eagle holds just US$0.9bn (Figure 8). This is generally a good sign for juniors as it gives these companies plenty of financial flexibility to make many acquisitions. Assuming that the average junior that a major would consider purchasing would have a market cap of US$250-US$500mn, these three companies alone could do between about 17-34 such deals with the current cash.
Newmont the main driver of Big Gold of results
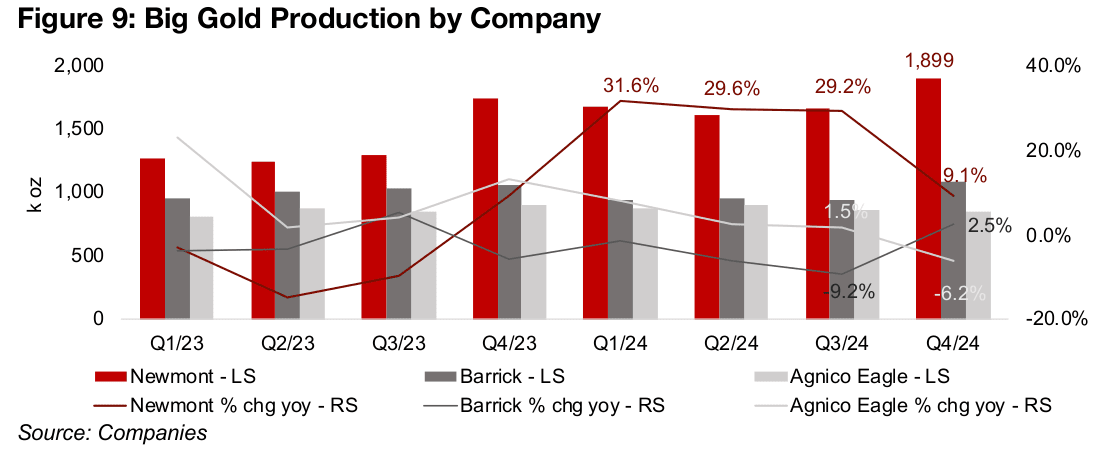
Newmont has been the main driver of Big Gold’s results, with the highest production growth at 9.1% yoy in Q4/24, and this even this is down from growth around 30% for the first three quarters of 2024 (Figure 9). The company had by far the highest production of the three, at 1,899k oz Au, versus 1,080k oz Au for Barrick and 847k oz Au for Agnico Eagle. Barrick’s growth increased to 2.5% in Q4/24 from -9.2% in Q3/24 and Agnico Eagle’s declined to -6.2% from 1.5% over the same periods.
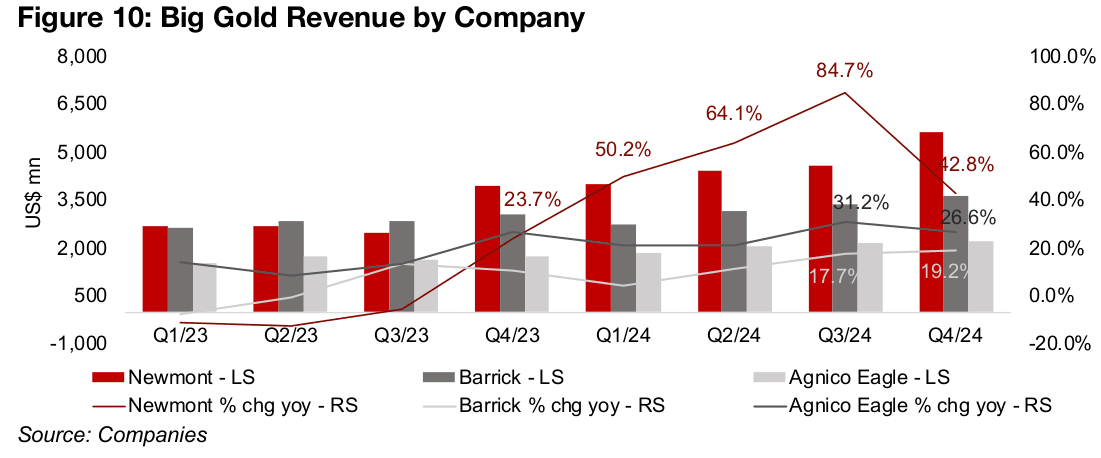
Newmont has also been the largest driver of revenue for Big Gold, with growth of 42.8% yoy for Q4/24 (Figure 10). While this is still the strongest of the three companies, it is a decline from the gains over the first three quarters of 2024 at 50.2%, 64.1% and 84.7%. While lower than Newmont, the other two companies have also had reasonably strong growth over the past two quarters, at 31.2% in Q3/24 and 26.6% in Q4/24 for Barrick and 17.7% and 19.2% for Agnico Eagle over the same two periods.
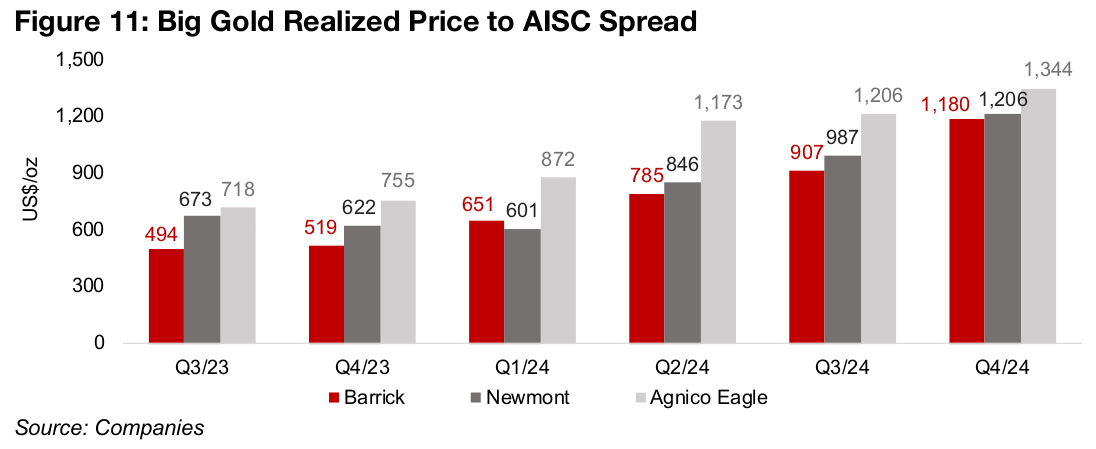
The spread between the realized gold price and all-in-sustaining cost rose substantially in Q4/24 for Newmont, Barrick and Agnico Eagle, respectively, to US$1,344/oz, US$1,206/oz and US$1,180/oz, continuing a four quarter uptrend (Figure 11). For the Newmont and Barrick, there was actually a decline qoq in AISC, which may have surprised markets after a considerable rise over the first three quarters of 2024, although for Agnico Eagle, AISC was relatively flat. For all three companies, the realized gold price rose significantly on the gain in the metal in Q4/24.
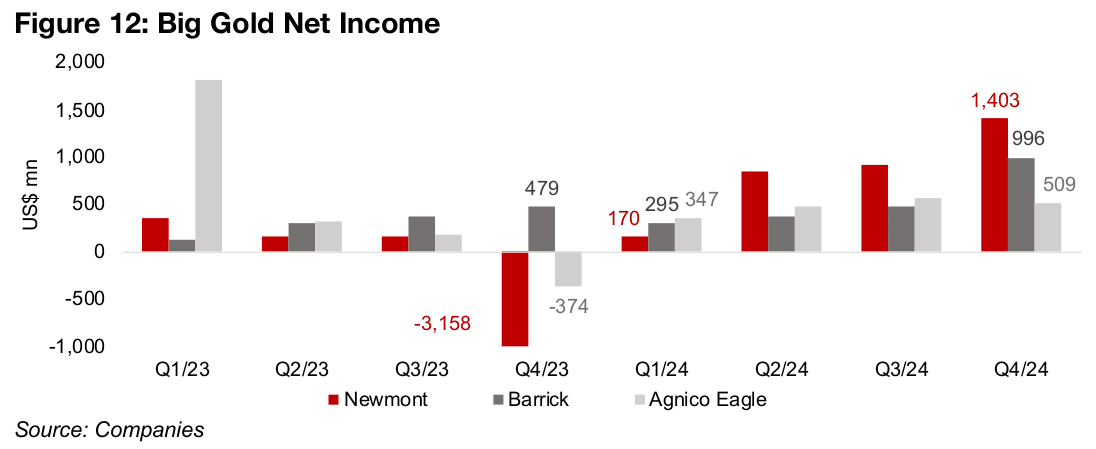
This rise in core profitability fed through strongly to the bottom line for Newmont, which saw the largest gain in net income qoq, up by over 50% to US$1,403mn, and a huge reversal yoy from a US$-3,158mn loss in Q4/23 on exceptional items (Figure 12). Barrick’s net income growth was even stronger, more than doubling to US$996mn qoq, but Agnico Eagle’s profit actually dropped moderately, down -10% to US$509mn, given the rise in core operating costs, while the other two companies saw their AISC decline.
Big Gold share prices rebound in 2025, but valuations overall still subdued
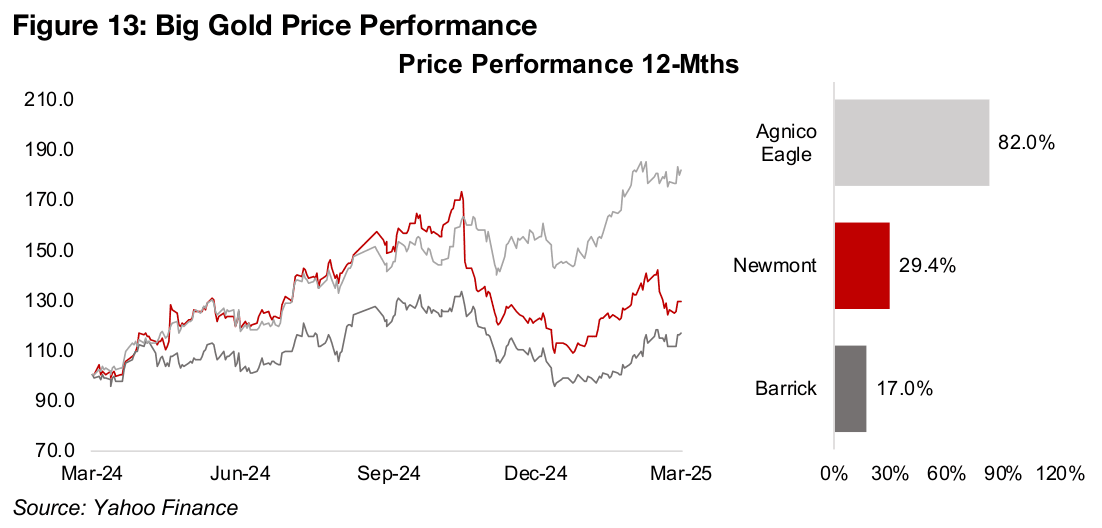
The continued rise in the gold price has driven a major rebound in the share prices of Big Gold this year, after a slump from October 2024 to December 2024 that was mainly driven by rising cost concerns and affected mainly Newmont and Barrick. Agnico Eagle has seen the strongest gains, up 82.0% over the past twelve months, while Newmont has increased 29.4% and Barrick has risen 17.0% (Figure 13).
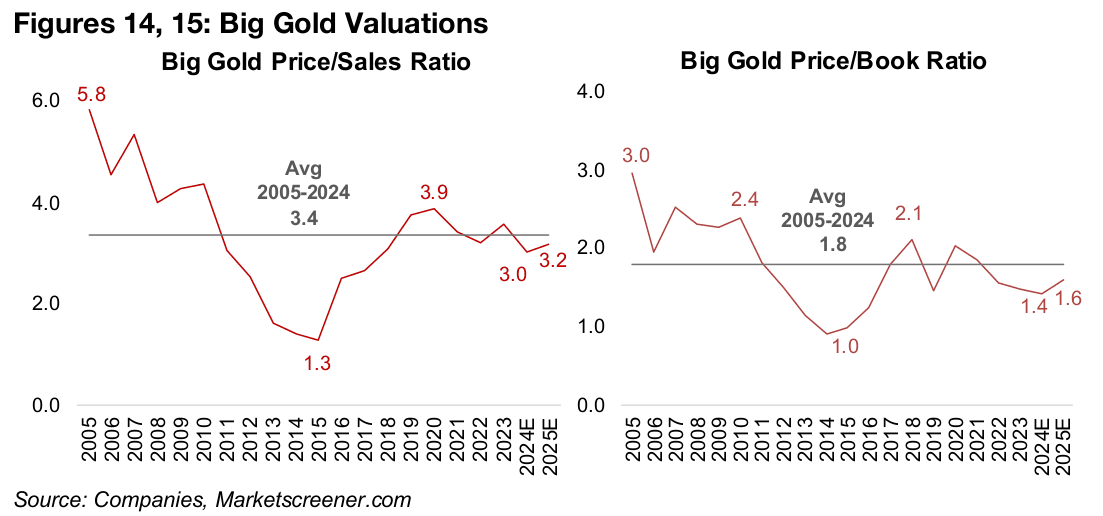
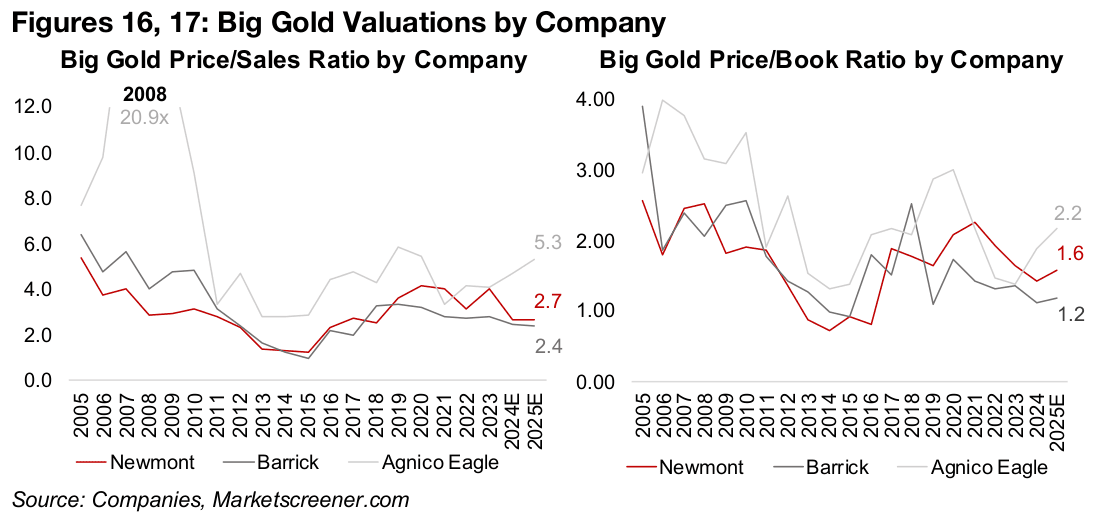
Big Gold’s market cap weighted valuations, with a Price/Sales (P/S) at 3.2x and Price/Book (P/B) at 1.6x, trade near the long term averages of 3.4x and 1.8x, not indicating extreme under or overvaluation (Figures 14, 15). However, Agnico Eagle pulls up the averages with a P/S ratio of 5.3x and P/B of 2.2x, compared to Newmont and Barrick’s lower P/S of 2.7x and 2.4x, and P/Bs of 1.6x and 1.2x (Figure 16, 17).
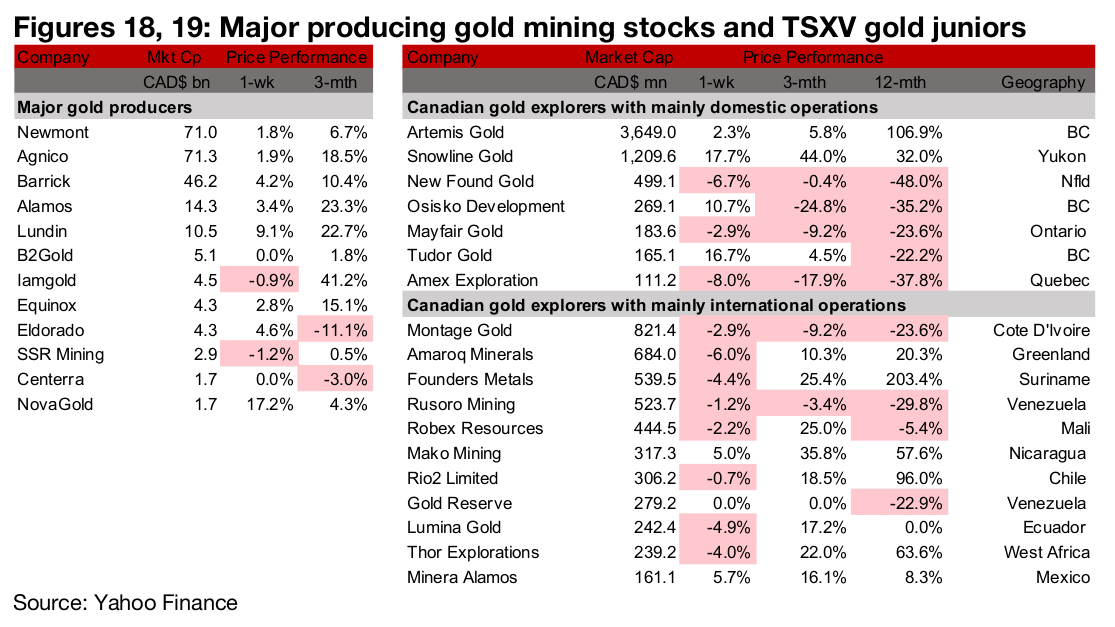
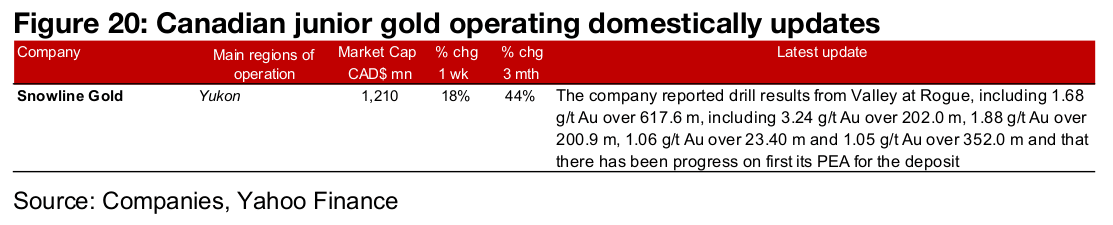
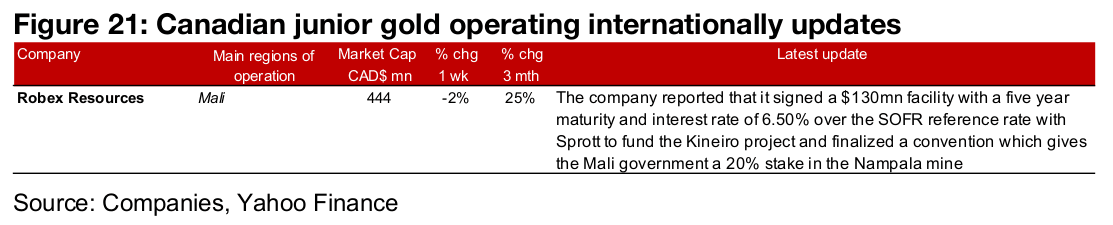
Major gold producers mostly rise, TSXV Gold mainly down
The major gold producers mostly rose, but the TSXV gold stocks were mainly down as the metal rose but equities declined (Figures 18, 19). For the TSXV gold companies operating domestically, Snowline reported drill results from Valley at Rogue and progress on its PEA for the project (Figure 20). For the TSXV gold companies operating internationally, Robex signed a US$130mn facility with Sprott and finalized a convention giving the Mali government a 20% stake in the Nampala mine (Figure 21).
Disclaimer: This report is for informational use only and should not be used an alternative to the financial and legal advice of a qualified professional in business planning and investment. We do not represent that forecasts in this report will lead to a specific outcome or result, and are not liable in the event of any business action taken in whole or in part as a result of the contents of this report.