July 15, 2024
Big PGM Struggles
Author - Ben McGregor
Gold price up on dovish Fed talk and easing inflation
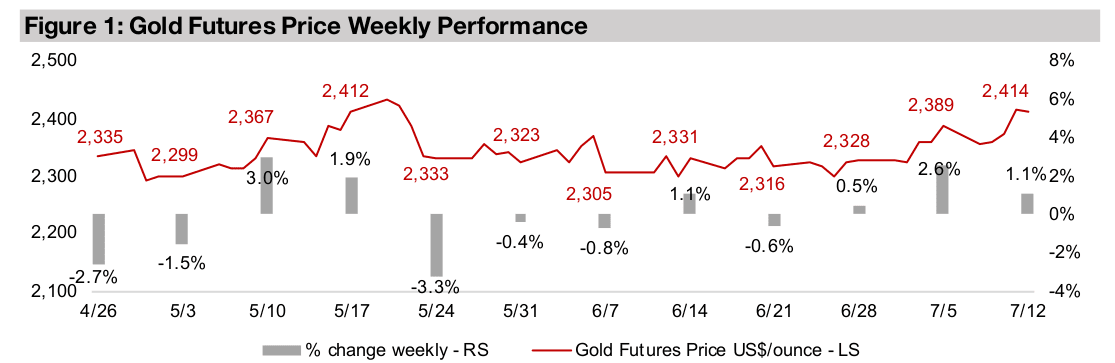
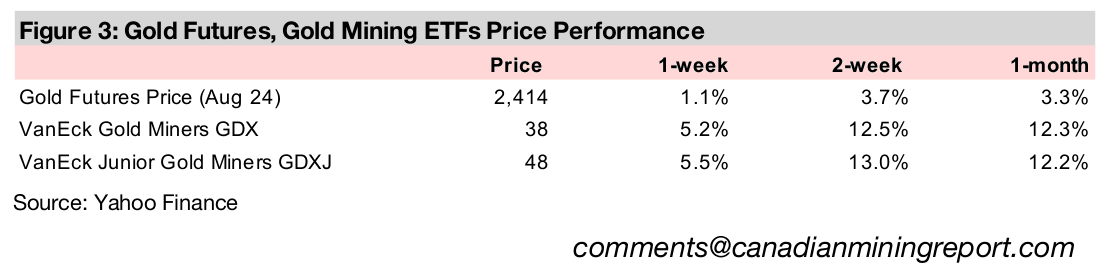
The gold price rose 1.1% to US$2,414/oz, again breaking through US$2,400/oz after hovering just below this level for about three months, on comments from the Fed Chairman that were taken as dovish by the markets and easing US CPI inflation.
‘Big PGM’ underperforms on weak platinum and palladium
This week we look at the Q1/24 platinum market data recently released by the World Platinum Investment Council and the performance of the ‘Big Platinum Group Metals’ stocks, which has been hit by weak by relatively weak platinum and palladium prices.
Gold stocks up on metal and equities gains
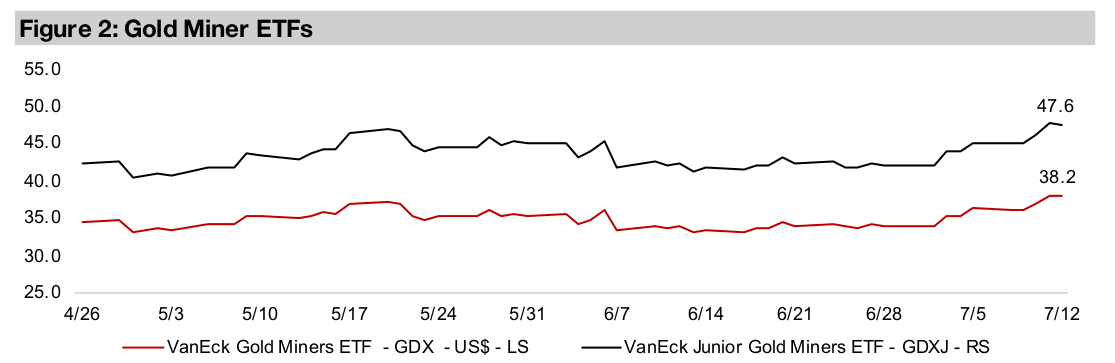
The gold stocks were up with the GDX gaining 5.2% on the rise in the metal and large caps, with the S&P 500 up 0.8%, while the GDXJ increased 5.5%, supported by the largest jump in small cap stocks in several months, with the Russell 2000 up 5.4%.


Big PGM Struggles
Gold rose 1.1% to US$2,414/oz, once again breaking through the key US$2,400/oz level, which it has hovered just below for most of the past three months. This came after remarks by Fed Chairman Powell to the Senate Banking Committee and the House Financial Services Committee that were taken by the market as relatively dovish. A US Inflation report which showed a continued easing in the CPI for June 2024 further bolstered the upbeat sentiment. Equity markets rose on this news, with the S&P 500 up 0.8% and small caps seeing one of its strongest weeks in several months, up 5.4%. Interestingly, the tech sector, which has been the main driver of the market for 2024, did not participate much in the rally, with the Nasdaq slumping mid-week and ending up just 0.14%. Gold stocks continued up, with the GDX rising 5.2% and GDXJ 5.5%, boosted by the gains in the metal and equities.
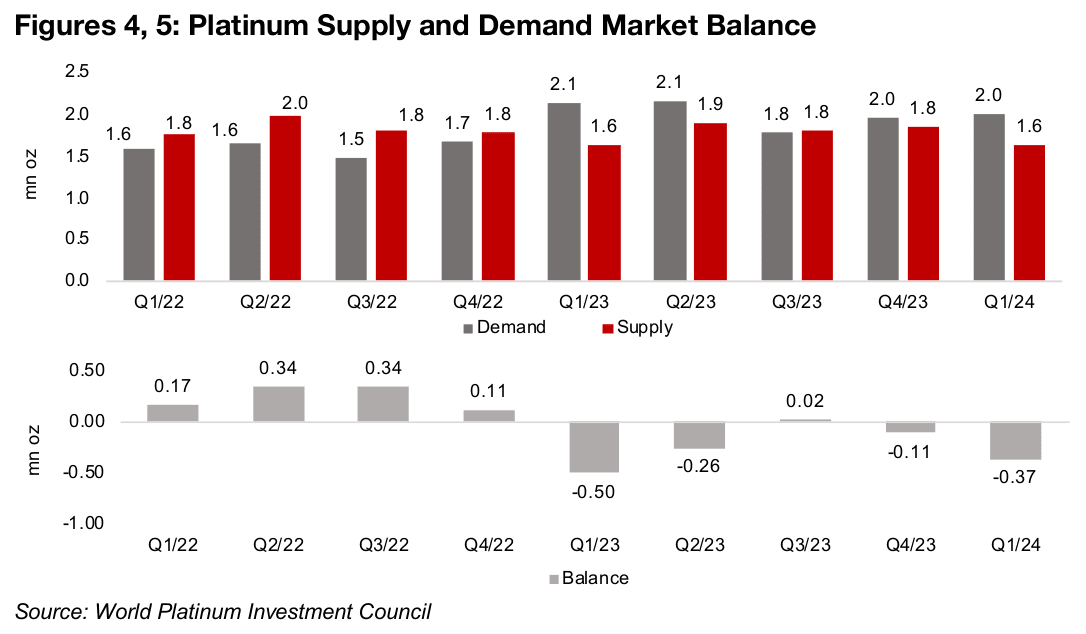
Platinum deficit widens in Q1/24
The World Platinum Investment Council (WPIC), a key source of forecasts on the metal, recently released its Q1/24 report on the sector. It showed a widening deficit for the quarter to -0.37mn oz, with global supply, including recycling, of 1.6 mn oz versus demand of 2.0 mn oz (Figures 4, 5). The market has tended towards undersupply for the last six quarters, with four in deficit and two with just marginal surpluses in Q4/22 and Q3/23. The last period of clear surplus was in first three quarters of 2022. For the full year 2024 the WPIC expects a deficit of -0.48 mn oz, with the estimate widening over the past two quarters from -0.35 mn oz in Q3/23, when it first released its 2024 forecast (Figure 6).
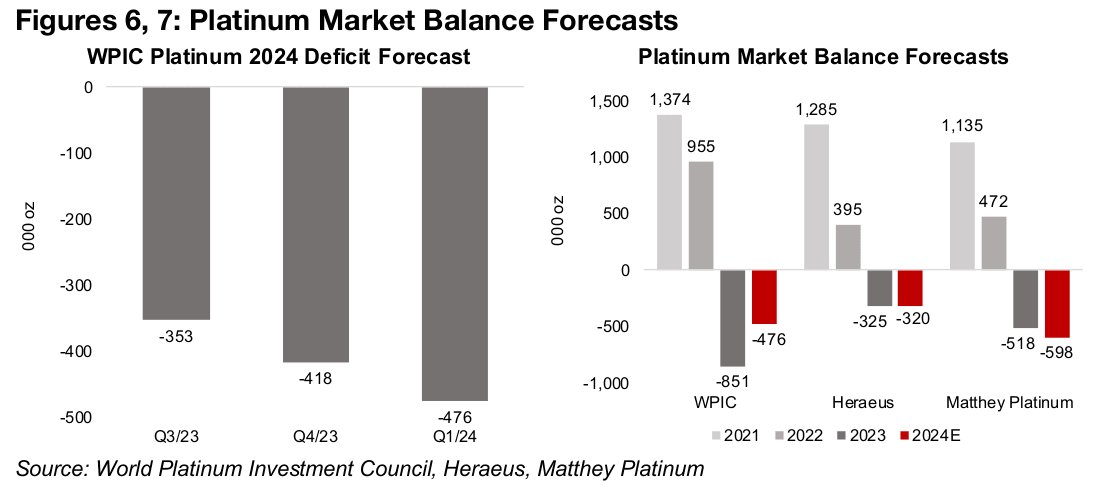
While the WPIC has the most timely and detailed platinum data and forecasts, given a quarterly release and quarterly detail, there are also estimates from Heraeus and Matthey Johnson. While there are differences across all three even for the historical data, the trend is consistent, with a major surplus in 2021 which contracts in 2022, followed by deficits in 2023 and 2024 (Figure 7). WPIC’s deficit for 2023 is much wider than the other sources for 2023 at -0.85mn oz, although it also forecasts the largest contraction in 2024. Heraeus estimates a near flat -0.32 mn oz deficit year on year 2024, and Matthey Platinum the highest deficit, at -0.60 mn oz, widening from 2023. If the market is baking in the average of these sources of about -0.5 mn oz for 2024, evidence of a deficit wider than this level could drive up the price, and vice versa.
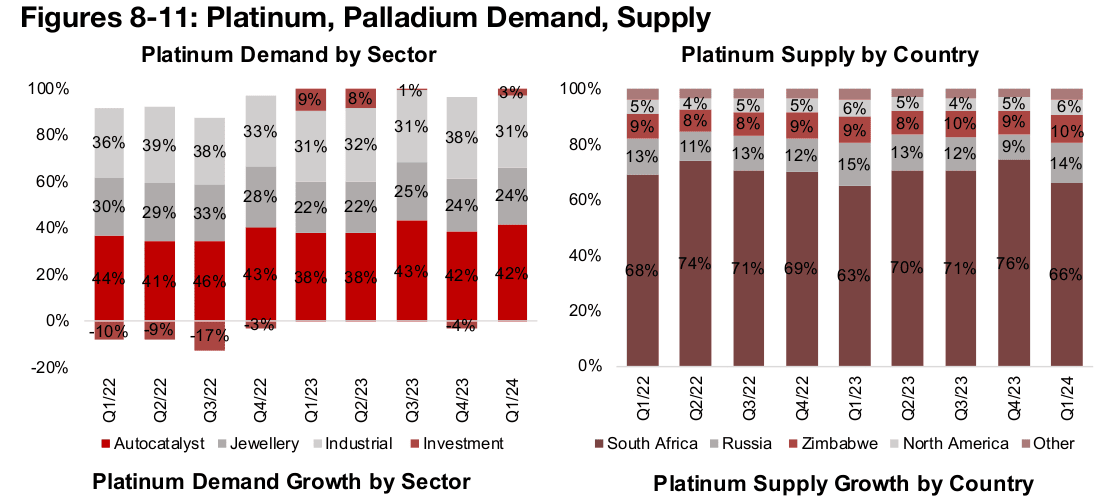
Autocatalysts the largest single driver of platinum demand
On the demand side, the single largest driver for platinum is for use in autocatalysts,
averaging 42% of the total since 2022, although other industrial uses and jewellery
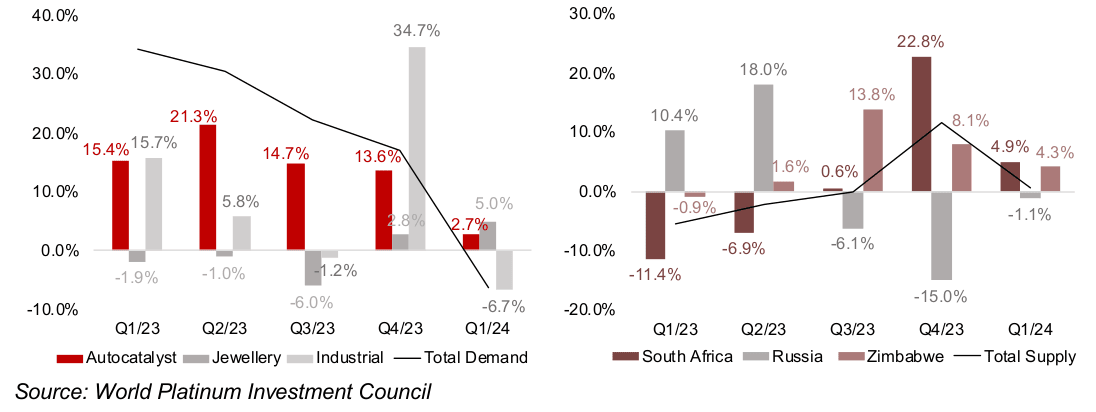
are also significant contributors, at 34% and 26% (Figure 8). Strong autocatalyst
demand had been the main driver of growth in 2023, with a double digit rise year on
year in each quarter, and the contribution from other sectors mixed (Figure 10).
However, in Q1/24, autocatalyst demand weakened considerably to low single digits,
sending overall demand growth negative.
On the supply side the main driver is South Africa, accounting for 70% of supply on
average since 2022, followed by Russia, at 12%, and Zimbabwe, at 9% (Figure 9).
Weak South African output drove overall supply growth negative year on year for first
two quarters of 2023, offsetting gains in Russia (Figure 11). Supply growth was near
flat in Q3/23 as the increase from South Africa was just above zero, but surged in
Q4/24 as output from the country jumped 20%. Supply growth was again near flat in
Q1/24 with South Africa and Zimbabwe up around 5.0% but other regions ranging
from no gains to a slight contraction.
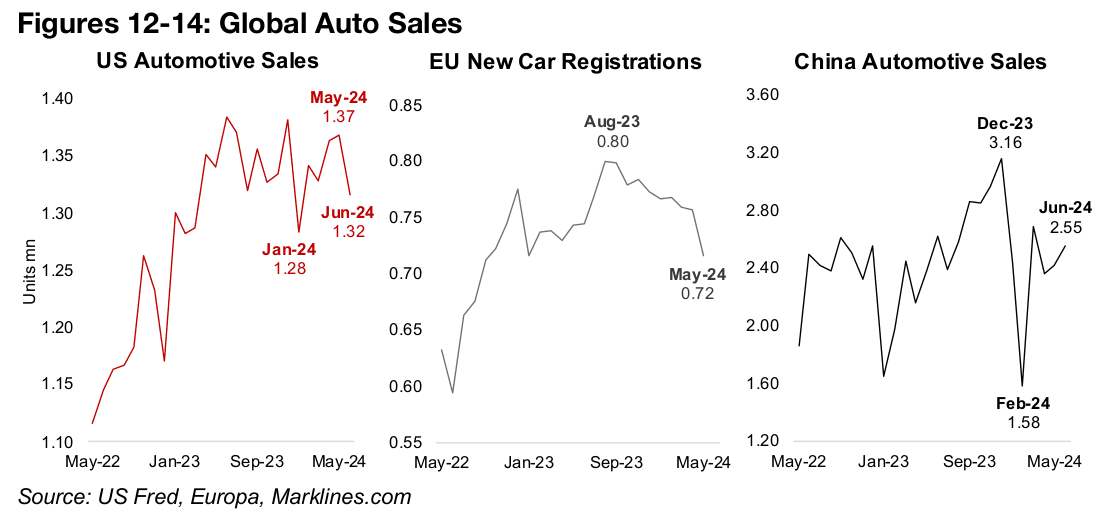
Global auto sales showing some signs of cooling
Global auto sales are a major indicator for autocatalyst demand growth, especially for the US and Europe. China auto sales are less of a direct indicator as electric vehicles, which do not use autocatalysts, are a much larger proportion of the total auto sales in the country. Global auto sales in both the US and Europe saw large increases from mid-2022 to mid-2023. However, over the past twelve months, while US sales remain at a reasonably high level, they have broadly flattened, and Europe’s new passenger car registrations have slowed considerably (Figures 12, 13). China’s auto sales rose through 2023 and slumped briefly in February 2023 before recovering quickly, but are still substantially off December 2023 highs (Figure 14).
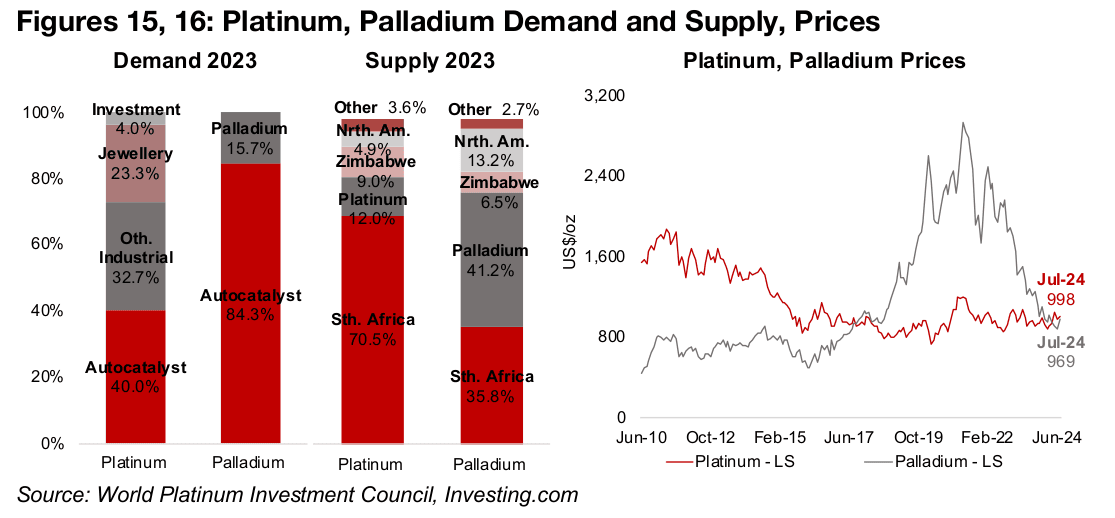
Auto industry’s substitution towards platinum versus palladium
Both platinum and palladium can be used in autocatalysts and can be substituted for
each other at roughly a one to one ratio. This has driven considerable shifts in demand
for the two metals from the auto industry based on their relative price levels.
Palladium can be more affected by this substitution as by far the majority of its
demand is from autocatalysts, at over 80%, versus just 40% for platinum (Figure 15).
Relatively high platinum prices drove auto industry substitution towards palladium
from 2010 to 2017. However, this led to the palladium price rising far above platinum
starting from 2018, exacerbated by the global health crisis and concerns over supply
from Russia, the largest source of global palladium, at over 40%, after the 2022
Ukraine invasion. This has given the auto industry a strong incentive over the past
several years to substitute back towards platinum. Along with the fears of Russia
supply constraints proving to be overblown, this led to a plunge in the palladium price
since 2022. From 2017 to 2024 the platinum price was relatively flat, and the reversal
in palladium has driven a convergence in the two prices, and over the past month
platinum moved ahead of palladium for the first time in since 2017.
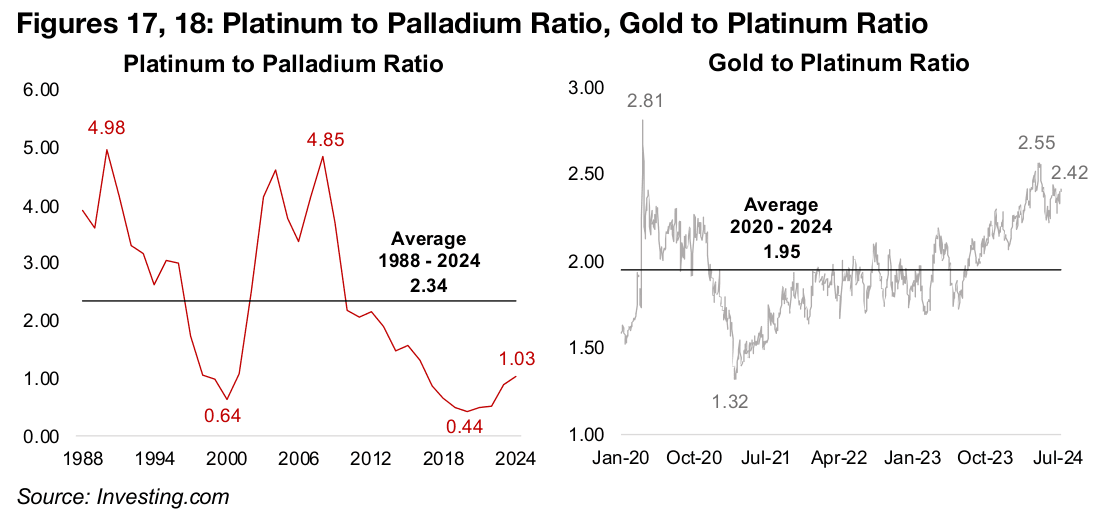
Platinum to palladium ratio low, platinum to gold high, versus history
In a historical context, the move in the platinum to palladium ratio from 2010-2024
has not been extreme, starting the period at just over 2.0x, declining to 0.44x, and
rising back near 1.0x (Figure 17). Platinum reached nearly 5.0x the level of the
palladium twice since 1998, with the ratio averaging 2.34x. This implies that that
platinum could still move far above palladium before reaching what would historically
be considered a severe imbalance. Technological change has reduced the palladium
to platinum substitution ratio for autocatalysts from 2:1 twenty years ago to 1:1, which
could make it more difficult to reach the previous highs in the ratio. However, even
accounting for this change, there still appears to be significant room for a relative rise
in platinum given only a 1.0x ratio between the metals’ prices currently.
Another relative measure for the metal is the gold to platinum ratio, which at 2.42x is
well above the average of 1.95x from 2020-2024, and not far off the 2.81x highs for
the period in early 2020 (Figure 18). The movement in the platinum price is driven by
a mix of industrial and monetary factors, probably weighted to the former, while gold
is almost entirely driven by the latter. The market has likely focussed more on
platinum’s industrial drivers recently, especially autocatalysts. However, if a period of
economic distress occurs, it could give more weight to platinum as a store of value,
and drive a potential contraction in this ratio, even if gold continues to gain.
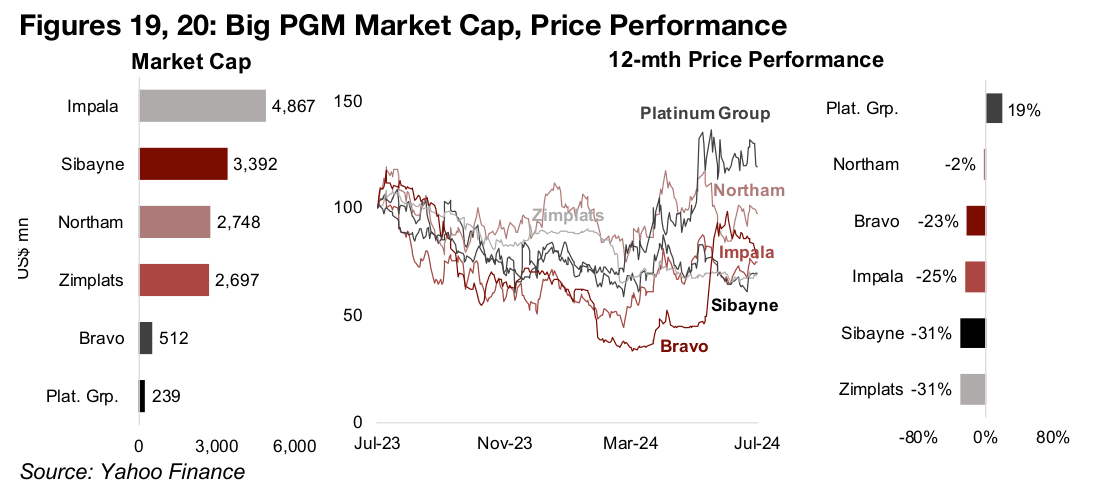
‘Big PGM’ stocks have struggled over the past year
The relatively flat platinum price and the slumping palladium price has meant that the
‘Big Platinum Group Metals (PGM)’ stocks have been reasonably weak over the past
year. Figures 19 and 20 include only the relatively ‘pure plays’ on the PGM metals.
Only Platinum Group Metals, one of the smaller market cap stocks of the group, has
gained, with Northam Platinum near flat. The rest of the group, including Impala,
Sibyane, Zimplats and Bravo have seen share price declines of -20% or more.
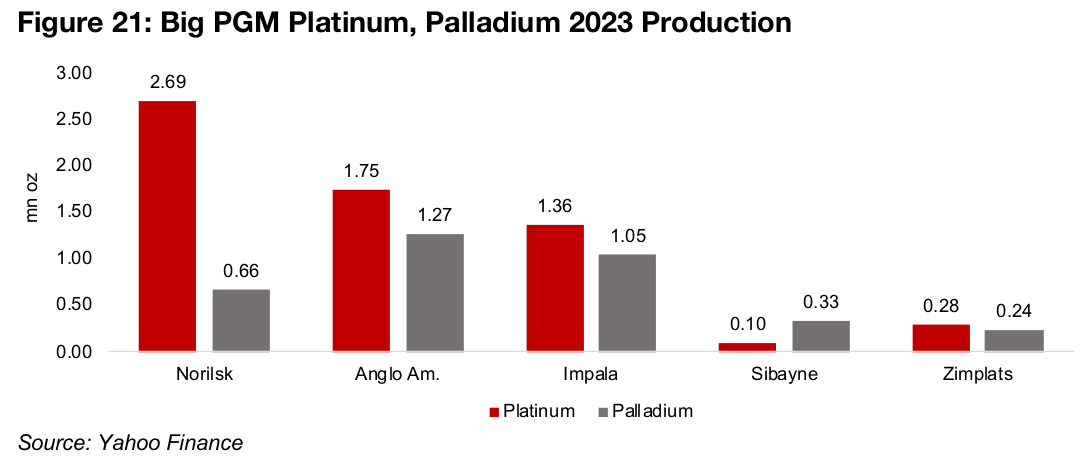
The two largest platinum players in terms of PGM production volume and market cap
are Anglo American and Norilsk Nickel, but these also have a large exposure to
several other metals. Norilsk’s PGM production is weighted towards platinum, with
output of 2.69 mn oz in 2023 and only 0.66 mn oz of palladium, for a combined 3.35
mn oz (Figure 21). Anglo American is more balanced between the two metals, at 1.75
mn oz platinum and 1.27 mn oz palladium, for a combined 3.02 mn oz.
Impala is the next largest producer, also roughly balanced between platinum and
palladium, at 1.36 mn oz and 1.05 mn oz for a total 2.41 mn oz. Sibyane and Zimplats
are relatively smaller players, with a total 0.52 mn oz and 0.43 mn oz combined
production. There is limited detailed production data split by metals in the reports
issued by Northam Platinum and Platinum Group Metals and Bravo Mining is still at
the pre-production stage.
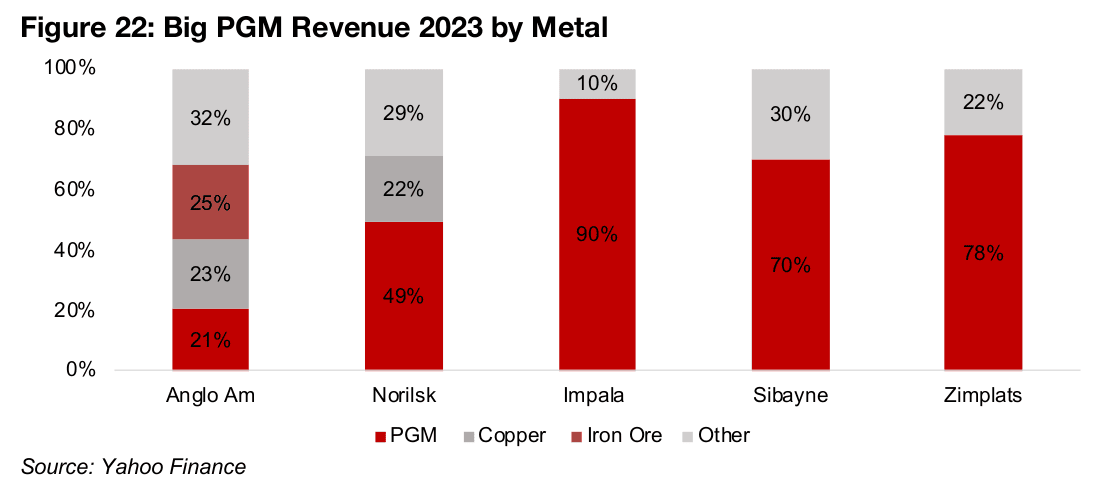
Anglo American is the largest market cap player in PGM, at US$41.2bn, but generates only 21% of its revenue from the sector, with a large contribution from copper, iron ore, and other metals, at 23%, 25% and 32% of the total (Figure 22). Norilsk Nickel is second largest by market cap at US$24.bn, and generates almost 50% of its revenue from PGM, but half also comes from copper and other metals.
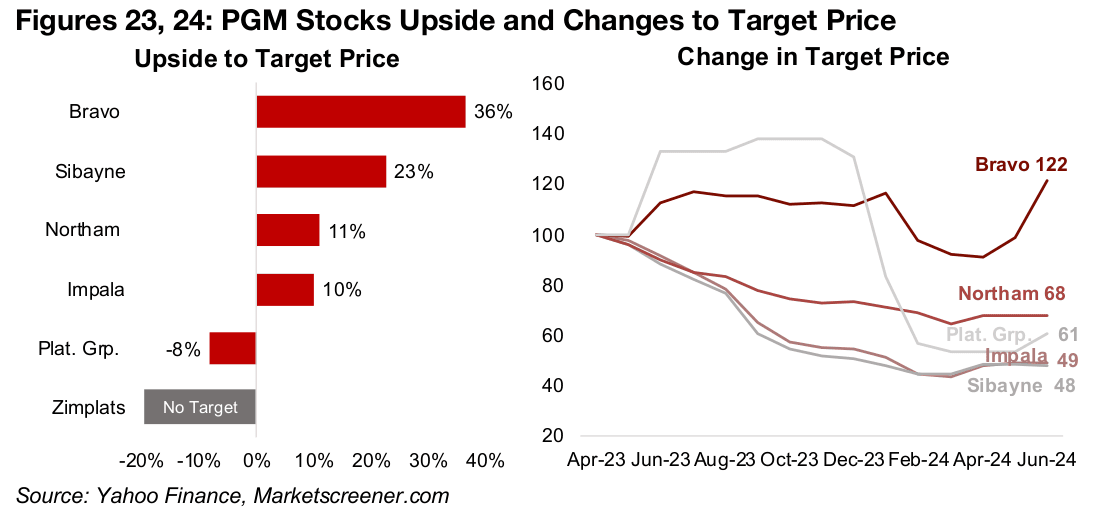
The target prices for most of the sector indicate moderate upside except for Platinum Group Metals, which the market sees as above fair value after its share price run up (Figure 23). The stagnant platinum price and palladium price plunge has driven downgrades of targets for most the companies (Figure 24). Only Bravo Mining has seen upgrades, as it is still pre-production and its price is influenced by advancing its project through specific development stages in addition to moves in metals prices.
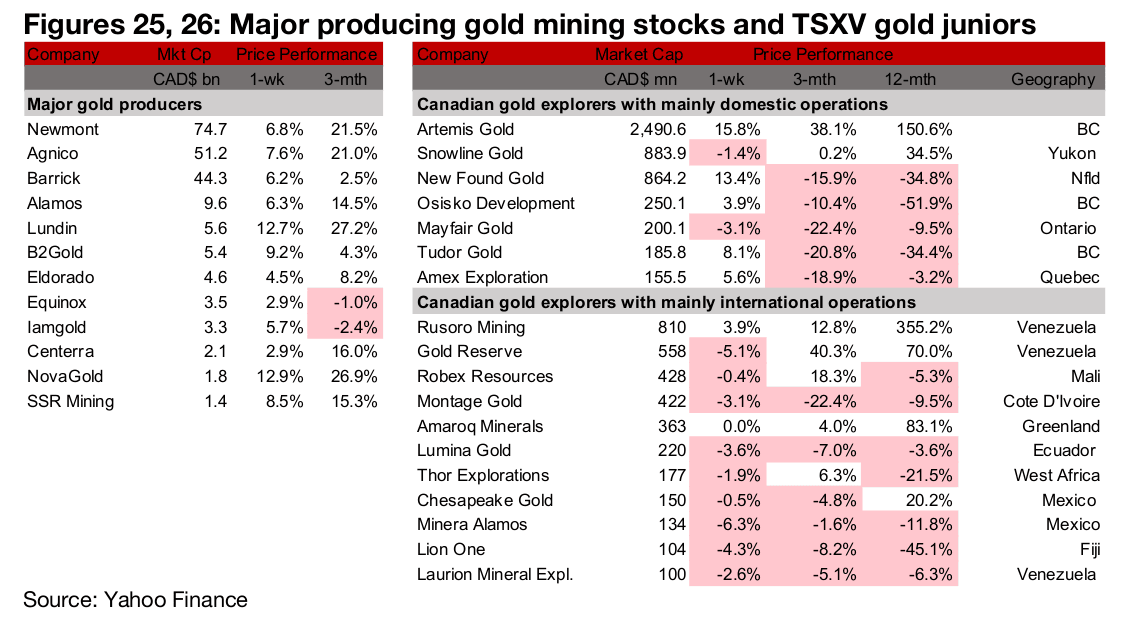
Producers all gain but most TSXV large gold down
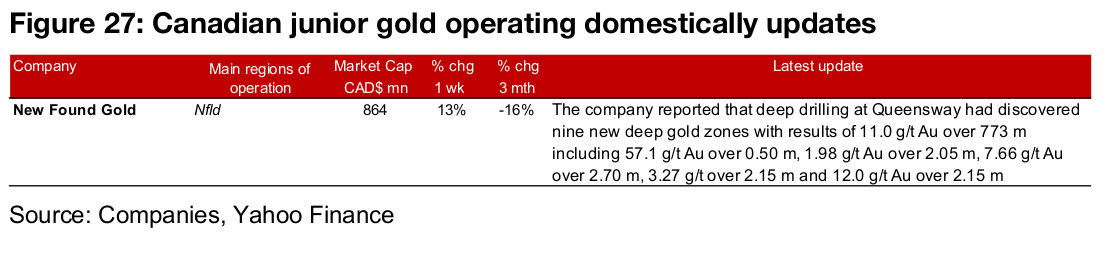
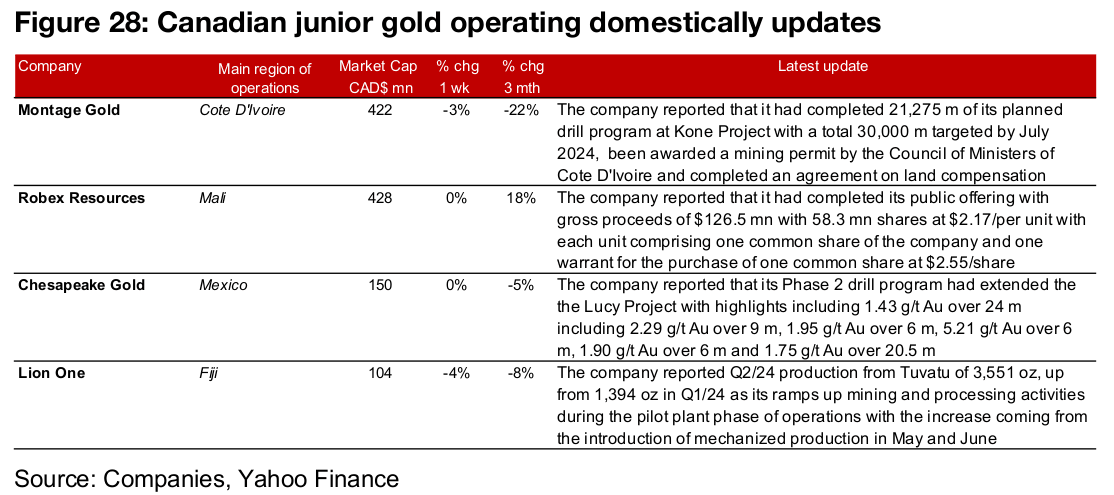
The major producers all rose but most of large TSXV gold was down (Figures 25, 26). For the TSXV gold companies operating domestically, New Found Gold reported the discovery of nine new deep gold zones at Queensway (Figure 27). For the TSXV gold companies operating internationally, Montage Gold provided an update on drilling at Kone and that it had been awarded a mining permit for the project and completed an agreement on land compensation. Robex completed its $126.5 mn public offering, Chesapeake released results from its Phase 2 drill program at the Lucy Project and Lion One reported Q2/24 production from Tuvatu (Figure 27).
Disclaimer: This report is for informational use only and should not be used an alternative to the financial and legal advice of a qualified professional in business planning and investment. We do not represent that forecasts in this report will lead to a specific outcome or result, and are not liable in the event of any business action taken in whole or in part as a result of the contents of this report.