November 04, 2024
Big Gold Q3/24 Results Strong So Far
Author - Ben McGregor
Gold near flat as US employment weakens
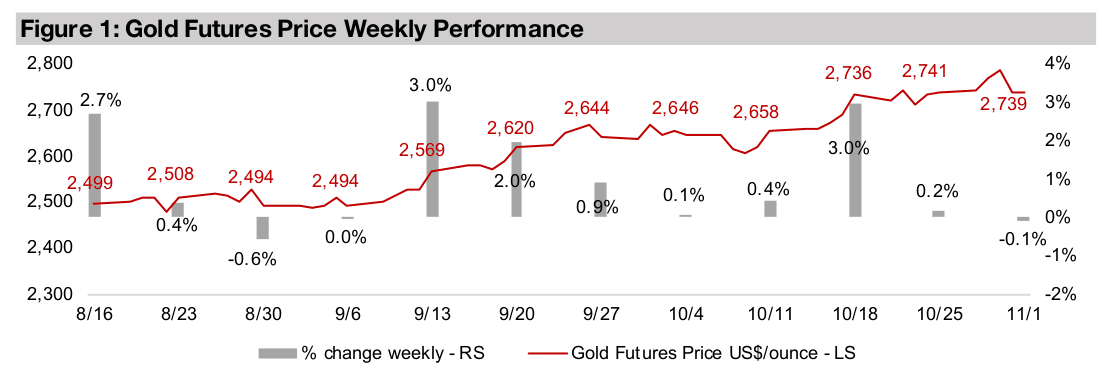
Gold was near flat, down -0.1% to US$2,739/oz, and remained near this level for the third consecutive week, as US employment data slumped, potentially giving the US Fed justification for more rate cuts, which counterbalanced the high US$ and yields.
Newmont and Agnico Eagle report strong Q3/24, but costs rising
The Q3/24 results season is underway, with both Newmont and Agnico Eagle reporting a strong quarter driven by the surge in the gold price, although the share prices of both actually declined after the releases as markets focussed on rising costs.


Big Gold Q3/24 Results Strong So Far
The gold price was near flat, up -0.1% to US$2,739/oz, and held around this level for
the third week after the huge run up from mid-September 2024 to mid-October 2024.
The most major economic release was US employment data, which shocked to the
downside and may have supported gold, as a weakening US jobs outlook gave the
Fed more justification for further rate cuts. This implies a continued rise in the money
supply, which is a major gold price driver, and may have also offset other drivers
moving against the metal including a higher US$ and higher bond yields.
Even though the news implied lower rates, which could help boost equities, it also
implied a weaker economy and potentially lower earnings, which are negative drivers
for stocks. The market seemed to focus on the latter and equities declined, with the
S&P 500 down -1.8%, the Nasdaq falling -2.2% and Russell 2000 losing -0.3%. This
suggests the market may finally be considering bad economic news ‘bad’. This
contrasts with 2022 and 2023 during the rate hike cycle where bad economic news
was considered ‘good’ as it implied rates would be lowered. With a continued global
decline in rates potentially already priced in by markets, they may now be requiring
other catalysts. This seems to be part of a shift in sentiment towards more caution
and hedging of bets for markets this year, including the continued huge shift into gold.
Big Gold Q3/24 strong so far, but stocks still pull back
The Q3/24 results season has started for Big Gold, with two of the three largest companies in the sector, Newmont and Agnico Eagle, both reporting strong earnings, with big jumps in revenue on the rise in the gold price, and strong gains in net income (Figure 4). However, the market was actually unimpressed even with these stellar results, and both saw price declines after the results, with Newmont slumping -17.4% and Agnico Eagle declining-3.0% following their Q3/24 releases.
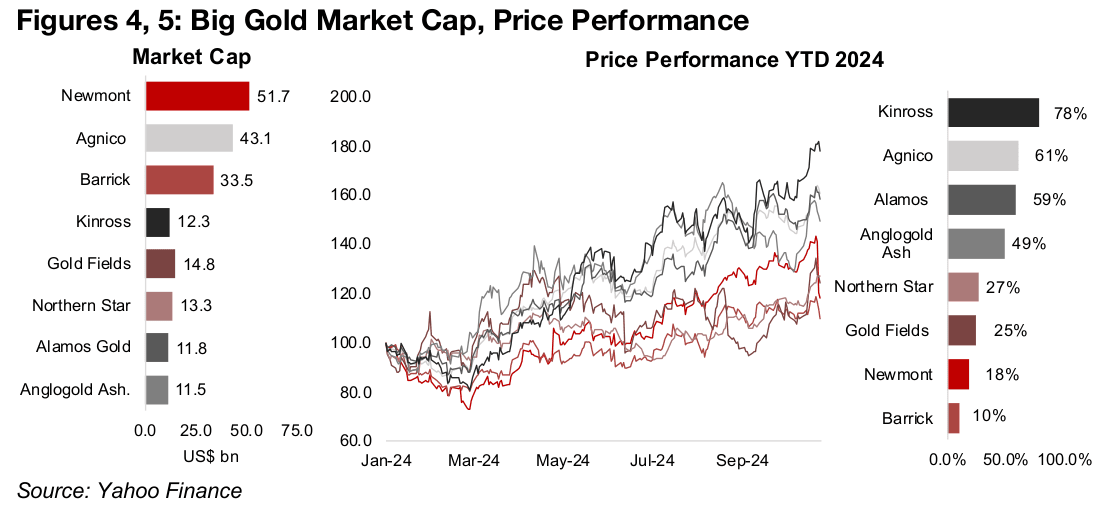
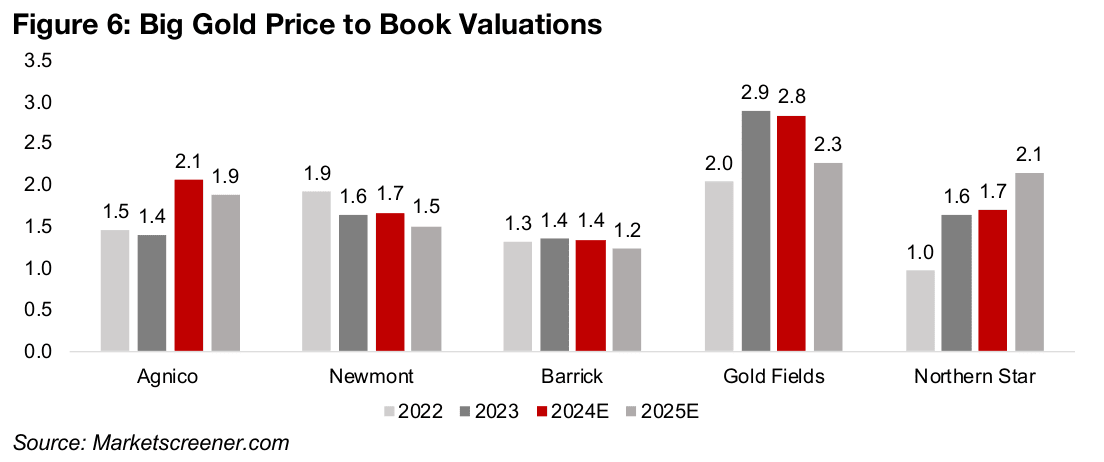
The market’s main concern seemed to be a rise in costs, although this was far outpaced by the rise in the gold price. This indicates that there is still caution on the sector, which can be seen by still subdued price to book valuations. We use P/B ratios to show changes in historical multiples here as they are more stable than price to earnings ratios, which can have huge swings, as net income is often affected by large non-core items like write-offs or asset sales for Big Gold, which do not reflect the core operations of the companies. Agnico Eagle trades at 2.1x for 2024E, Newmont at 1.7x, Barrick at 1.4x, Gold Fields at 2.8x and Northern Star at 1.7x (Figure 6). Only Gold Fields could be viewed as having a high price to book, with the rest the group still at quite low valuations, especially given the surge in gold.
Markets wary of gold price reversal short-term, resource depletion long-term
This suggests that the market still expects a reversal in gold medium-term and is
cautious on pricing in the recent rise as sustainable. We don’t expect a major pullback
to happen anytime soon, and believe that an average well above US$2,000/oz could
persist for many years given the return to monetary expansion by global central banks.
However, a reversal in gold is what would make the rising costs an issue, as the
market would certainly not expect costs to reverse once they have increased,
although the gold price theoretically could, and abruptly so, based on its history.
Another issue that could be keeping the multiples low, but looking much more long-
term, is that gold and other miners are in a perpetual battle against reserve depletion.
This could keep the market expecting that earnings really can’t grow that much very
long-term, especially factoring in a major pullback in metals prices at some point
during the cycle. So for now, markets refuse to get too excited about the strong gold
sector performance and price high expectations into multiples. Instead, they still
seem to be putting a lot of the hope for long-term earnings upside on the tech sector,
with many of the companies continuing to have outsized multiples.
Big Gold still undervalued overall versus Big Tech
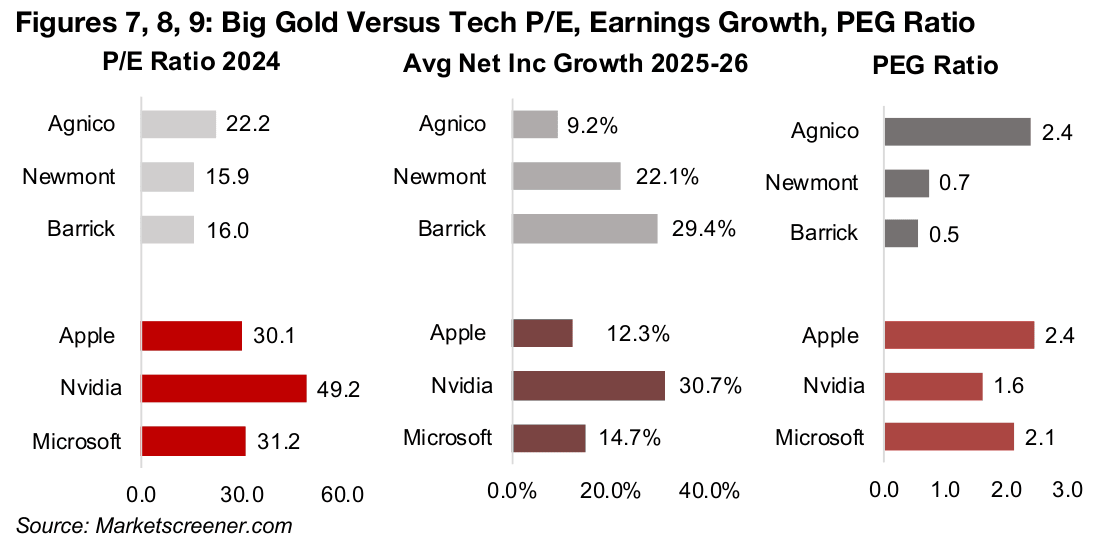
The average price to earnings multiples for Big Gold, at 22.2x for Agnico Eagle, 15.9x
for Newmont and 16.0x for Barrick, are at around half the levels of Apple, at 30.1x,
Nvidia at 49.2x and Microsoft at 31.2x (Figure 7). While we might expect these higher
P/E multiples to reflect much higher earnings growth for tech, this is not entirely the
case. While the expected average earnings growth for Agnico Eagle for 2025E-2026E
is low, at 9.2%, Newmont at 22.1% and Barrick at 29.4% are ahead of Apple and
Microsoft at 12.3% and 14.7%, with only Nvidia standing out at 30.7% (Figure 8).
The PE ratios can be adjusted for the growth rate by dividing by the average net
income growth, which is the PEG ratio. Agnico Eagle’s PEG ratio of 2.4x is relatively
high even versus the tech sector, at the same level as Apple. However, both Newmont,
at 0.7x and Barrick, at 0.5x, are far lower than the tech sector, with Nvidia at 1.6x and
Microsoft at 2.1x (Figure 9). While this implies that the gold sector may be
undervalued relative to tech, these estimates are only for the next two years. The
depletion of reserves factor may be playing a role again here, with the tech stocks
theoretically able to keep growing for a long period and not limited by the need the
replace resources. However, they could face a loss of market share due to changes
in technology over time that could similarly reduce their earnings potential.
Newmont’s Q3/24 growth huge, but costs jump
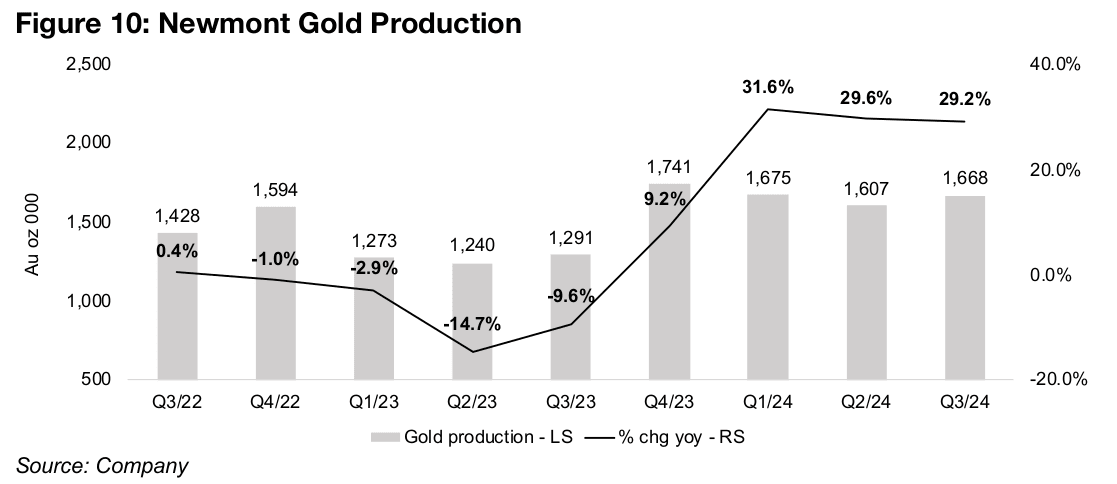
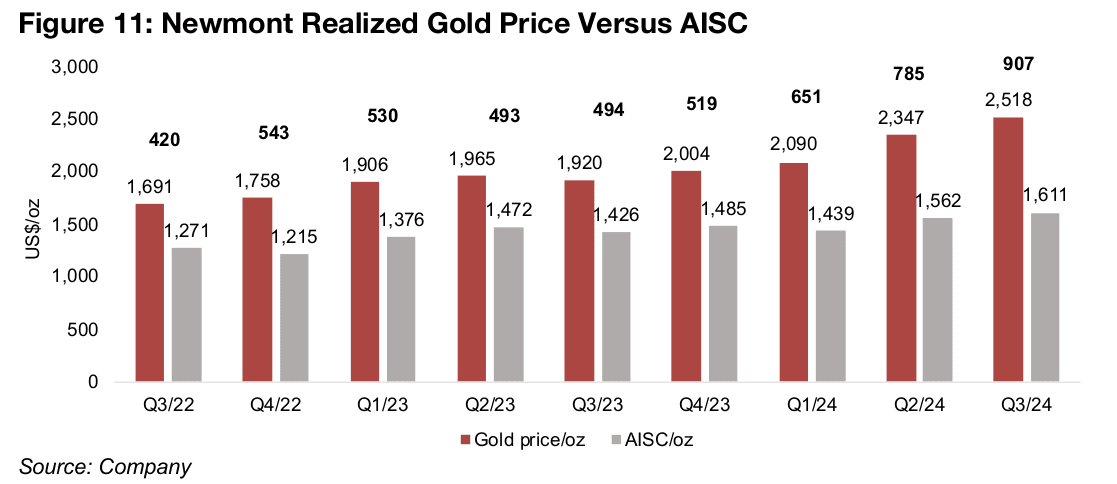
Newmont continued to have strong gold production in Q3/24 up 29.2% year on year to 1.69mn oz Au, with a major jump in production having occurred in Q3/23 and been roughly sustained since (Figure 10). The realized gold price rose to US$2,518/oz or over US$500/oz over the past year, far outpacing the rise in the All Sustaining Cost (AISC) by nearly US$200/oz to US$1,611/oz (Figure 11). However, the rise in costs was still enough to concern the markets and cause a major decline in the share price.
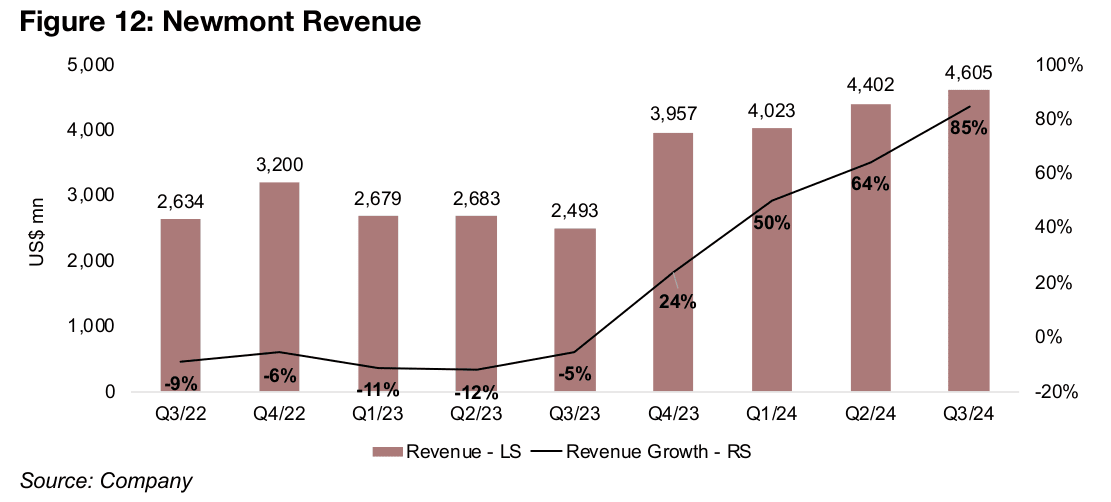
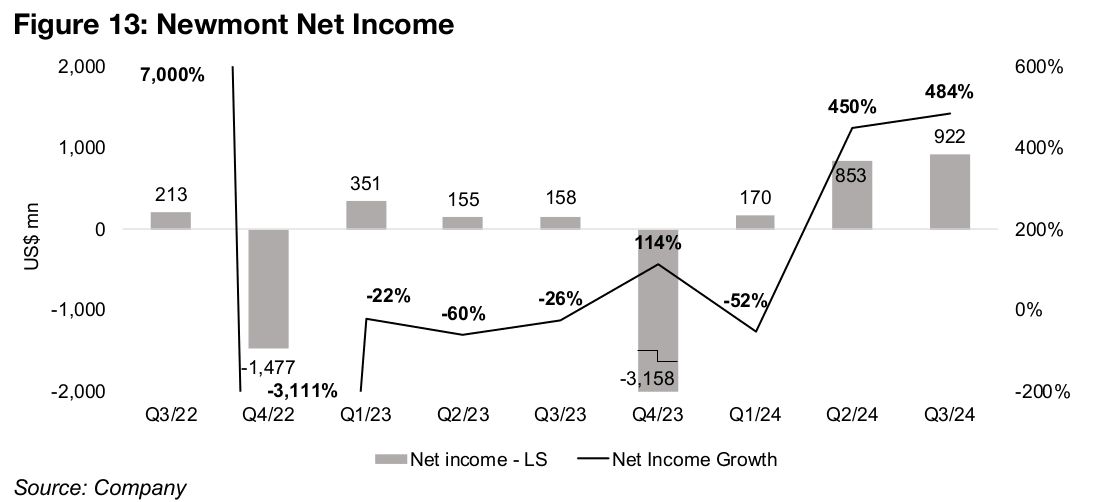
Newmont’s revenue growth continued to rise in Q3/24, reaching 85% yoy and has increased well over 20% yoy since Q4/23, after a contraction in sales from Q3/22 to Q3/23 (Figure 12). This has been driven by both the major rise in production since Q4/23 and obviously the surge in the gold price so far in 2024. This has translated to a jump in net income, as would be expected given the company’s leverage to the gold price, by 484% in Q3/24 after a 450% rise in Q2/24 (Figure 13). The company had large exceptional items in both Q4/22 and Q4/23 that drove major net losses which do not reflect the core operation of the business, and also will likely skew the yoy growth for Q4/24 results.
Agnico Eagle’s Q3/24 strong with only moderate cost rise
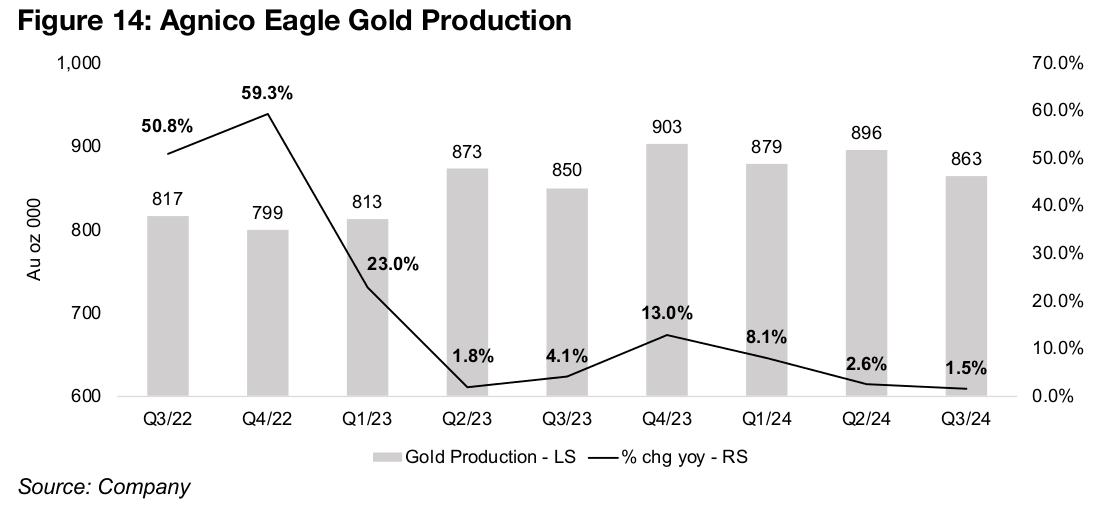
Agnico Eagle’s gold production growth has been much lower, at just 1.5% yoy in
Q3/24, after 2.6% in Q2/24. The last big quarter of production growth was Q4/22 at
59.3%, which was driven by the company’s merger with Kirkland Lake (Figure 14).
However, the current high production growth rates for Newmont and the post-merger
output gains of Agnico Eagle are exceptional, and the company’s current rate is more
inline with about a 2.0% long-term growth in global annual gold production.
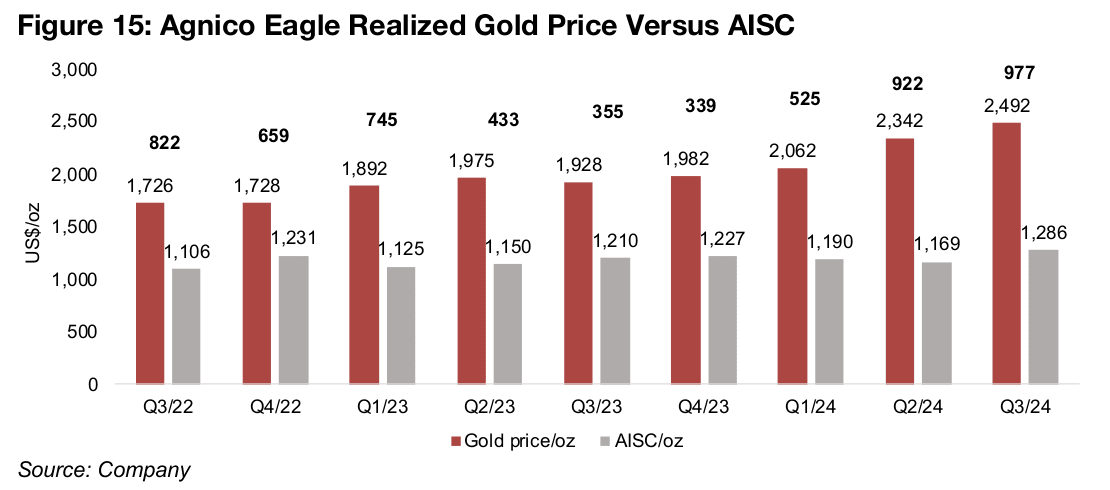
The company’s realized gold price rose for the fourth consecutive quarter to
US$2,492/oz, and there was rise in costs to US$1,286/oz which was US$50/oz above
the previous highs of US$1,227/oz in Q4/23 (Figure 15). The cost rise was
considerably below Newmont’s and led to a much higher gold price to AISC spread
of US$977/oz, and also saw the share price pull back less on the announcement.
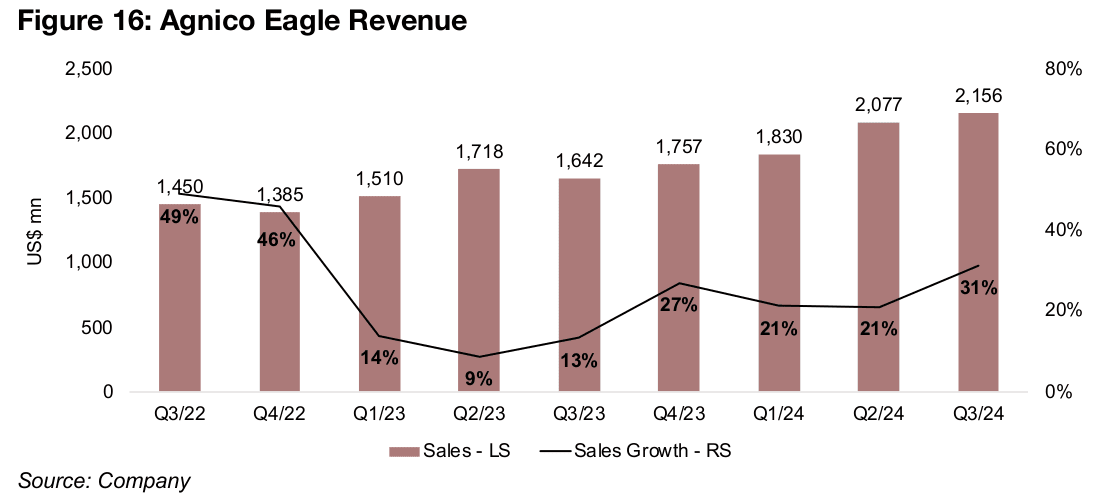
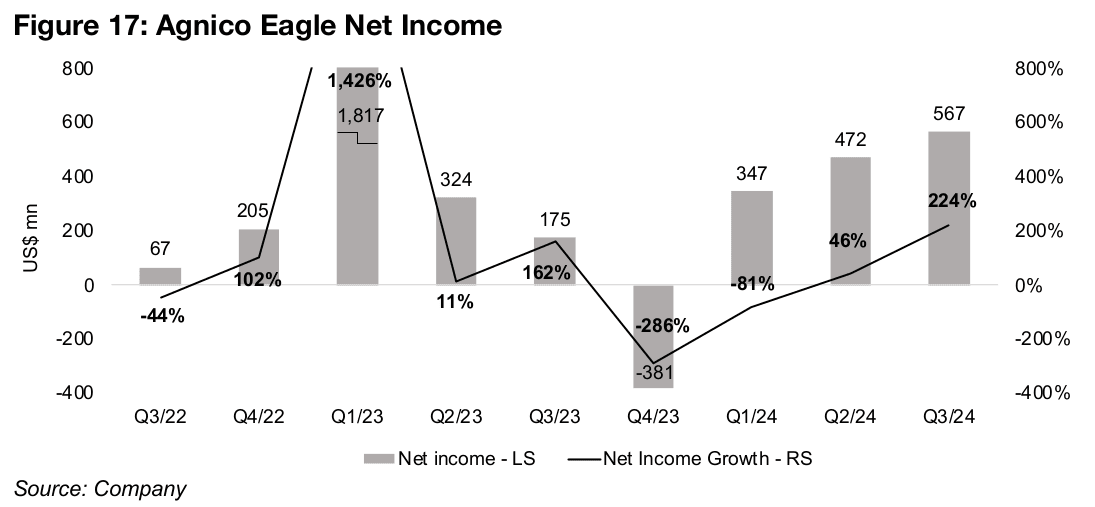
Agnico Eagle’s revenue rose 31% yoy in Q3/24, up from 21% in Q1/24 and Q2/24, and was well below Newmont, which had a boost from much higher yoy production growth (Figure 16). Net income rose 224% in Q3/24 versus Q3/23, which reflected an improvement in the core operations, with limited extraordinary items in either quarter (Figure 17). However, large non-core items affected the extremely high net income of Q1/23 and low net income of Q4/23, with the growth rates not reflecting changes in the main business.
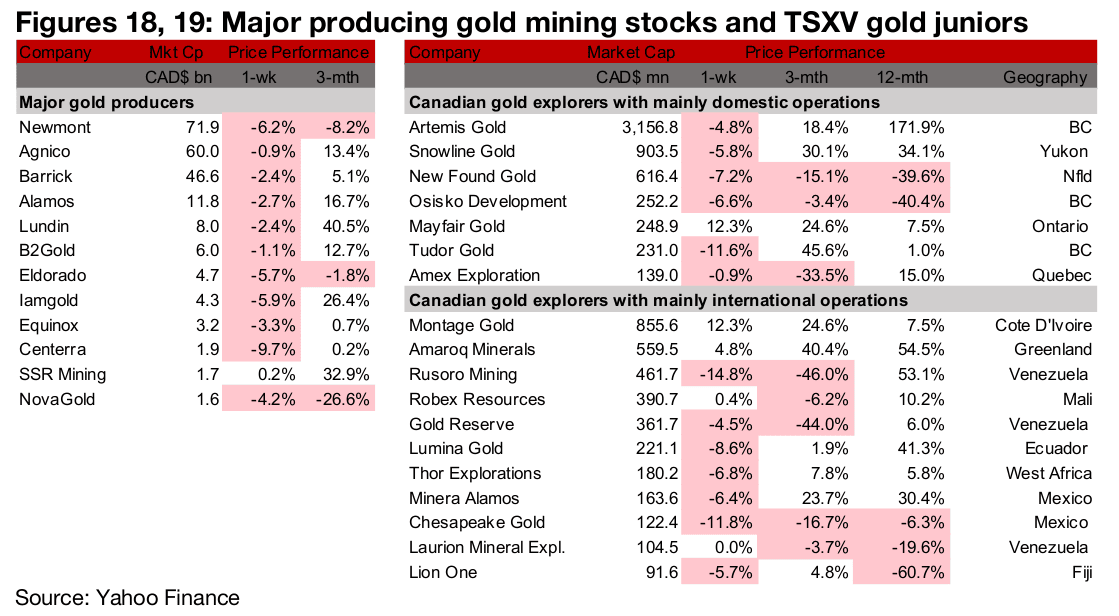
Most major producers and TSXV gold decline
Most of the large producers and TSXV gold declined on the flat metal price and decline in equities (Figures 18, 19). For the TSXV gold companies operating domestically, New Found Gold reported drill results from the Gold Dome Zone and Phase II metallurgical drill results from the Iceberg and Iceberg East Zones of Queensway (Figure 20). For the TSXV gold companies operating internationally, Minera Alamos announced that it would acquire Sabre Gold Mines (Figure 21).


Disclaimer: This report is for informational use only and should not be used an alternative to the financial and legal advice of a qualified professional in business planning and investment. We do not represent that forecasts in this report will lead to a specific outcome or result, and are not liable in the event of any business action taken in whole or in part as a result of the contents of this report.


