August 19, 2024
Big Gold Outpacing Big Mining
Author - Ben McGregor
Big Gold stocks outperform Big Base Metals
This week we look at the price and operational performance and valuations of the largest global mining stocks, with a strong year for the Big Gold stocks seeing them substantially outpace the Big Base Metals stocks, which have struggled overall.
Big Gold Outpacing Big Mining
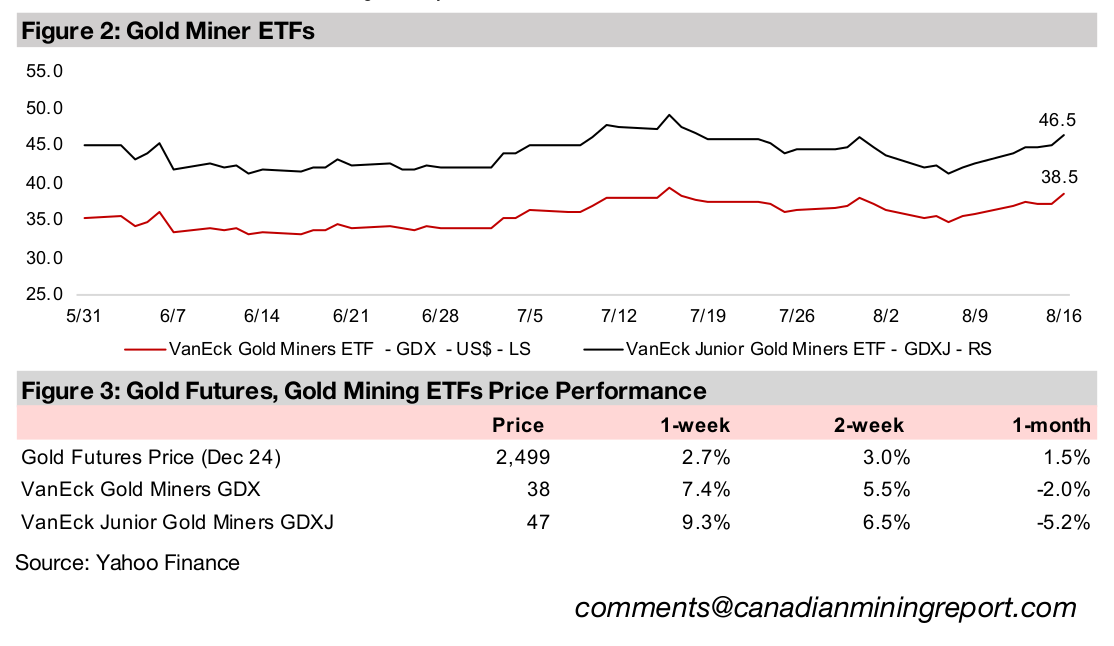
Gold jumped 2.7% to US$2,499/oz as markets continued to come roaring back from
the crash of just two weeks ago. The S&P 500 and Nasdaq jumped 3.8% and 5.0%,
respectively, with the gains in large caps and the metal price seeing the GDXJ ETF of
gold producers gain 7.4%. While the recovery in small caps was a bit weaker than
the large caps, with the Russell 2000 rising 2.8%, this was enough to drive up the
GDXJ ETF of gold juniors 9.3% combined with gold’s strength. The key US economic
news was CPI inflation, with both the headline and core figure continuing to decline,
to 2.9% and 3.2% yoy, respectively, inline with expectations.
With the rebound bringing most of the major indices to levels higher than before the
crash, it could be viewed a just blip in a continued bull market. In the US the S&P 500
and Nasdaq are up 1.7% and 1.6% from July 26, 2024, just before the crash began,
and even Japan, which saw a particularly sharp decline, is up 1.0% and the Eurostoxx
600 is back to near flat (Figure 4). However, there are signs markets are cautious of
this rebound, as the issues causing it, especially high equity valuations and interest
rates and a not entirely unwound Japan carry trade, still remain.
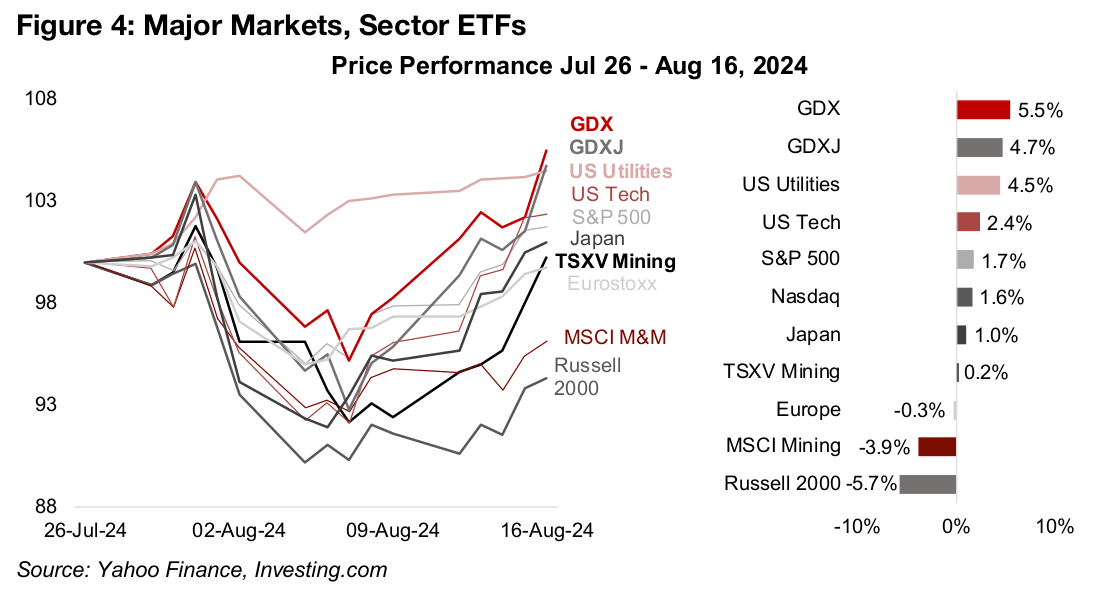
One of the biggest indicators that markets are concerned about the sustainability of
the rebound is the major outperformance of defensive sectors. The strength in gold
and gold stocks is a clear sign of this, with the GDX and GDXJ up 5.5% and 4.7%,
respectively, since July 26, 2024, about three times the gains of the major U.S. indices
and twice the level of U.S. Tech. Utilities, a classic defensive sector, has also
outperformed, up 4.5%, and the small cap Russell 2000 index substantially
underperformed, down -5.7%, with both showing signs of caution on riskier assets.
If the current rebound had been a pure return to risk-on this underperformance of
tech and small caps and outperformance of defensives would have been unlikely. So,
what might appear at first to be a bull market revival is actually just the continuation
of a trend already ongoing for much of this year. This has been that even as markets
continue to buy relatively heavily into U.S. Tech, there is much more hedging of bets
via defensive sectors than would have been seen in 2023. The crash seems to have
simply put this trend into overdrive, and we see a high probability it could continue,
with valuations of defensive sectors like gold stocks and utilities still low and tech
high, allowing room for a continued rotation out of the latter and into the former.
Big Gold converges towards target prices
This week we look at the performance, operational outlook and valuations of the Big Gold and Big Base Metals mining stocks so far this year, with the former the clear stand out overall, and the latter continuing to struggle overall. All of the eight largest global gold stocks by market cap, Newmont, Agnico Eagle, Barrick, Kinross, Gold Fields, Anglogold Ashanti, Northern Star and Alamos Gold are up year to date, with half up more than 40%, driven by the continued rise in the gold price (Figures 5, 6).
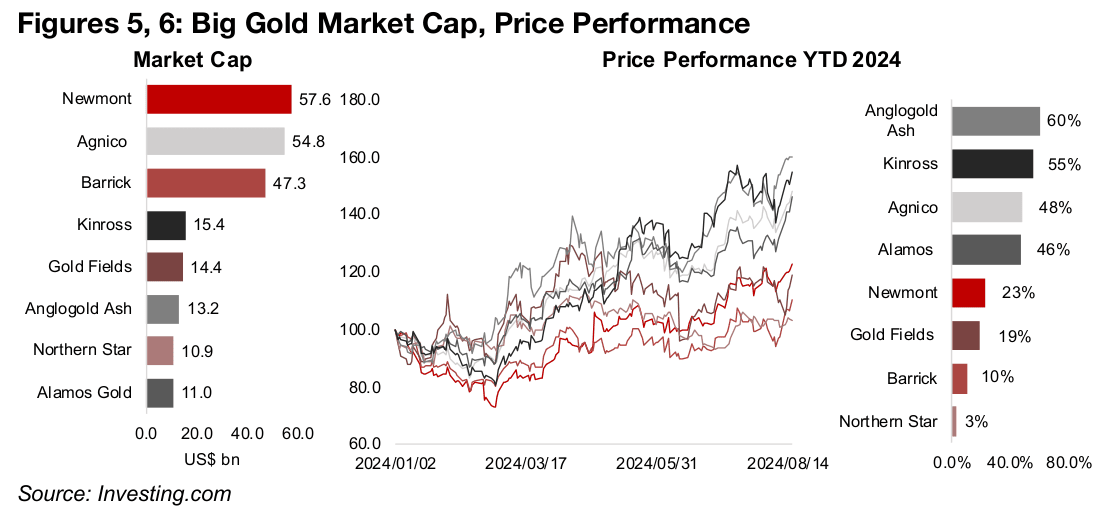
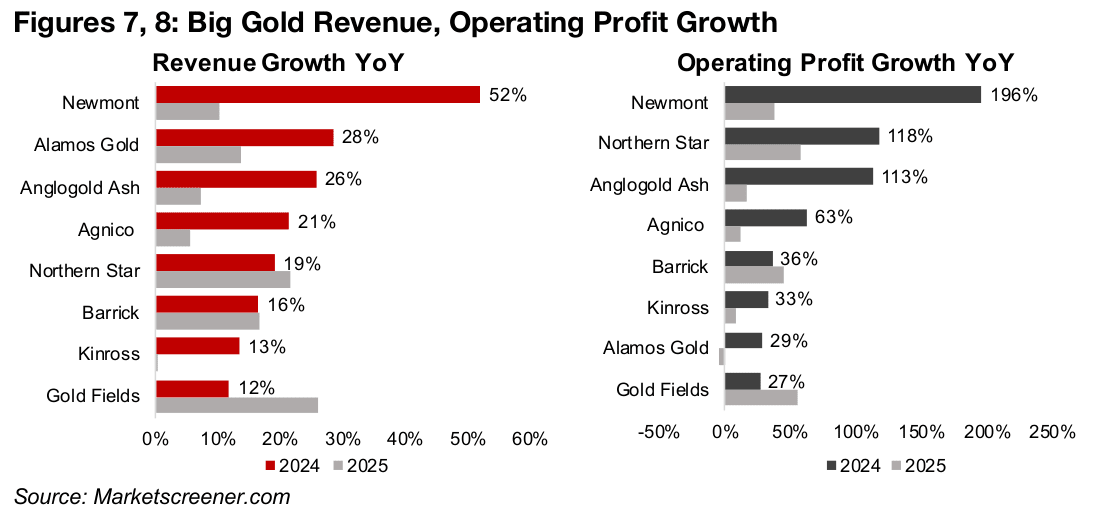
The share price gains have been driven by a strong ongoing operational performance for the sector for 2024, with double digit revenue growth forecast for all eight, and operating profit growth at around 30% or higher (Figures 7, 8). With H1/24 having been already reported for most of the companies, these estimates will largely have incorporated the sector’s operations over the first half of the year. While the market does expect a slowdown in 2025 from the outstanding revenue and operating profit growth of this year, decent gains are still forecast for almost all of the companies. These estimates are also likely based on only moderate increases in the gold price, and we still see room for the metal to surprise to the upside next year.
The big gains in share prices for the sector have seen many of the major gold companies converge towards their target prices. Even the highest upside is now only 14.9% for Kinross Gold, and this is even after it saw the largest target price upgrade over the past year (Figures 9, 10). This contrasts with earlier this year, especially in first quarter 2024, when there was still substantial upside to the target prices of most of the group. The share price gains have reduced the expected upside for Barrick, Alamos, Northern Star and Newmont to moderate gains of 13.0%, 9.7%, 7.0% and 4.7%. The market even now sees some of the group, including Agnico Eagle, Anglogold Ashanti and Gold Fields, as near fair value or moderately overvalued, with especially the former two having seen major upgrades to their targets in 2024.
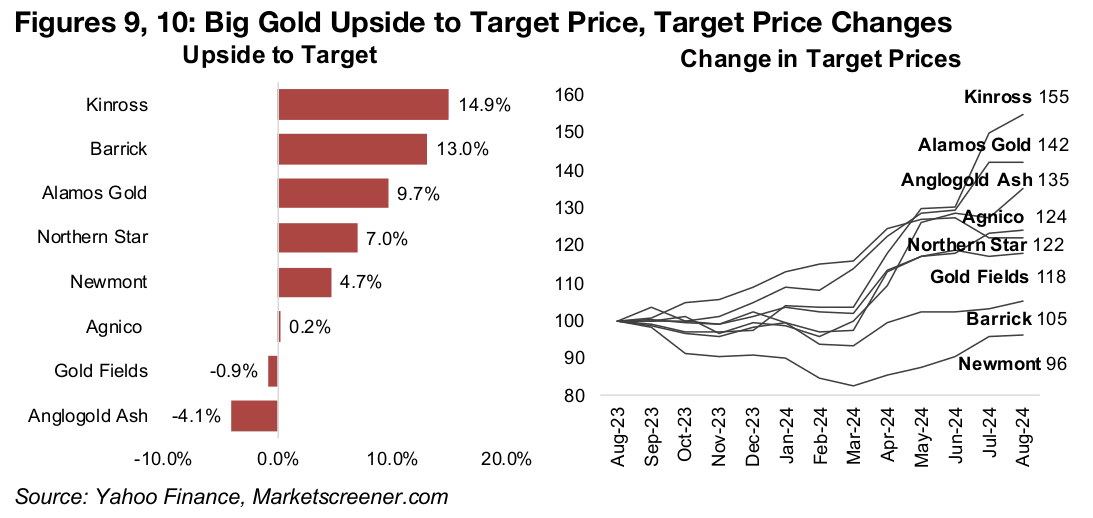
Target prices had either been only gradually increased, or even significantly
downgraded, in the case of the two industry giants Barrick and Newmont, from
August 2023 through to March 2024. However, from April 2024 there was a significant
revaluation of the sector, with only Newmont’s target now down from a year ago, and
even that is only by -4.0%.
With the average gold price having reverted persistently towards a US$1,800/oz from
2020 to 2023, this level or lower had likely become a benchmark for pricing gold
stocks. However, with the price surge this year towards US$2,500/oz, the market
seems to be finally pricing in gold at least at the US$2,000/oz level. The market will
likely remain cautious for some time about incorporating gold far above US$2,000/oz
into forecasts. It could therefore require another clear move upward by a few hundred
dollars, or at least holding the US$2,500/oz level for an extended period, before we
see another major rerating of the long-term gold assumption and therefore another
run up in market target prices for the gold sector.
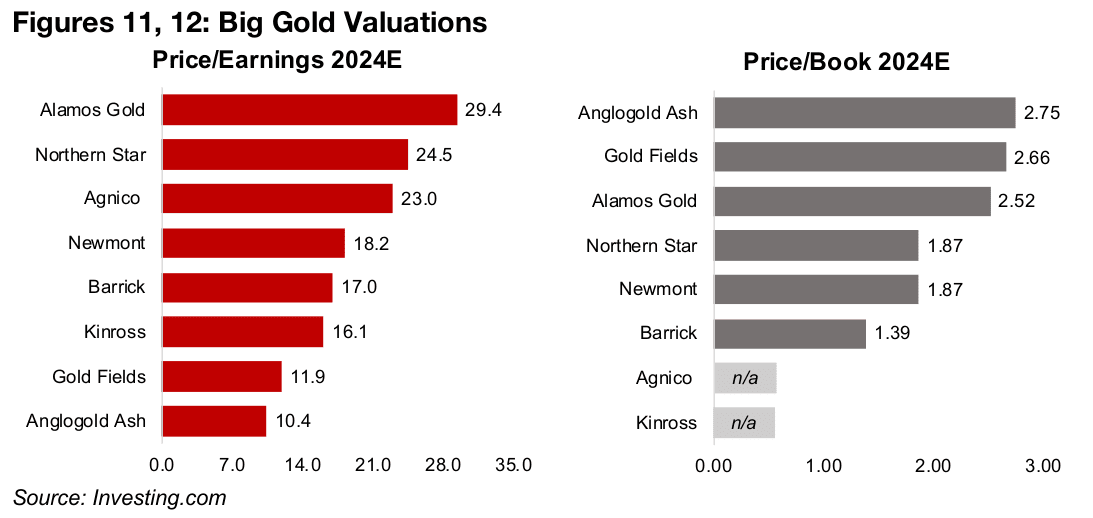
The valuations for the gold stocks are not as across-the-board inexpensive looking as they were at the start of the 2024 after the huge share price gains this year, with some names starting to see somewhat elevated multiples (Figures 11, 12). However, other than Alamos Gold, none of the group have both have a high price to earnings (P/E) and price to book (P/B) ratio in tandem, which could need a particularly outstanding expected operational performance to justify. Anglogold Ashanti and Gold Fields are examples of a mixed picture across the two valuations, having the lowest price to earnings of the group, but also the highest price to book.
Big Base Metals stocks still struggling overall
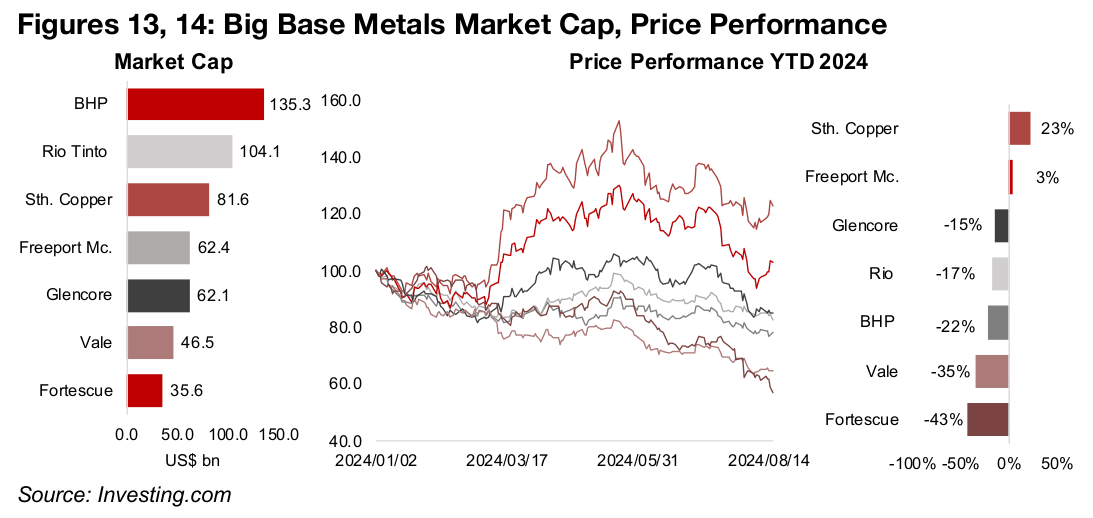
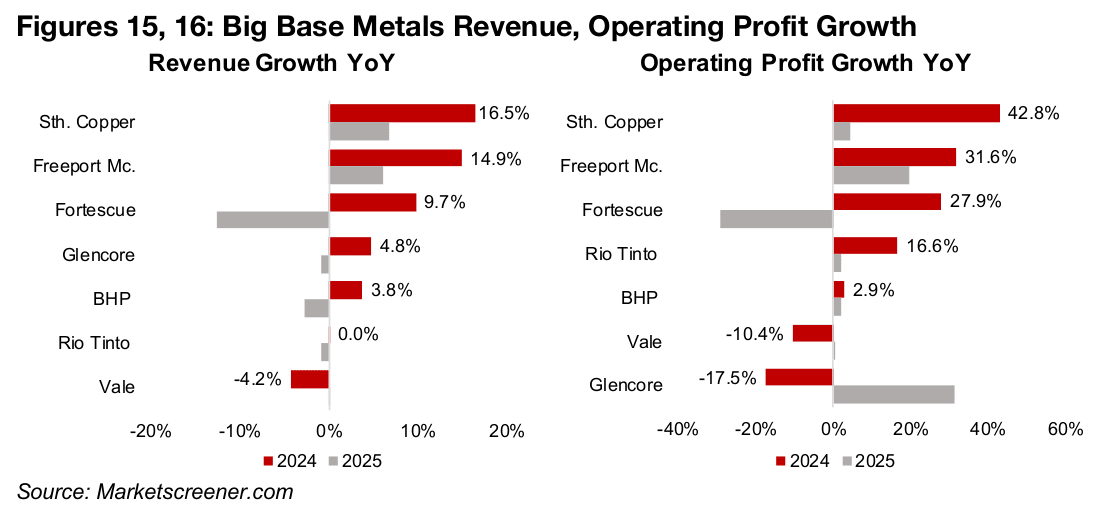
The Big Base Metals stocks, including BHP, Rio Tinto, Southern Copper, Freeport McMoran, Glencore, Vale and Fortescue, have struggled overall this year compared Big Gold, with only two of the seven seeing gains (Figures 13, 14). Both outperformers, Southern Copper, up 23%, and Freeport McMoran, up 3%, have high exposure to copper, with the overall rise in the metal this year propelling gains. However, they are well off their highs in May 2024 when the copper price peaked, and the metal has broadly trended down since. The share prices for the two have been driven by revenue and operating profit growth expectations far outpacing the rest of the sector (Figures 15, 16). All the rest of the sector has high exposure to iron ore, and the weakness in that metal over the past year has hit earnings expectations.
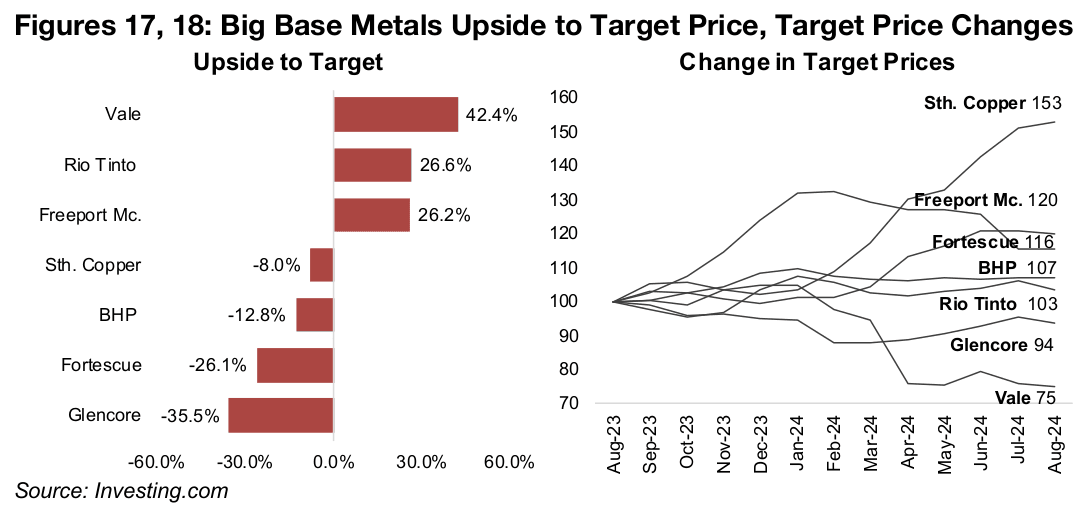
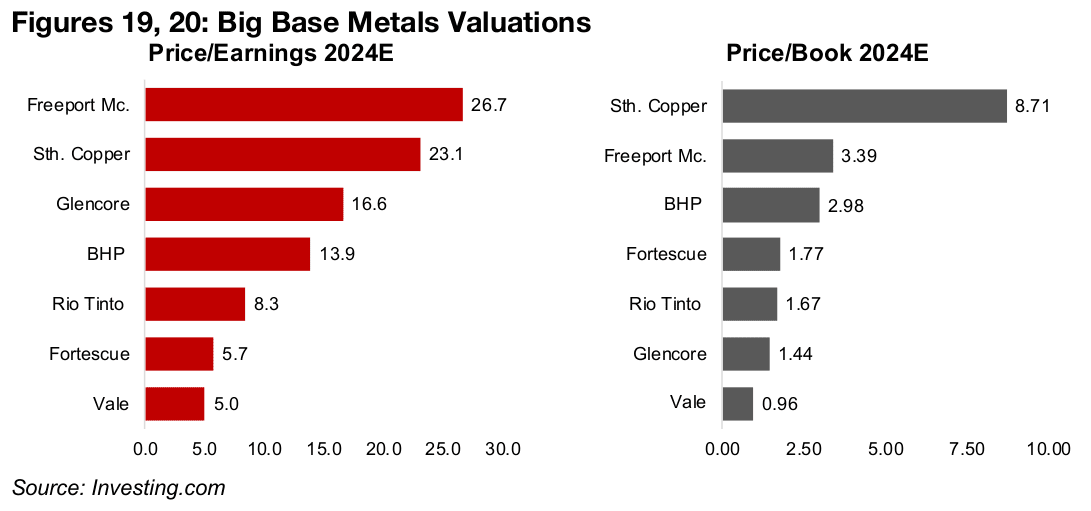
There is a much wider spread in spread between the market and target prices for the Big Base Metals compared to Big Gold (Figure 17). There is also a bigger mix in target prices changes over the past year with a major upgrade only for Southern Copper, and substantial downgrade for Vale (Figure 18). Even with this downgrade, the market still sees the highest upside for Vale, at 42.4%, followed by Rio Tinto, at 26.6% and Freeport McMoran at 26.2%. The market sees Southern Copper and BHP as having moved ahead of their full value with an -8.0% and -12.8% downside, respectively, and more substantial downside for Fortescue and Glencore at -26.1% and -35.5%. The big gains in Southern Copper and Freeport McMoran have seen their P/E and P/B multiples rise to the highest of the group, with the former’s P/B especially high (Figure 19, 20). The stocks with higher iron ore exposure have more subdued multiples, with Vale seeing particularly low P/E and P/B multiples.
Large producers and TSXV gold gain
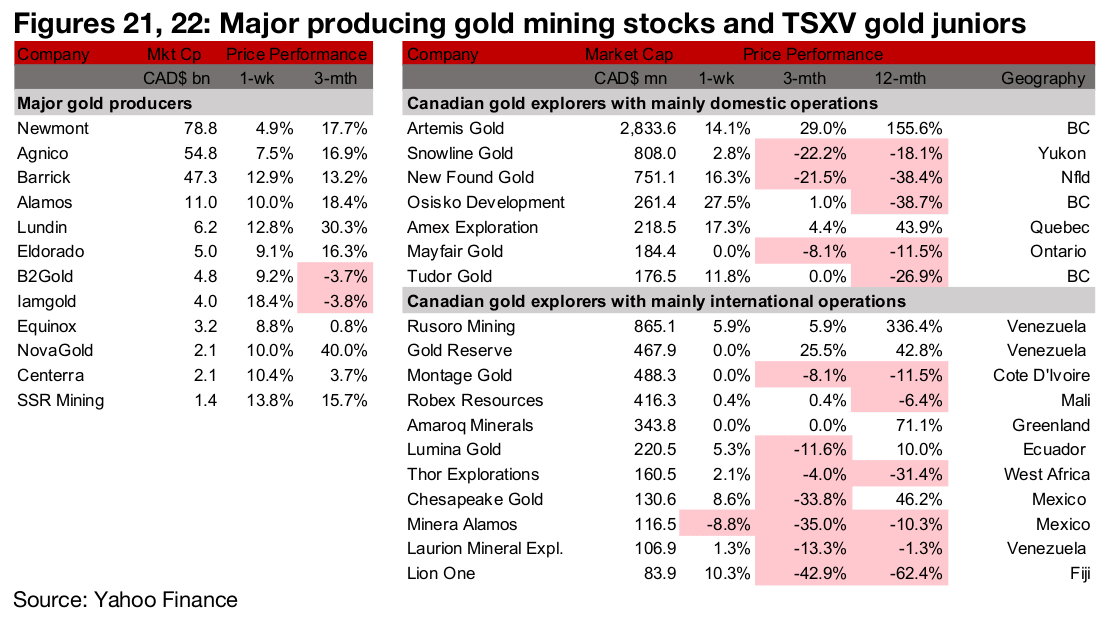
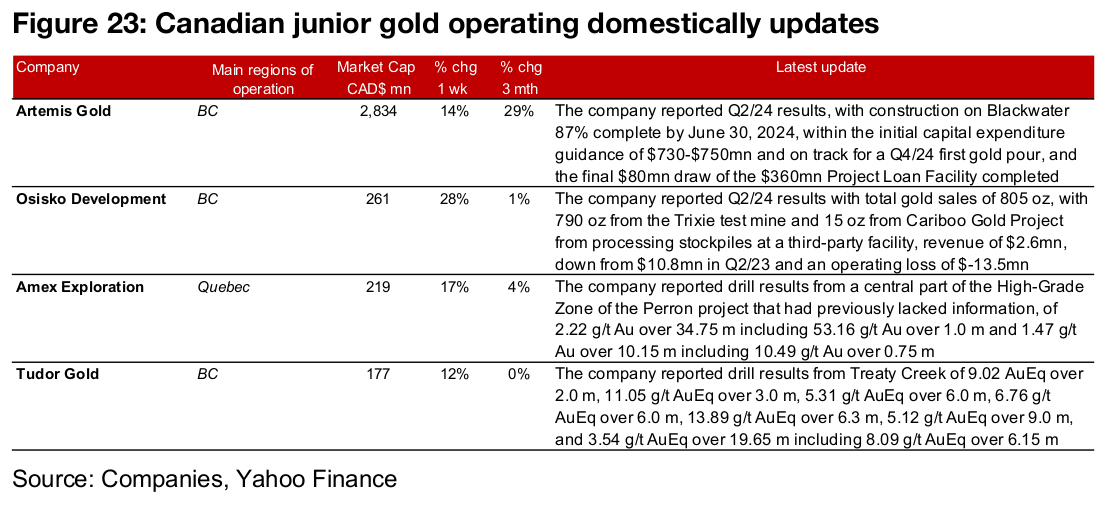
The large gold producers surged, with over half up more than 10%, and the large TSXV gold stocks were nearly all up (Figures 21, 22). For the TSXV gold companies operating domestically, Artemis Gold and Osisko Development released Q2/24 results, and drill results were reported for Amex Exploration from the High-Grade Zone of Perron and from Tudor Gold from Treaty Creek (Figure 23). For the TSXV gold companies operating internationally, Montage Gold closed its C$180mn private placement and Amaroq Minerals reported Q2/24 results (Figure 24).

Disclaimer: This report is for informational use only and should not be used an alternative to the financial and legal advice of a qualified professional in business planning and investment. We do not represent that forecasts in this report will lead to a specific outcome or result, and are not liable in the event of any business action taken in whole or in part as a result of the contents of this report.


