May 13, 2024
Big Gold Has Strong Q1/24
Gold resumes climb
Gold rose 3.0% to US$2,367/oz, resuming its climb after a two-week pullback, as US economic data remained weak, with consumer confidence coming in well below expectations, boosting hopes for more dovish central bank action.
Big Gold has strong Q1/24 while valuations remain moderate
The three largest gold producers Newmont, Barrick and Agnico Eagle had a strong Q1/24 overall while valuations still remain moderate, at near medium-term averages, even after a significant recovery in their share prices from February 2024 lows.
Gold stocks propelled by gain in metal and equities
Gold stocks jumped, with the GDX up 5.4% and GDXJ gaining 6.6%, on the rise in the metal and equities, as while the recent risk on rally continued overall, the market still added to safe havens like gold inline with a broader tone of caution this year.


Big Gold Has Strong Q1/24
The gold futures rose 3.0% to US$2,367/oz, resuming its ascent this year after a two-
week pullback. The key economic data this week was the US Consumer Confidence
Survey, which collapsed to 67.4 in May 2024 from 77.2 in April 2024, the largest drop
since August 2021, and far below expectations for 76.2. Similar to the weak US jobs
report from two weeks ago, the news was viewed as a harbinger of potential rate cuts
and taken well by equity markets. The S&P 500 was up 1.6%, the Nasdaq rose 0.8%
and Russell 2000 gained 0.6%, extending a risk on rally for a third week.
Icon and logotype co
However, the price action in gold showed that the market has continued to hedge
their bullish equity bets with the metal. This is because while the weak economic data
does potentially imply rate cuts sooner rather than later, central banks are limited in
how much they can do by stubbornly high inflation. Combined with the weaker
economic growth that recent data implies, stagflation is looking more likely, which
does not bode well for company earnings, and could offset the lift from lower interest
rates. Stagflation tends to be supportive of the gold price and could explain why the
market has not eschewed the metal even given the recent move into risk assets.
Big Gold producers report strong Q1/24 results
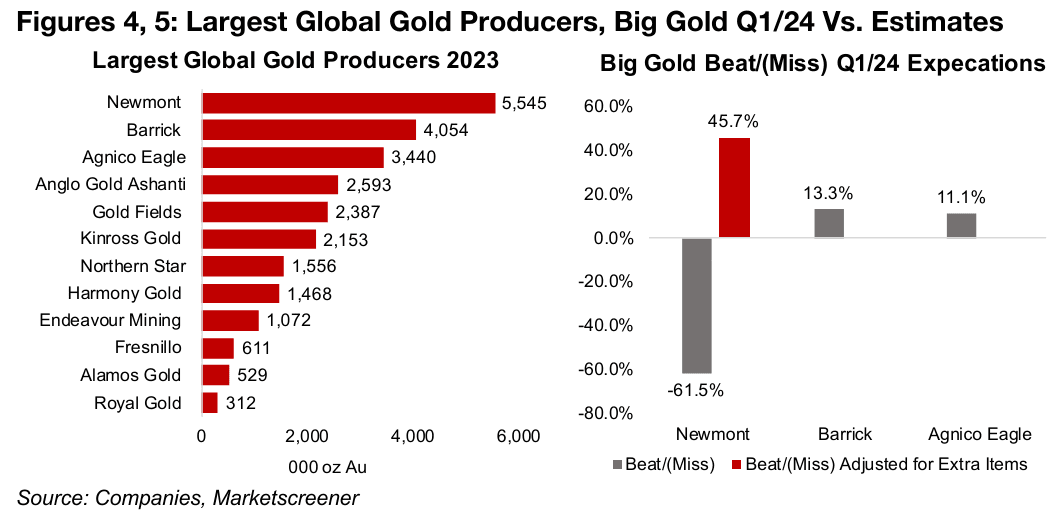
With the big three gold producers, Newmont, Barrick and Agnico Eagle having now all reported Q1/24, this week we look at their results and valuations. The three have such a large share of global gold production that together they are a good proxy for overall industry trends (Figure 4). Excluding major non-recurring items, the EPS of all three beat consensus expectations, by 45.7%, 13.3% and 11.1% for Newmont, Barrick and Agnico Eagle, respectively. However, including a large loss on a one-off asset sale, Newmont missed the Q1/24 estimate by -61.5% (Figure 5).
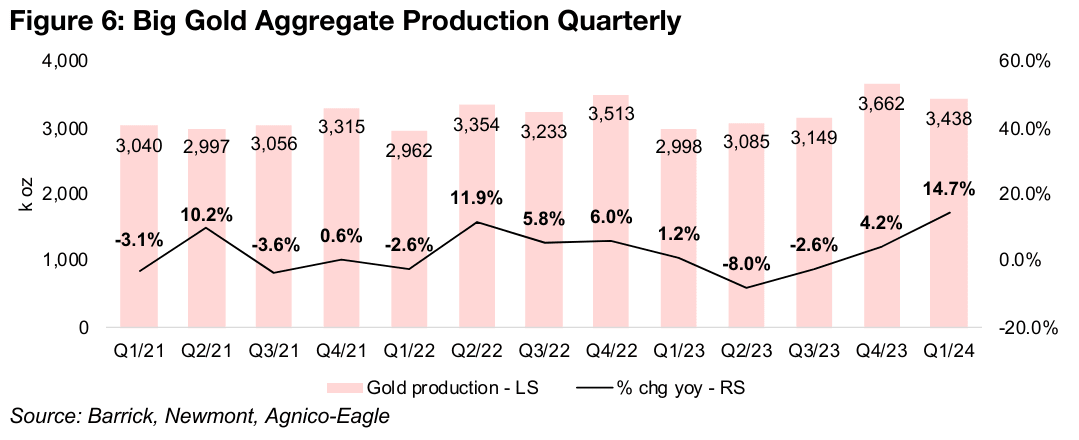
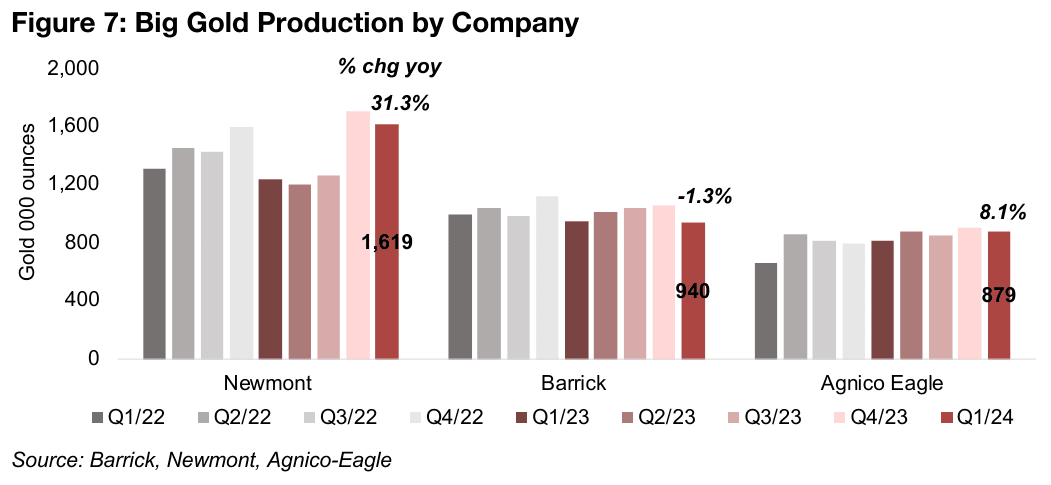
Aggregate production was up significantly year on year for the three, rising 14.7% to 3,438k oz Au. While this was down -6.1% quarter on quarter from 3,662k oz Au in Q4/23, this had been the strongest quarterly output in a few years (Figure 6). Most of the gain was driven by Newmont, with production rising by 31.3% to 1,619k oz Au (Figure 7). Production for Barrick contracted slightly, down -1.3% yoy to 940k oz Au, but growth was decent for Agnico-Eagle, up 8.1% yoy to 879k oz Au.
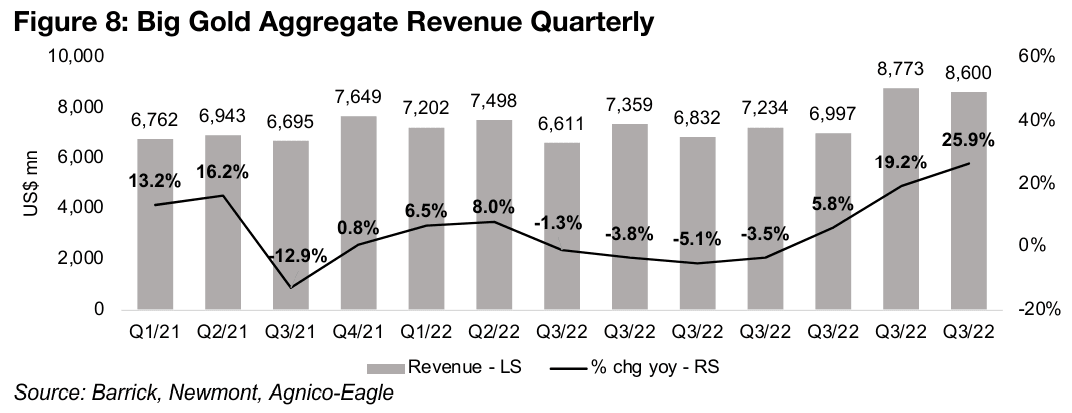
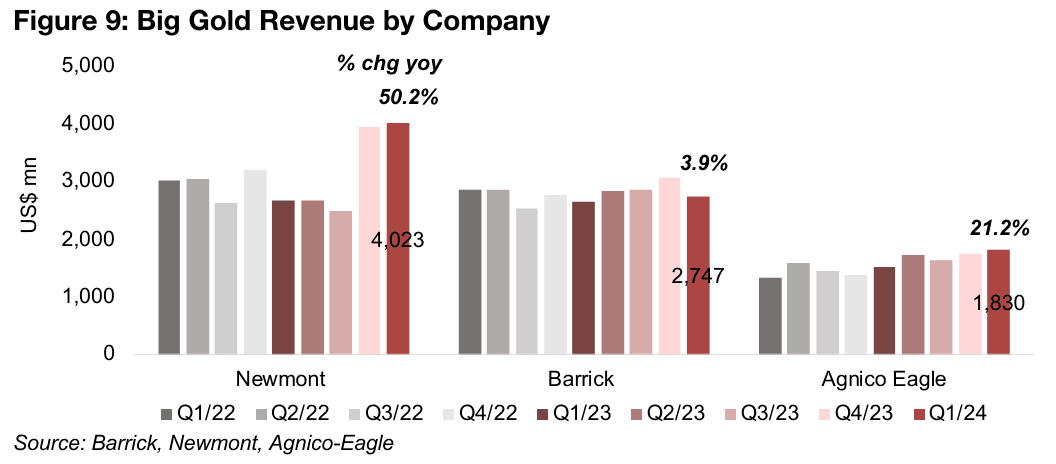
Combined with a jump in realized gold prices, with the metal price especially picking up in March 2024, the rise in production drove up revenue for the three by 25.9% to US$8,600mn in Q1/24 (Figure 8). This marks a four-quarter rise in revenue growth from lows of -5.1% in Q3/22, and the sector has been especially strong for the past two quarters, with a several-year high in revenue reached in Q4/22 at US$8,773mn, gaining 19.2% yoy. Newmont’s large production rise drove a 50.2% yoy gain in revenue, while Barrick was up 3.9% and Agnico Eagle 21.2% (Figure 9).
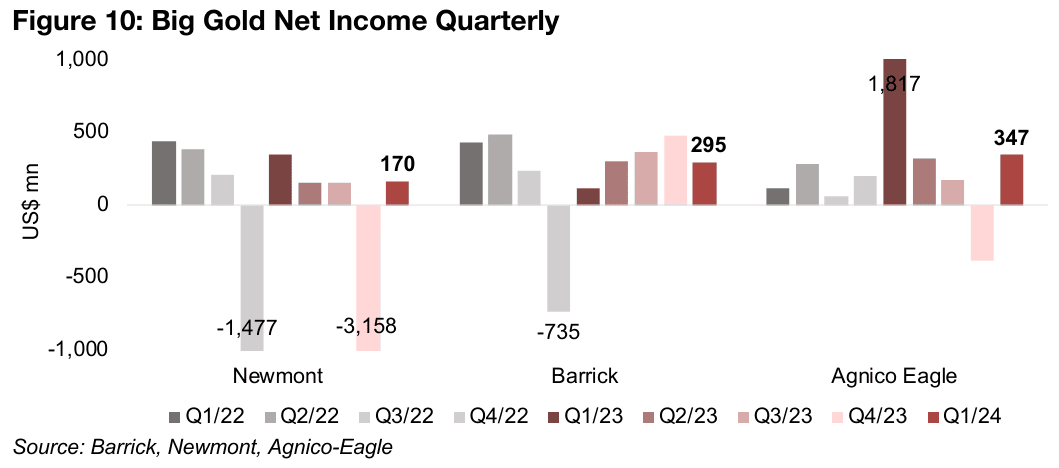
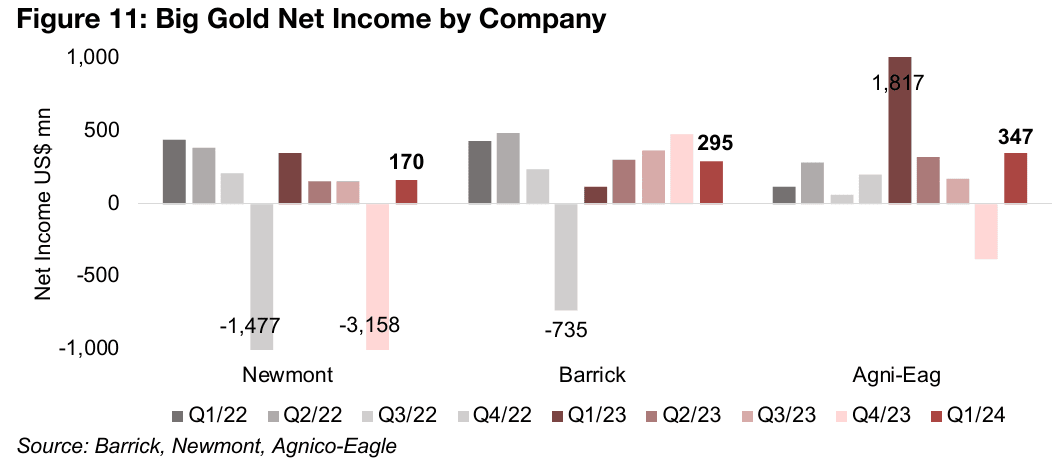
The aggregate net income of the Big Gold companies has not been a great indicator of the ongoing underlying economics of the sector for the past two years. This is because there have been large one-off items, both losses and gains, which have skewed the numbers (Figure 10). These have been seen across all three of the companies, with Newmont facing major non-recurring losses in Q4/22 and Q4/23, Barrick in Q4/22, and Agnico Eagle reporting large one-off gains in Q1/23 (Figure 11).
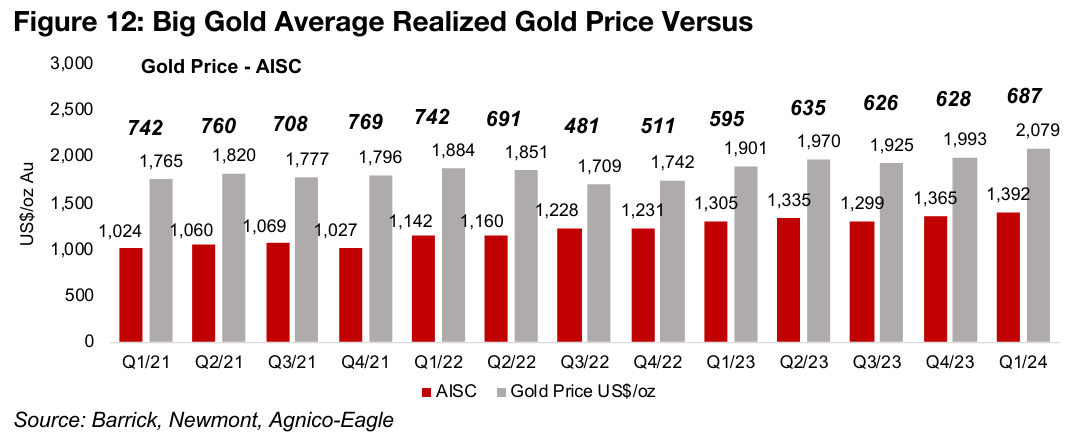
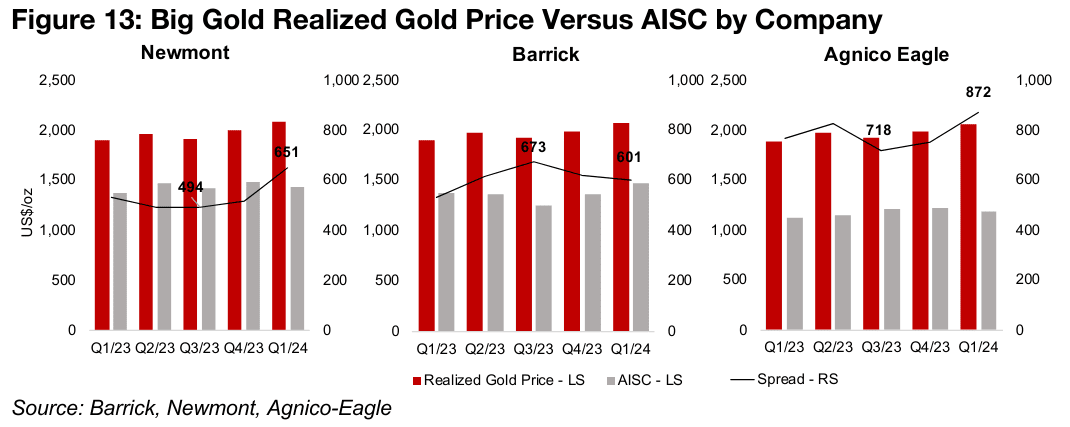
A more illuminating metric for the core operations of the companies is shown by the spread between the realized gold price and all-in-sustaining-cost per ounce (AISC). This spread jumped to US$687/oz Au in Q1/24, up 42.8% off the lows of US$481/oz Au reached in Q3/22, and has generally trended up for the past six quarters (Figure 12). The spread for Newmont and Agnico Eagle widened over the past two quarters, reaching US$651/oz and US$872/oz, respectively, with AISC relatively flat as the realized gold price rose (Figure 13). The spread for Barrick declined over the past two quarters to US$601/oz as its AISC outpaced the rise in its realized gold price.
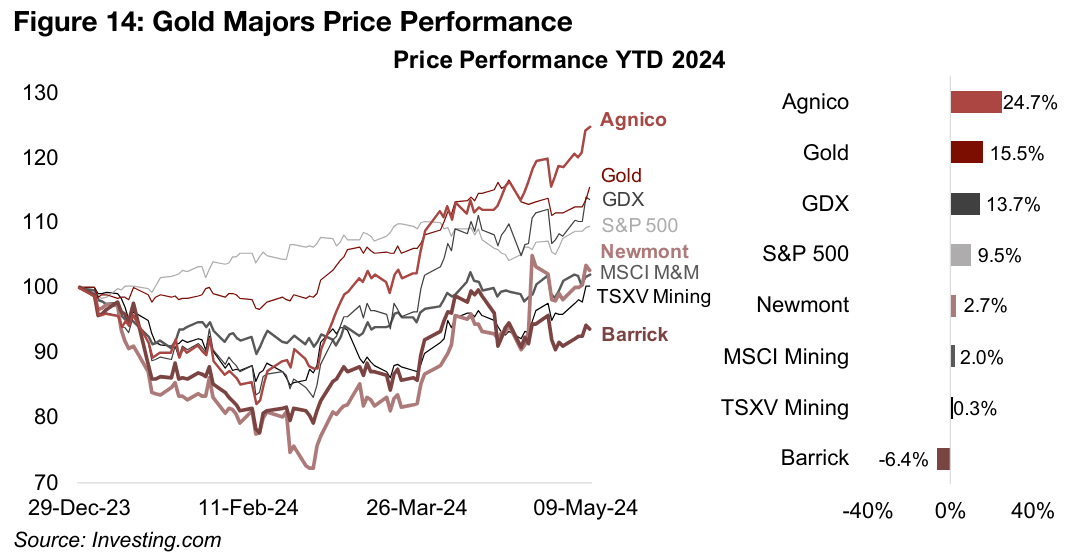
The results continued to propel the share prices of the three companies, although only Agnico Eagle, up 24.7% year to date, has outpaced the sector benchmarks gold, up 15.5%, and the GDX ETF of gold producers, rising 13.7% (Figure 14). The results saw Newmont get above even for the year with a 2.7% gain after facing substantial losses earlier in the year. While Barrick has also recovered significantly from its lows for the year, it has been the laggard, and is still down -6.4%, below even the 0.3% gain of the S&P/TSXV Mining Index of smaller junior miners.
Big Gold valuations near historical averages on conservative gold estimates
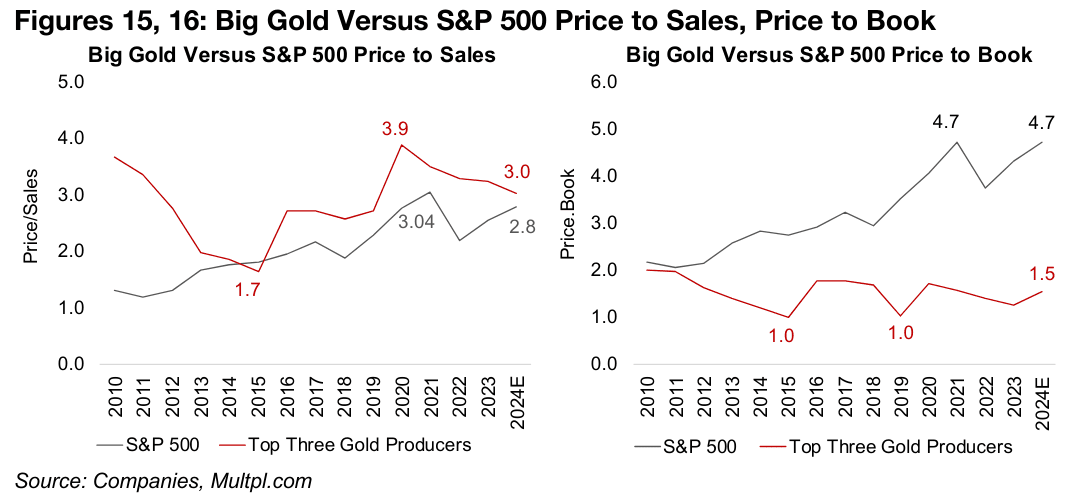
The valuations of Big Gold still do not look excessive even after the recent rebound in share prices. The market does not appear overly bullish on the sector and is certainly not pricing in heavily aggressive operating outcomes, as had been the case for the tech sector until recently. The aggregate price to sales (P/S) for the sector has come down from 3.9x in 2020 to 3.0x for 2024E, which puts it nearly even with the 2.8x P/S for the S&P 500 overall (Figure 15). On a price to book (P/B) basis, however, at just 1.5x for 2024E, Big Gold trades at a huge discount to the 4.7x P/B of the S&P 500, which has been driven especially by the run up in the tech sector (Figure 16).
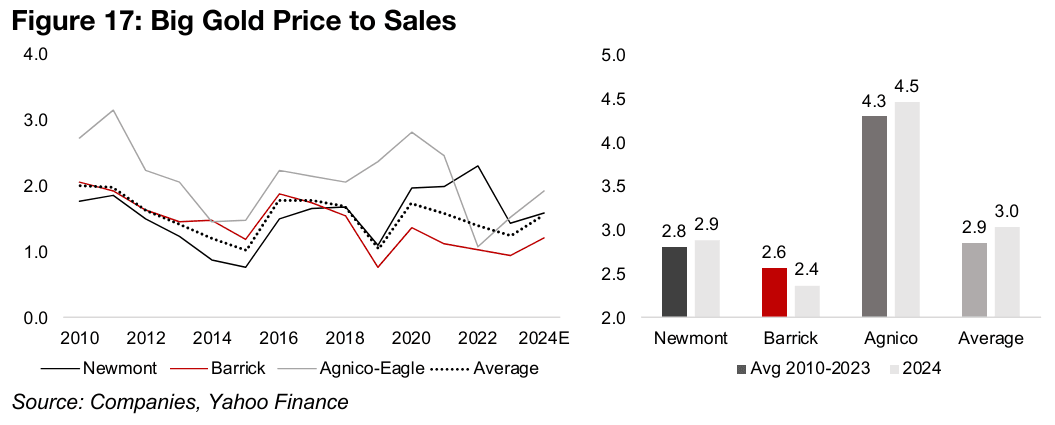
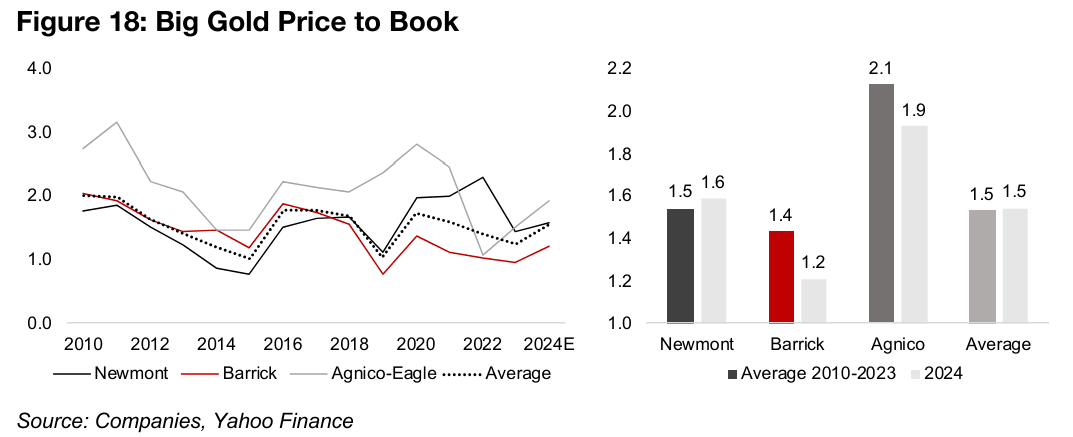
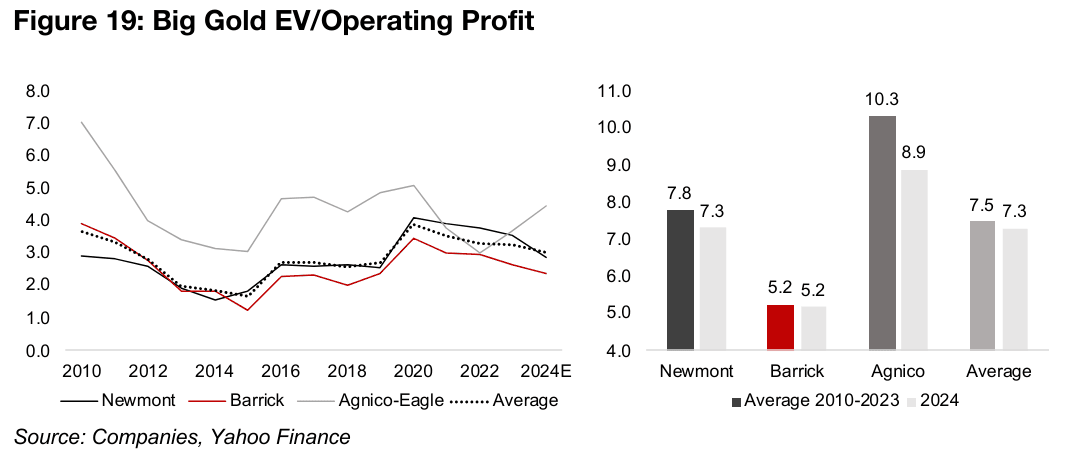
Overall, Big Gold’s valuations for this year are not significantly out of line with historical averages. Price to sales multiples for 2024E for Newmont and Agnico Eagle are slightly above the 2010-2023 average, but moderately below for Barrick (Figure 17). For price to book, Newmont trades above the longer-term average this year, but both Barrick and Agnico Eagle below (Figure 18). For enterprise value (EV) to operating profit, all three companies trade below the longer-term average (Figure 19).
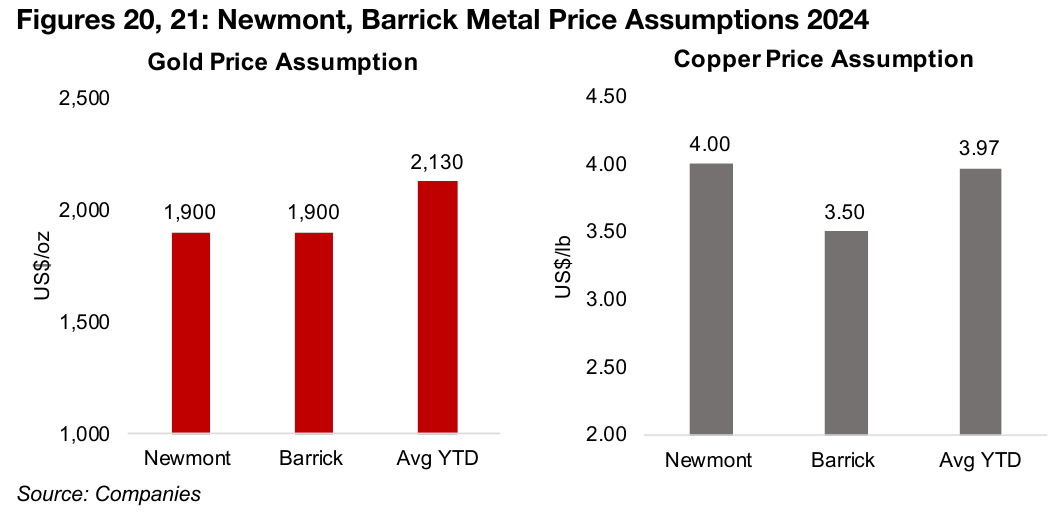
However, one thing to consider is that these valuations have likely still not
incorporated the major recent ramp up in the gold price. This is evidenced by the
muted rise in consensus revenue estimates in recent weeks even as gold gained,
which we outlined in previous reports. The companies themselves internally are also
using quite low gold and copper prices in their guidance. Newmont and Barrick are
still assuming only an average US$1,900/oz gold price, well below the US$2,130/oz
average so far this year, and are more mixed on the copper price (Figures 20, 21).
Even if the gold price is maintained only at the current average for the rest of the year,
it suggests material upside for the revenue estimates, book value and operating profit
of these companies. If these all turn out to come in higher than current estimates, this
would reduce the current multiples, and could even see them drop significantly below
these long-term averages we have outlined above. So while the Big Gold stocks are
maybe not the extreme bargains they were in February 2024, their valuations do not
appear to have moved into territory that seems clearly excessive.
Major gold producers mostly up and TSXV gold mixed
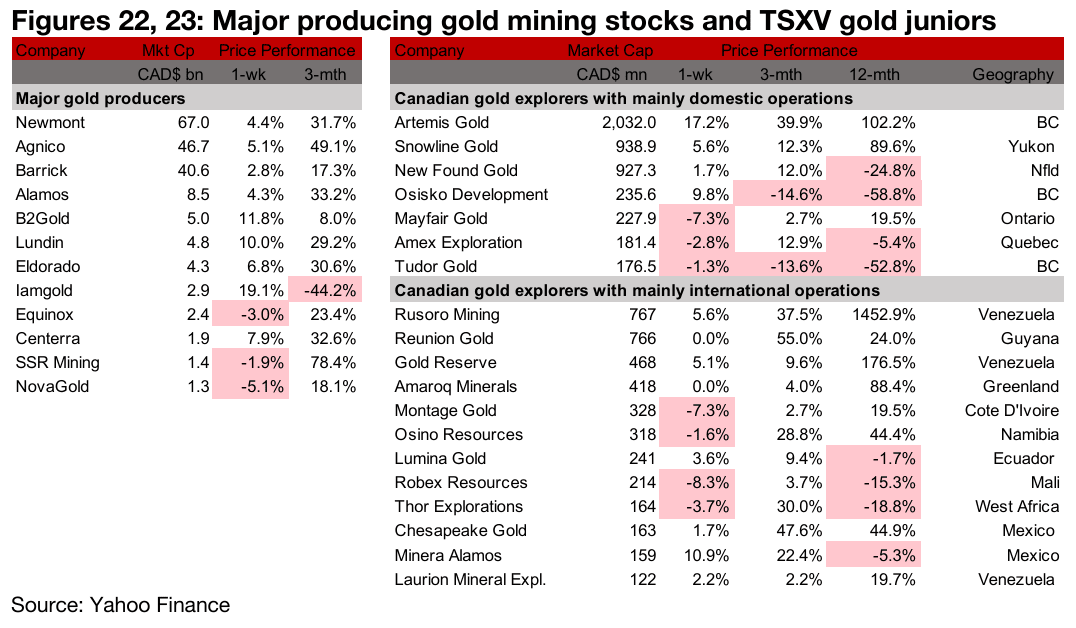
The major gold producers were mostly up and TSXV gold was mixed (Figures 22, 23). For the TSXV gold companies operating domestically, Osisko Development reported Q1/24 results and announced the departure of its V.P. of Exploration and Tudor Gold started its 2024 drill program at Treaty Creek (Figure 24). For the TSXV gold companies operating internationally, Montage Gold received an environmental permit for the Kone Project and Lion One reported drill results from Tuvatu (Figure 25).


Disclaimer: This report is for informational use only and should not be used an alternative to the financial and legal advice of a qualified professional in business planning and investment. We do not represent that forecasts in this report will lead to a specific outcome or result, and are not liable in the event of any business action taken in whole or in part as a result of the contents of this report.

