March 12, 2021
Base Metal Bounce
Author - Ben McGregor
Gold back above US$1,700/oz, but still near nine-month lows
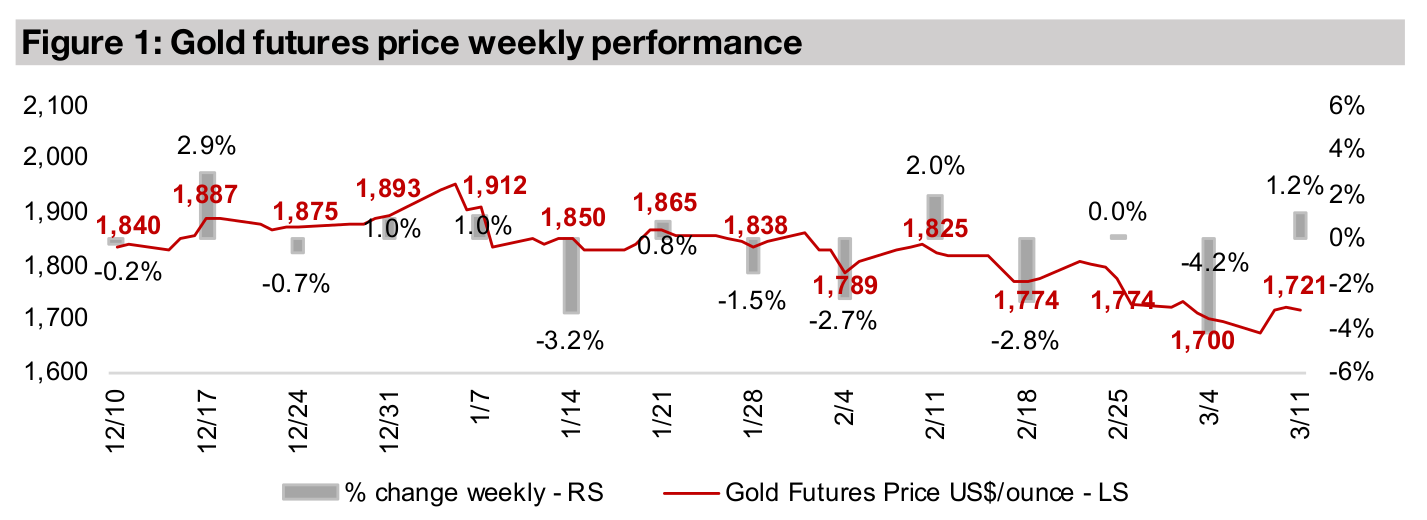
Gold picked up 1.2% this week to US$1,721/oz, as there was an easing in bond yields, which have recently been pointed to for the pressure on gold, while an ongoing massive money printing continues to fundamentally support gold.
Base metal performance catches up with gold and silver
With gold and silver, the closest monetary substitutes of the metals, sliding in recent months, this week we look at non-monetary base metals, many of which have had a considerable bounce because of the broader economic recovery.

Gold price regains US$1,700/oz level
The gold price picked up 1.2% to US$1,721/oz this week, after touching as low as US$1,678/oz, and continues to trade at its lowest levels since June 2020. Pressure on gold has mainly come from rising bond yields, in turn driven by rising inflation expectations. While we might expect such expectations to drive up an inflation hedge like gold, especially with other similar plays like equity and bitcoin surging, gold has continued to trend down. However, for those concerned that the current dip is echoing the 2011-2012 period, we note that the 2012-2018 gold bear market was marked by exceptionally low global inflation, which we don't expect to be repeated. With fiat currencies becoming progressively devalued versus gold via historically massive money printing, we believe that gold has very strong fundamental support. While we acknowledge that gold's peak in mid-2020 was driven by an outsized, temporary fear, even before the global health crisis, gold breached US$1,600/oz. So even taking out the global-health-crisis-fear-premium entirely and starting at the early 2020 level, pricing in the subsequent money printing over the past year, we believe gold should fundamentally trade at least at current levels, if not substantially higher.
Base metals performance catches up with gold and silver
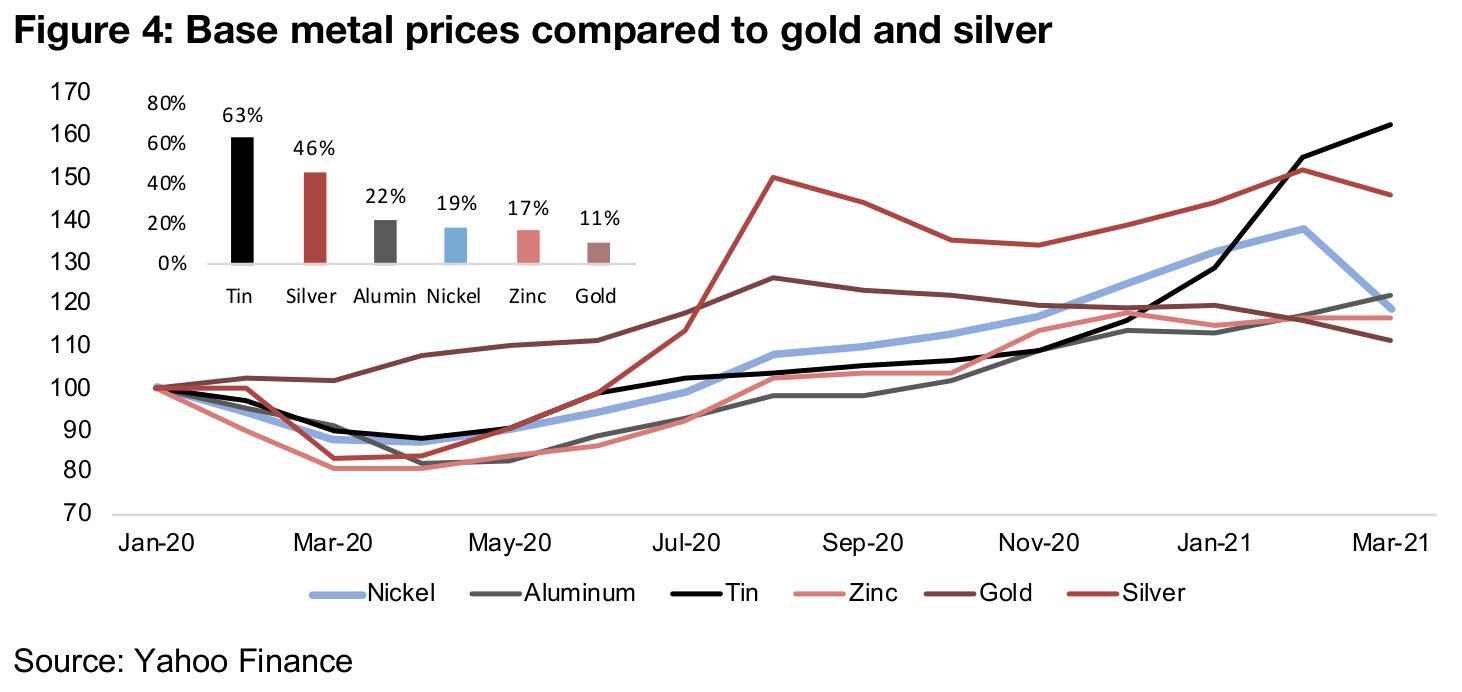
As gold's gains since the start of 2020 have eased over the past six months, the price performance of many base metals, including nickel, zinc, aluminum and tin have caught up significantly to gold since H2/20. The tin price is up 63% since January 2020, edging above even silver's impressive 46% run, with aluminum, nickel and zinc up 22%, 19% and 17%, respectively, outpacing gold's 11% gain (Figure 4). This has been driven by rising overall global macroeconomic demand off the mid-2020 lows, which has been supported by a massive monetary and fiscal global stimulus. Beyond this, however, each of these four base metals have specific industry drivers which explains the spread in the gains across metals, which we go into in detail below.
Nickel driven by electric story, recent pressure from China supply
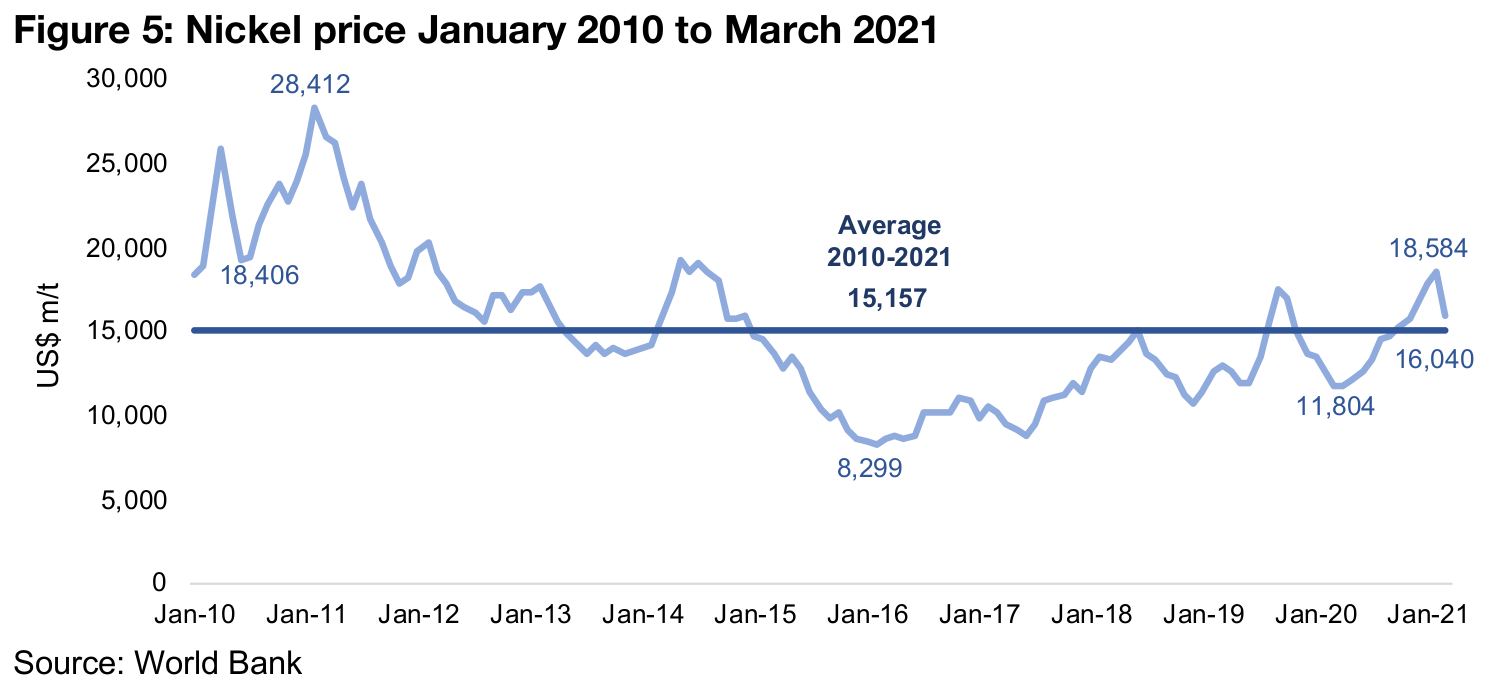
Nickel prices have seen a strong performance over the past year, rising 35.4% to
US$16,040 m/t off a trough at US$11,804 m/t in April 2020 following the market crash.
While over the past week, the nickel price has dipped on news that supply out of
China, a major global nickel producer, is likely to increase on a new technological
development, it is still above its average over the past decade of US$15,157 m/t.
Longer-term, nickel has still not returned to highs set in 2011 at US$28,412 m/t, with
oversupply conditions generally persisting, except for a temporary rise in 2014 after
Indonesia, major producer of nickel, banned direct shipping of ore (Figure 5).
Prices began to pick up in 2017, as production flattened, driven in part by Philippines,
another larger producer, which shut down some operations for environmental issues.
From this point, expectations for nickel started to shift to the potential for huge long-
term demand from the shift to electric power, both for energy storage and electric
vehicles, and had reached five years highs in early 2020. Supply cuts related to
production shutdowns from the global health crisis drove the rising price in 2020, and
it remains to be seen how much the new development for supply from China will
continue to pressure the nickel price for the remainder of this year.
Aluminum prices continuing to rise, China will remain key factor
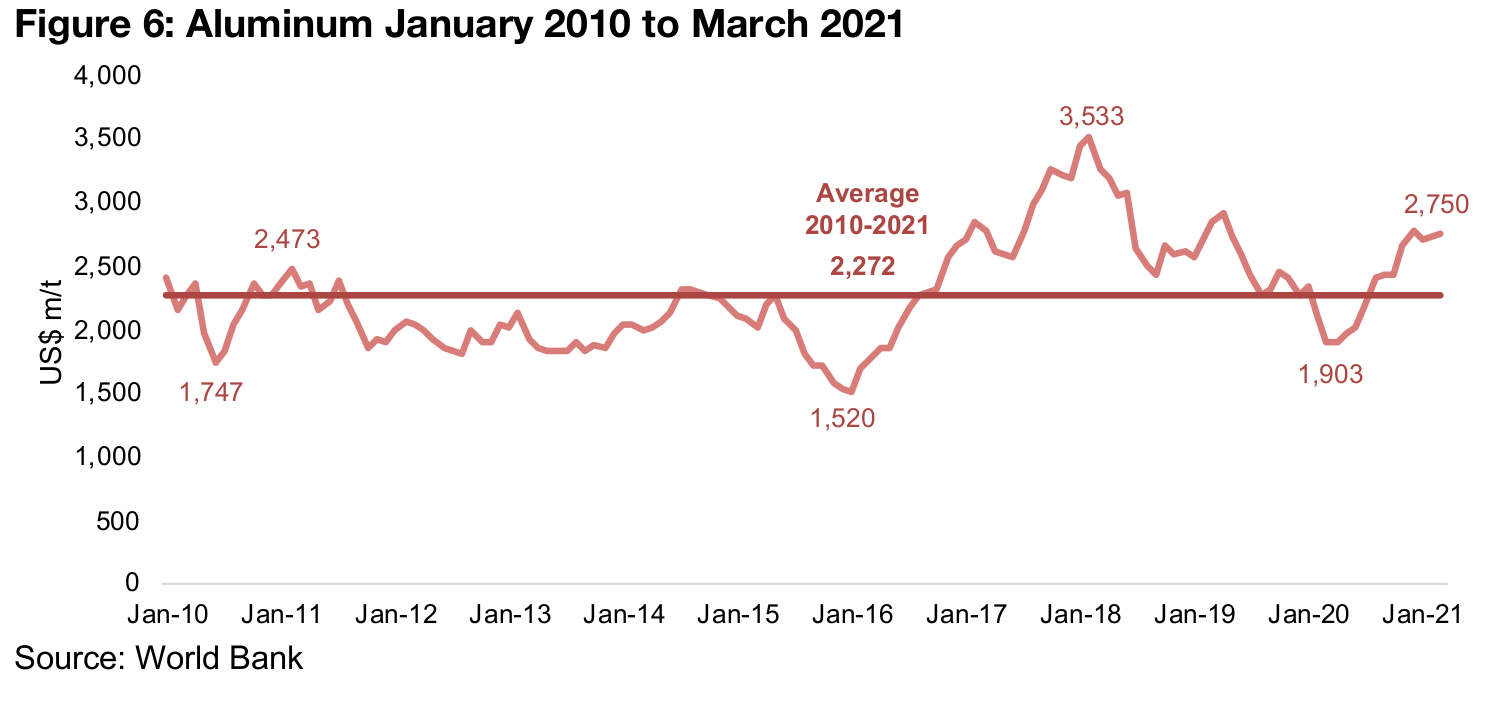
Aluminum prices have reached US$2,750 m/t this year, rising 44.5% from a trough
of $1,903 m/t in April 2020, and had risen above its average of US$2,272 m/t over
the past decade (Figure 6). As with other many major metals, aluminum prices peaked
in 2011, and trended down for the next several years. This was driven by global
oversupply, as many countries kept production high, expecting high China import
demand, but China met most of its demand with domestic production. Aluminum
prices picked up from 2016-2017, as global aluminum players cut capacity due to
margin contraction as price of alumina, a key input, rose.
However, with industrial production slowing down in China, aluminum prices again
declined through 2018 and 2019, before reaching a trough in the global economic
crisis. As with the other base metals, production shutdowns curbing supply and a
major monetary and fiscal stimulus from the global health crisis drove up demand,
and prices have continued to pick-up. The main driver for aluminum will continue to
be China, where economic demand continues to pick up, even as aluminum demand
outside of China is expected to decline. In terms of supply, China is rapidly expanding
capacity, while supply outside China is moderately increasing.
Tin price soars to highest levels in almost a decade
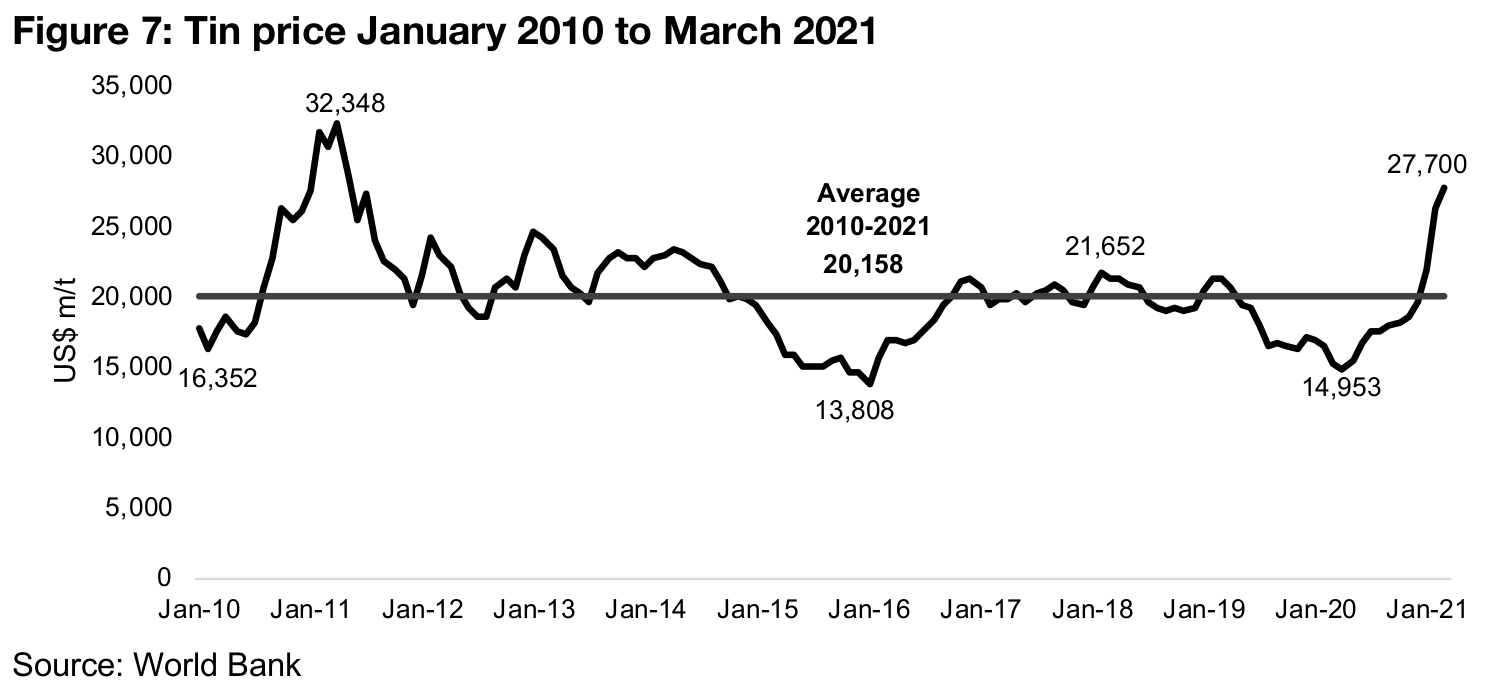
The tin price has soared to 27,700 m/t, up 85.2% off of lows of 14,953 m/t in April
2020, to its highest levels since 2011, when it peaked at US$32,348/mt (Figure 7).
Supply remains tight driven in part by shutdowns in 2020 related to the global health
crisis, with major shutdowns in South America, a key source of supply, while China
has been stockpiling tin as part of its drive to become self-sufficient in
semiconductors. Supply is low even as demand, especially from the electronics
industry, has continued to grow, both from consumer electronics and the rollout out
of next generation cellular phone networks, driving demand for tin from both handset
producers and for infrastructure.
Having spiked in 2010-2011, along with most other metals, in the rebound from the
global financial crisis, tin prices declined to around the ten-year average from 2013-
2014. Prices dipped from 2015 as there was a fall in demand from China, which
accounts for 50% of tin imports, and then recovered in 2016 as there were concerns
over China and Indonesia supply constraints as demand rose. Tin then traded around
the ten-year average from 2017-2018, before declining through 2019 as global
economic growth slowed, and reached a trough during the March 2020 crash, before
the current ramp up began.
Zinc prices could continue to rise on contraction in surplus
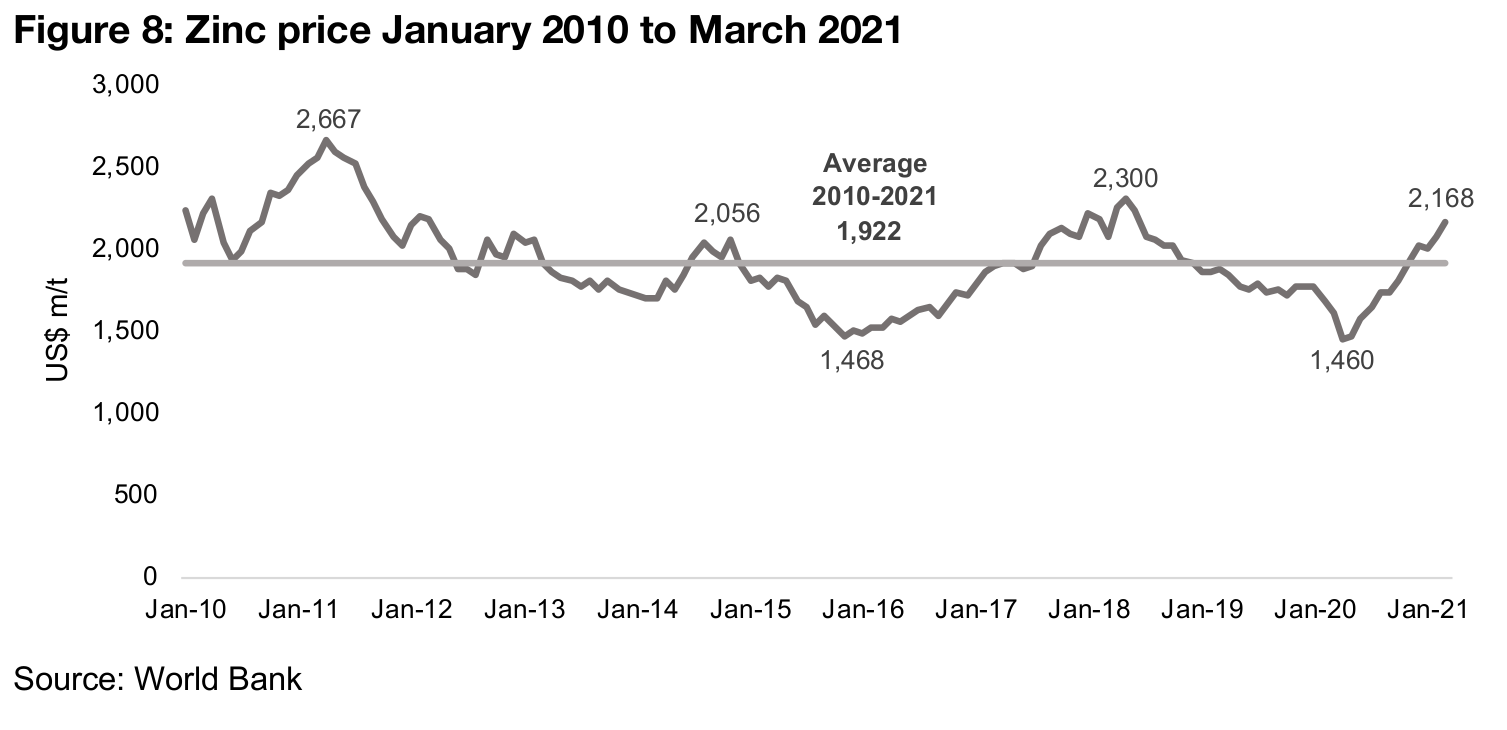
The Zinc price has risen to US$2,168 m/t, up 48.5% from April 2020 lows of US$1,460 m/t, on the rebound in the global economy (Figure 8). Zinc prices could continue up this year, as the global zinc surplus is expected to contract, with rising global demand offsetting a major increase in output in China in response to domestic demand. Zinc prices peaked in April 2011 at US$2,667 m/t, and trended down for the next five years to lows of US$1,468 m/t, as zinc mine output was generally strong and inventory stockpiles were rising, apart from a brief uptrend in 2014. Prices then picked up from 2016 to 2018, as demand recovered, partly on Chinese infrastructure development, while supply tightened, with prices reaching 2,300. The zinc price again declined from H2/18 through to early 2020 on increased supply, as the pick-up in prices in 2017- 2018 lead producers to bring some capacity, which had been left idle during the 2015-2016 price trough, back online.
Producers nearly all up on gold price pick up
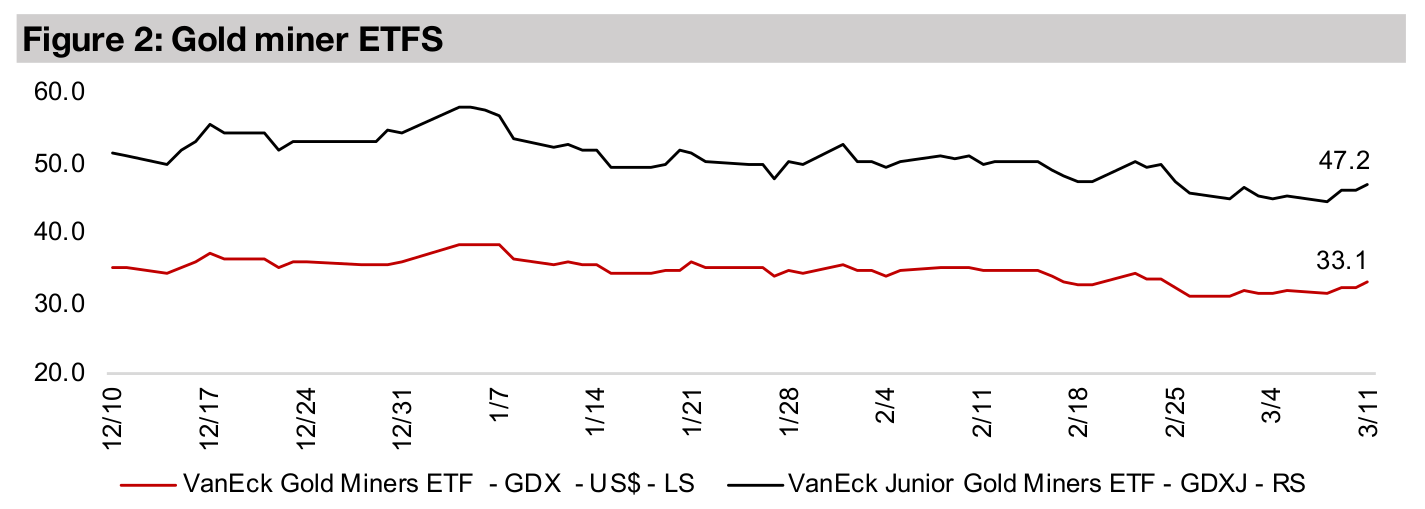
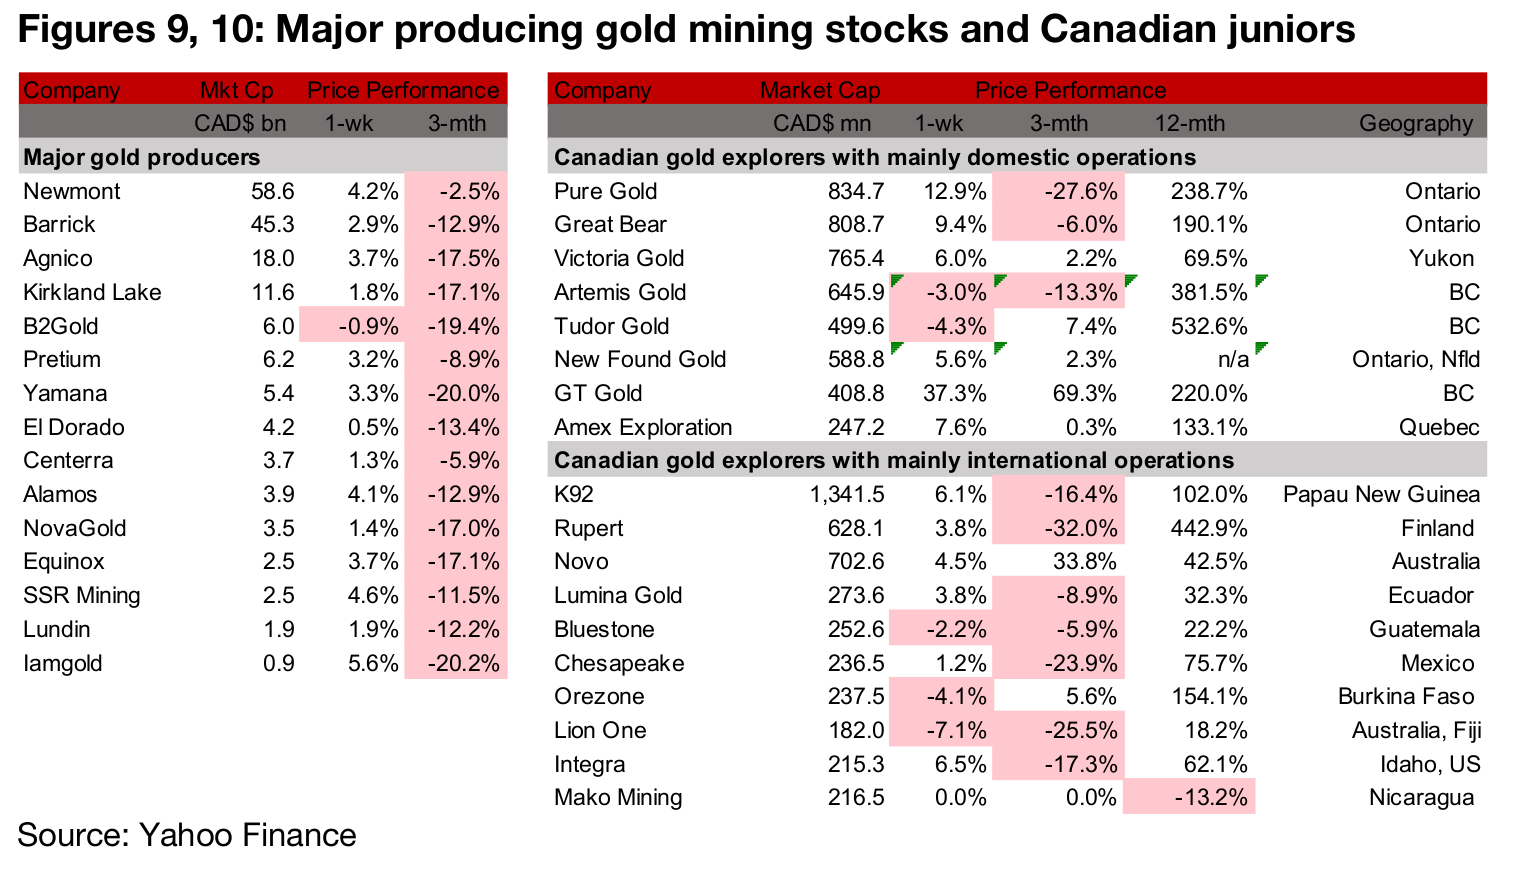
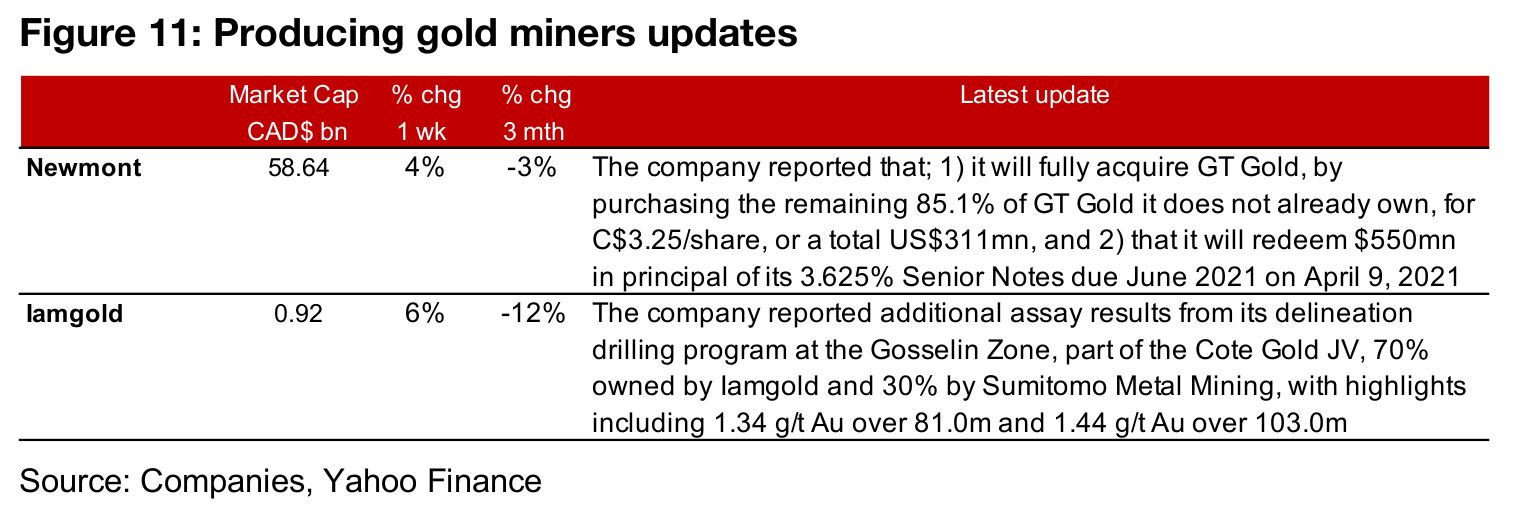
The producing miners were nearly all up as gold rose, with news flow limited (Figure 9). However, there was a critical piece of news related to the junior mining space, with Newmont acquiring Canadian junior gold miner GT Gold, purchasing the remaining 85% of the company it did not yet hold, where it previously held a 15% stake. This could be the start of increased acquisition activity in the sector, as the majors start to seek out new targets in the junior space. The other news from the majors was Iamgold reporting additional assay results from its drilling program at the Gosselin zone of the Cote Gold project (Figure 11).
Canadian juniors mixed as gold picks up
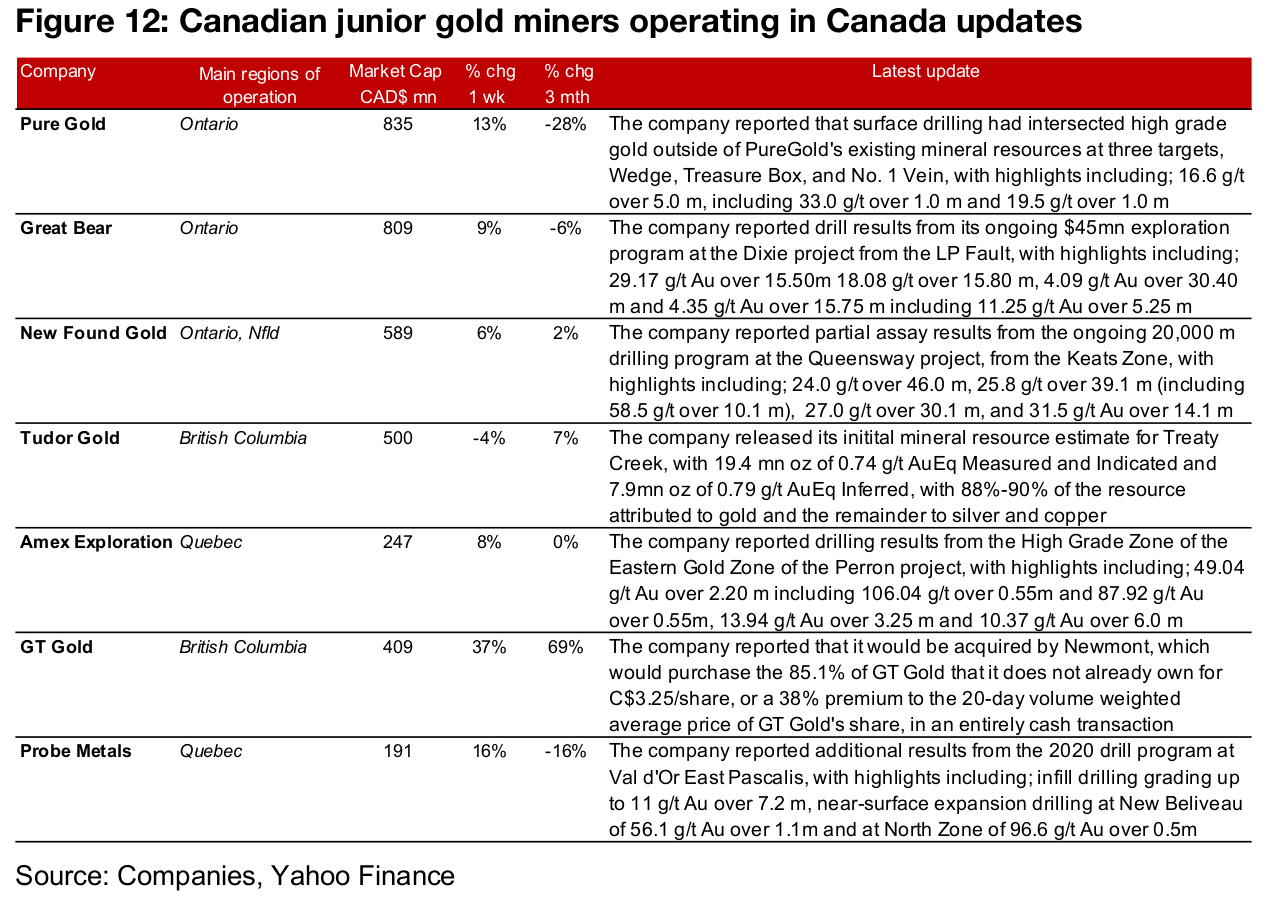
The Canadian junior miners were mostly up as gold rose (Figure 10). For Canadian juniors operating mainly domestically, there were several updates on ongoing drilling programs from Pure Gold, Great Bear, New Found Gold, Amex and Probe Metals. Tudor Gold reported an initial mineral resource for Treaty Creek, in what was possibly some of the most important recent news for the sector, GT Gold announced that it would be fully acquired by Newmont, possibly heralding the start of a new M&A wave for the junior miners. (Figure 12). The only news from the Canadian juniors operating largely internationally was from Lion One, which reported that it mobilized two new rigs at Tuvatu, bringing the total to six as they head into Fiji's dry season, and the company also reported drilling results from the Tuvatu project (Figure 13).

In Focus: Canada Nickel Company (CNC.V)
Crawford Nickel-Cobalt Sulphide project with limited exploration prior to CNC
Canada Nickel company operates the Crawford Nickel-Cobalt Sulphide project, a new discovery ranking in the top ten largest nickel sulphide deposits globally. It is adjacent to existing infrastructure north of Timmins, Ontario, with the province one of the world's leading mining districts. The project had seen limited exploration until recently because of institutional and cyclical factors; 1) while it saw limited exploration in the 1960s, activity was minimal in the 1970s and 1980s, as the land was owned by a forestry company until it was acquired by Noble in 2011 and 2) the decline in nickel prices from 2011 to 2018 lead to another period of limited exploration, with Canada Nickel only actively exploring the project over the past two years.
Targeting PEA by Q2/21, MOU signed with Glencore for mill use
Initial metallurgical testing for Crawford has confirmed strong nickel recovery of 46%, 51% and 52% from the first three locked cycle tests. The company has released its initial mineral resource for the project, and is currently preparing a PEA for the project which is expected to be released by Q2/21, with a Feasibility Study targeted by the end of 2021. An MOU has been signed with Glencore for the potential use of its Kidd Creek mill and met site which would significantly lower the initial capital costs of the project.
Total M&I and Inferred mineral resource of 2,873.1 kt nickel, 148.8 kt cobalt
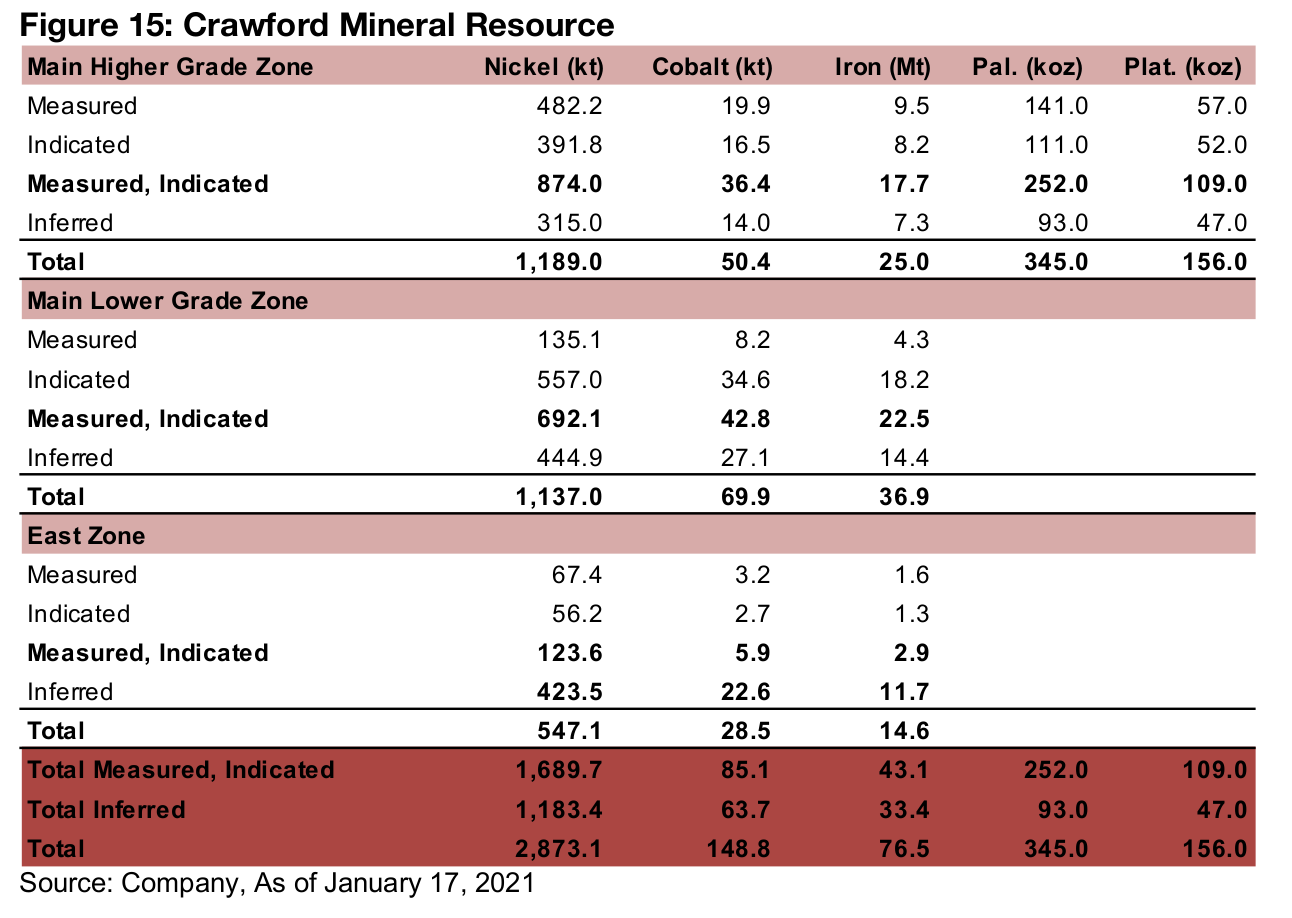
The project has a total mineral resource, measured, indicated and inferred, of 2,873.1 kt nickel, 148.8 kt cobalt, 76.5 Mt iron, 345k oz Palladium and 156k oz Platinum (Figure 15). Of the nickel resources, 59%, or 1,689.7 kt, are measured and indicated, with the rest inferred. The mineral resource has been estimated across three zones of the project, with 1,189.0 kt of M&I and Inferred nickel resources in the Main Higher Grade Zone, 1,137.0 kt in the Main Lower Grade Zone, and 547.1 kt in the East Zone.
Recent news flow on financing, resource upgrade and new discoveries
The company completed a $13mn bought deal private placement and updated the mineral resource in October 2020, and filed an NI 43-101 in December 2020 and an amendment to this filing in January 2021. The company also announced a third new discovery (beyond the two zones shown in Figure 17) in October 2020 and in December 2020, a fourth discovery. Metallurgical results for Crawford were released in December 2020 and January 2021, and an MOU was signed with the local Taykaw Tagamou Nation local community in December.
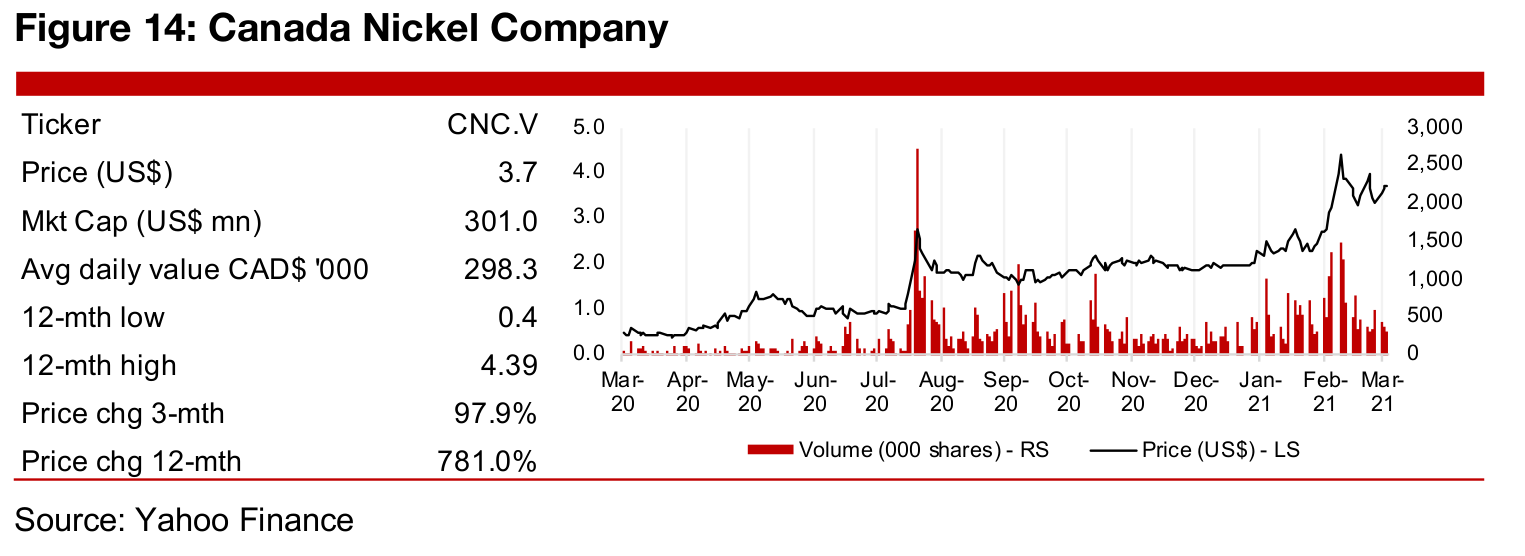
Share price up 97.9% over past three months
Canada Nickel has risen 781.0% over the past twelve months, with most of the gains in the past two months, on the operational progress, as well as the surge in the nickel price, although nickel has dipped in the past week on news of rising supply to potentially come out of China. The main upcoming catalysts for the share price will be the announcement of the PEA, which is targeted for early Q1/21 and any continued pressure on the nickel price.
Disclaimer: This report is for informational use only and should not be used an alternative to the financial and legal advice of a qualified professional in business planning and investment. We do not represent that forecasts in this report will lead to a specific outcome or result, and are not liable in the event of any business action taken in whole or in part as a result of the contents of this report.


