July 01, 2024
Banks and Institutions Split on Gold Outlook
Author - Ben McGregor
Banks bullish and institutions bearish on gold for H2/24
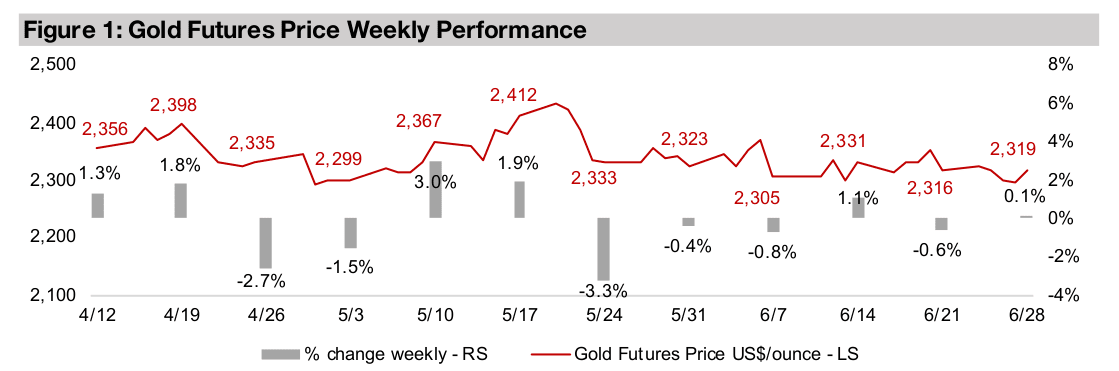
Gold was near flat, up 0.1% to US$2,319/oz, and has traded quite closely to the average US$2,336/oz since April 2024, with the full year forecasts of the investment banks implying a rise, and the major institutions a decline, in H2/24 for the metal price.
Mining valuations still near bottom of major global sectors
This week we look at the mining sector’s performance year to date and price to book valuations which are both near the bottom of the major global sectors, even given gains for most of the major metals this year, as markets remain focussed on tech.
Gold stocks down on flat metal price and mixed equities
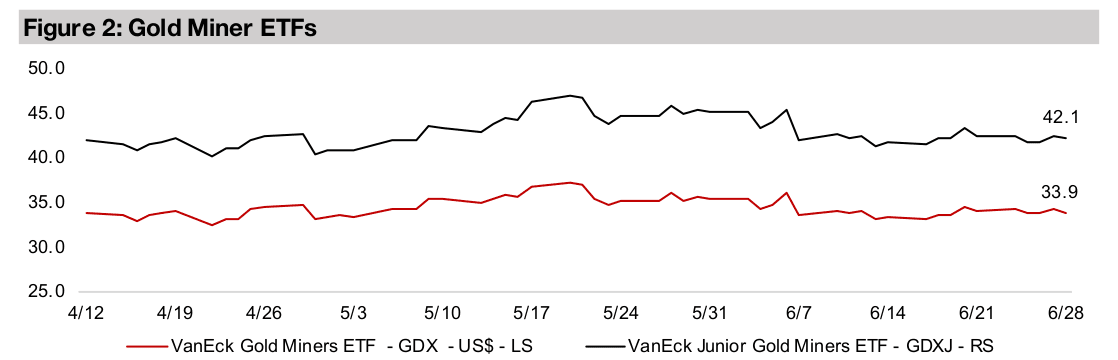
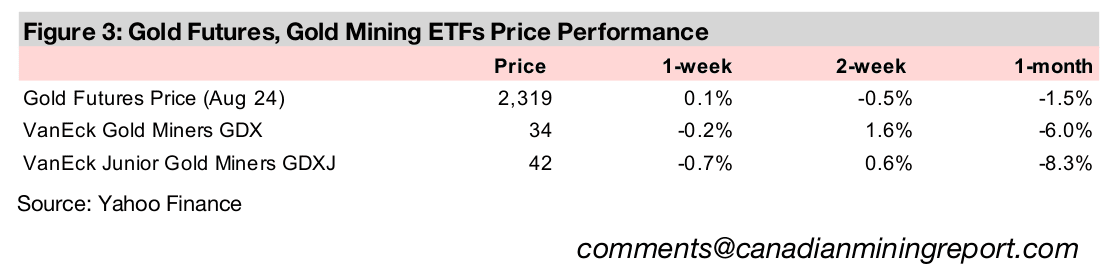
After holding up last week even as the metal price declined, the gold stocks capitulated given a lack of movement in gold, even as there was some support from equity markets, with the GDX down -0.2% and the GDXJ off -0.7%.


Banks and Institutions Split on Gold Outlook
Gold was near flat for the week, with the futures up just 0.1% to US$2,319/oz, as the US Personal Consumption Expenditure Price Index was the only major economic release and was inline with expectations with both the headline and core figure up 2.6% year on year. There was some degree of risk-on in equity markets with the Russell 2000 up 1.21% and Nasdaq gaining 0.52%, but large caps overall stagnated, with the S&P 500 rising just 0.02%. After holding up last week even as the metal price dipped, the gold stocks capitulated with the GDX ETF of producers down -0.2% and GDXJ of juniors down -0.7%, even given the overall rise in small caps.
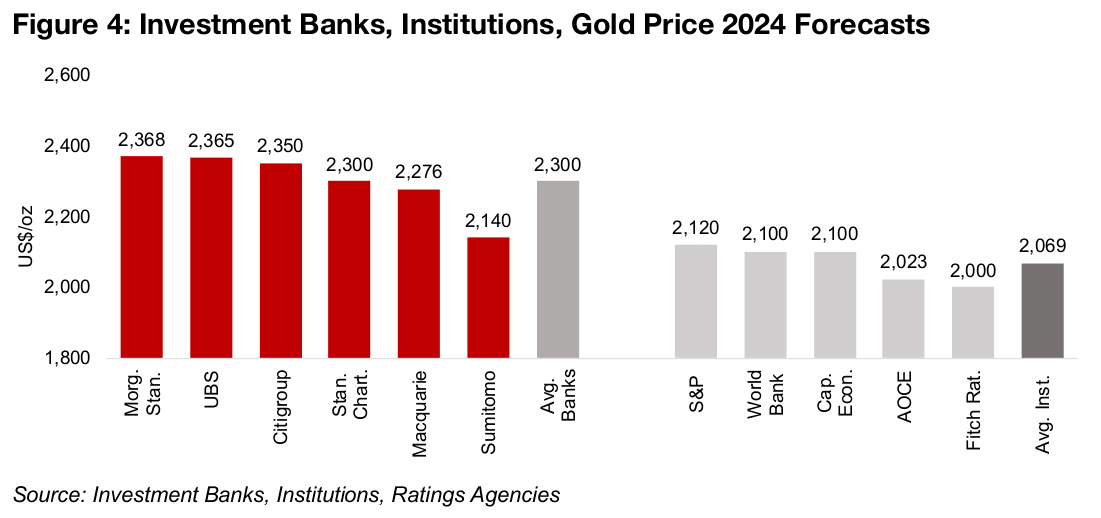
Bullish bankers and bearish institutions split on gold forecasts
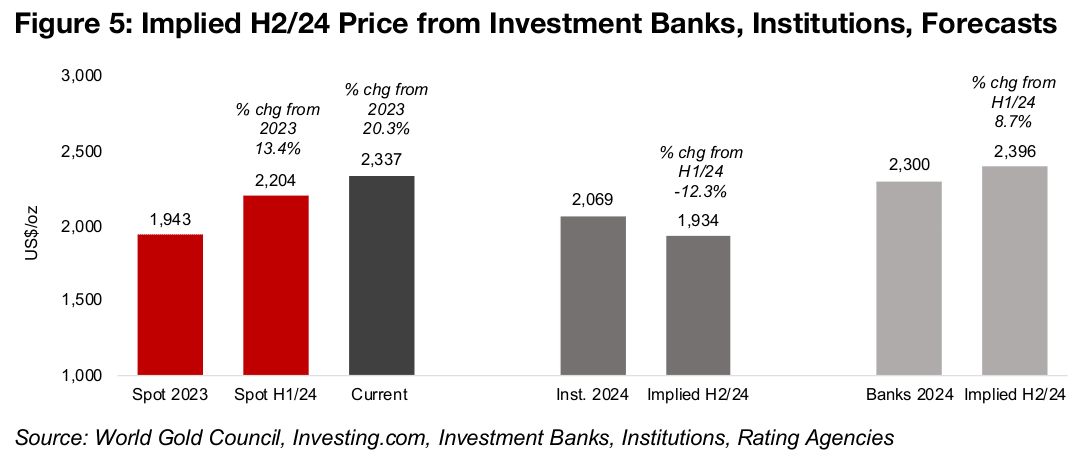
The market appears have viewed the upside and downside drivers for gold as balanced for the past three months, with the price deviating little from its US$2,336/oz average since April 2024. The gold price averaged US$2,204/oz over H1/24, and for the second half of the year key forecasters appear split on the outlook for the metal. The investment banks are more bullish, with the average of the targets from Morgan Stanley, UBS, Citigroup, Standard Chartered Bank, Macquarie and Sumitomo at US$2,300/oz for 2024 (Figure 4). The average target of the institutions, including the World Bank (WB), Australia’s Office of the Chief Economist (AOCE), the rating agencies S&P and Fitch and research firm Capital Economics, is just US$2,069/oz.
This implies quite a different outlook for the gold price for the second half of 2024.
Given gold’s average of US$2,204/oz over H1/24, to reach the US$2,069/oz target of
the institutions implies gold would average just US$1,934/oz over H2/24, or a -12.3%
decline from first half 2024 (Figure 5). This contrasts with the investment banks, where
their US$2,300/oz full year 2024 target implies a H2/24 gold price of US$2,396/oz, or
an 8.7% rise in the second half of this year.
Given the current spot price of US$2,337/oz and consolidation around an average
above US$2,330/oz for several months, realizing the institutions’ implied H2/24 target
would require a major reduction in economic and geopolitical risks. However, we
expect that both these types of risks will remain elevated for the rest of the year. They
could well be high enough to get the extra US$50/oz out of gold that would see it
reach the investment banks’ implied target, if not significantly more. While their 2024
targets do not breach US$2,400/oz, several of the banks are already forecasting such
further upside for gold heading into next year, with targets as high as US$2,500/oz.
Institutions' structural tendency towards underestimating gold
In distinct contrast, WB forecasts a decline in gold for 2025, by -2.4% to US$2,050/oz
and the AOCE near flat gold, up 0.35% to US$2,030/oz, respectively. This is partly
because forecasting a significant jump in gold tends to indicate negative economic
or geopolitical outcomes, as it is a risk hedge. The major institutions generally tend
away from predicting such downside events, except during periods of clear crisis
where a weak forward year has become obvious. Otherwise, they tend to forecast a
smoothed upward long-term trend, as short-term economic dips are difficult to
predict and incorporate in their estimates.
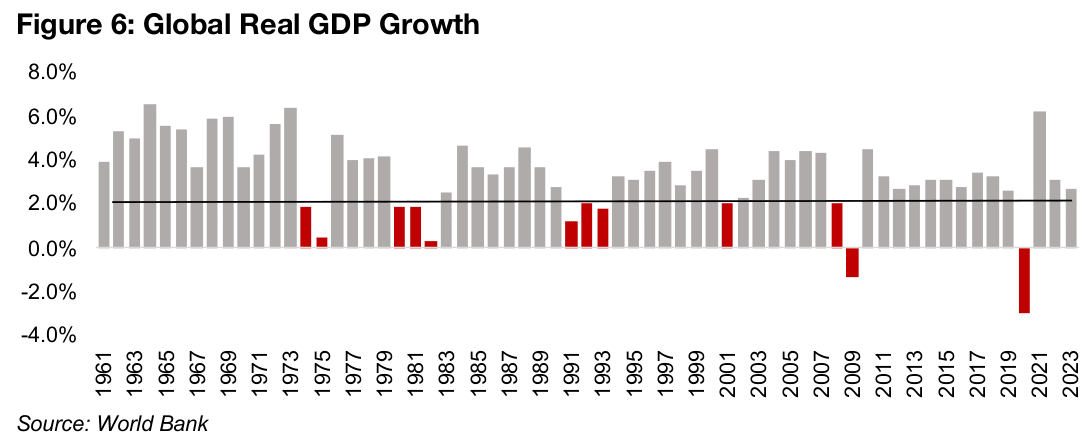
Also, on average the economy does indeed trend upward in most years, with actual
contractions in global real GDP growth very rare. A rate of 2.0% or below can be
applied as a benchmark for a relatively weak year, and global real GDP growth
dropped below this level in only twelve of the sixty-three years from 1961 to 2023
(Figure 6). Therefore, assuming an economic uptrend in a given year is the highest
probability forecast. However, there are certain times where risks have clearly built
up to a level that negative short-term economic outcomes are becoming increasingly
probable, and in our view the current period is one of these.
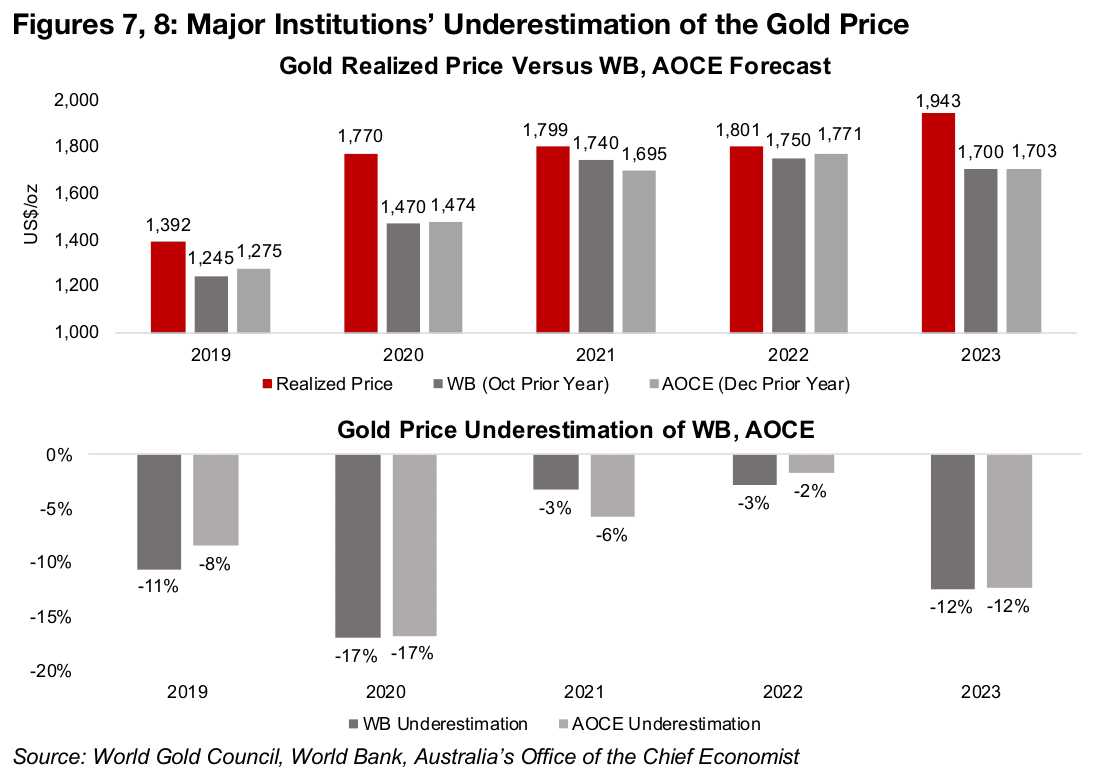
These institutional tendencies explain to some degree why we see a significant
underestimation of the gold price by both the WB and AOCE since 2019. Figure 7
shows the actual realized average gold spot price for the year versus estimates from
both institutions. The WB’s estimate is from the October release of its biannual
Commodities Outlook report prior to the year being forecast. The AOCE’s estimate is
from its quarterly report in December before each year being forecast.
Both the World Bank and AOCE underestimated the gold price in every year from
2019 to 2023, and by a significant margin for most years, coming in below by an
average 9.0% per year (Figure 8). Only in 2022 were both sources close to the realized
price, although interestingly this was also a year when gold was almost flat, averaging
US$1,801/oz compared to US$1,799/oz in 2021. This of course just happened to be
inline with the institutional tendency against big jumps in their gold forecasts,
although ironically 2022 was obviously a year of major economic disruption overall.
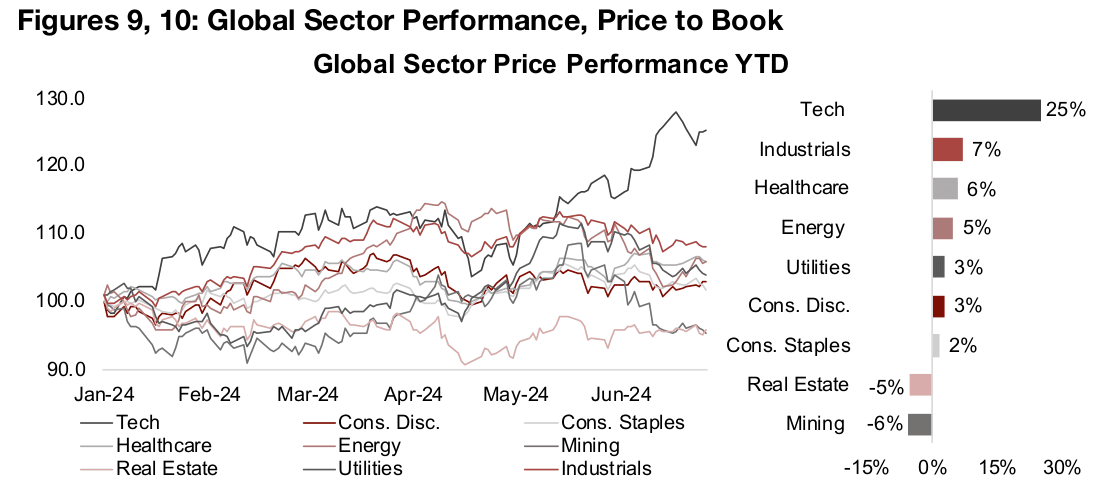
Mining performance and valuations at bottom of global sectors
Mining equities overall have struggled this year, with the -6% decilne in the ishares MSCI Metals and Mining Producers ETF (PICK) the worst performance of the major sectors (Figure 9). Global tech has been the strongest, rising 25% and surging ahead of the rest of the market over the past month after a few sectors had been able to keep pace with it until mid-May 2024. This is far ahead of the next best performers, global industrials, healthcare and energy, which rose only by mid-single digits, with rest of the sectors near flat or down for the year.
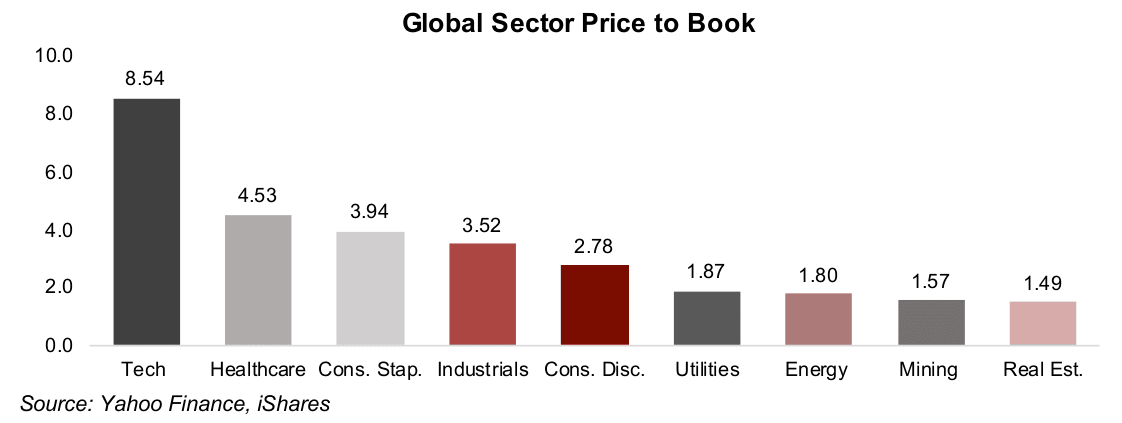
Mining valuations are also low, with global mining’s price to book (P/B) at just 1.57x
the second lowest of major sectors, with real estate’s 1.49x P/B at the bottom (Figure
10). Tech again leads the markets, with a price to book of 8.54x about twice the level
of the next highest sector, healthcare, at 4.53x. While there had been signs earlier
this year that the tech euphoria was waning, another burst has erupted over the past
month and half. The main question is whether this is a final ‘supernova’ as the sector’s
high and rising valuations price in expectations that are increasingly difficult to meet.
Combined with the relatively low valuations of many other sectors which could
eventually draw interest from the market, we expect that balance will eventually be
restored by a rotation away from tech. The mining sector could benefit from such a
move, as its multiples are extremely low overall even though metals prices have been
reasonably strong this year overall. While metals prices dipped in early 2024 through
to February, they rose from March to mid-May 2024, and while pulling back in June
from a degree of speculative overheating, most are still up strongly year to date.
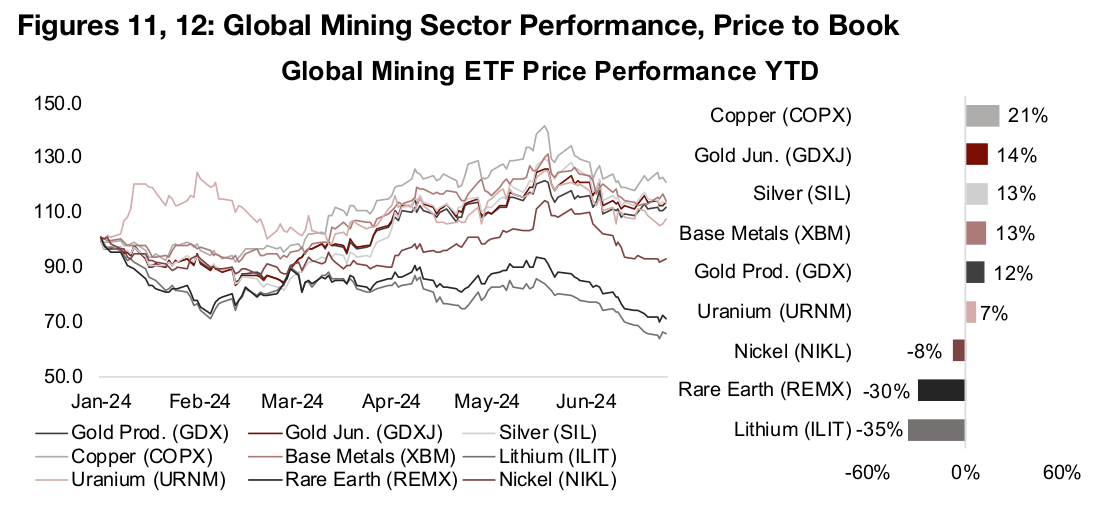
The major producing mining sector ETFs largely followed these trends in underlying
metals prices and most have seen a decent performance this year (Figure 11). The
copper producer ETF COPX has been the strongest, up 21%. The major precious
metals ETFs have all seen nearly the same level of gains, with the GDX ETF of gold
producers up 12%, the GDXJ ETF of gold juniors rising 14% and the SIL ETF of silver
producers gaining 13%. The uranium producers ETF URNM is also up, but around
half the level of the precious metals, with a 7% gain.
Notably most of the sector ETFs have substantially outperformed the ishares MSCI
Metals and Mining Producers ETF (PICK), which would not seem to follow given its
exposure to these sectors. However, one critical metal, iron ore, is missing, given that
there is no separate producer ETF for the sector. Iron ore has been a major
underperformer this year, and many of the largest stocks in the PICK ETF are heavily
exposed to the metal, dragging down its performance significantly.
While the base metals producers ETF XBM has significant exposure to iron ore, this
has been offset by a heavy weighting of copper stocks, driving a 13% gain. A drop in
nickel and lithium have also been a drag on the mining sector, pulling down the nickel
producers ETF NIKL -8% and lithium producers ETF ILIT -35%. Weak lithium is also
a factor in the -30% drop in the Rare Earth and Strategic Minerals ETF, REMX, with
the ‘strategic minerals’ component having a heavy lithium stock weighting.
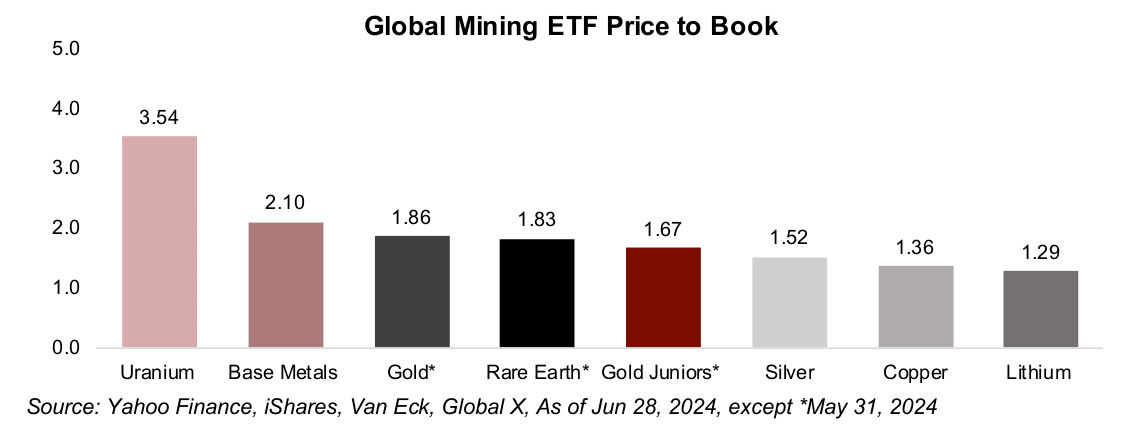
Even with the rise in the gold, silver and copper stock ETFs, their price to book ratios
have remained relatively low, with all trading at well below a 2.0x P/B (Figure 12). This
implies that the market is not extrapolating that the sector’s currently strong operating
performance will be maintained. This is in strong contrast to the extreme multiples for
tech which imply the current high earnings growth will be sustained indefinitely. The
continued caution on the mining sector even in the face of rising metals prices would
appear to leave the sector a reasonably wide margin of safety against a downturn.
Price to book multiples of 1.0x or below are generally considered inexpensive for a
company not in severe operational distress, and the P/B’s of several of the mining
sector ETFs are still only moderately above this level. The only sector where the price
to book ratios are looking somewhat high is uranium, with a 3.54x multiple far above
the rest of the producer ETFs. The lithium multiple is at the low end of the group, at
just 1.29x, after pricing in the major slump in the metal price over the past two years.
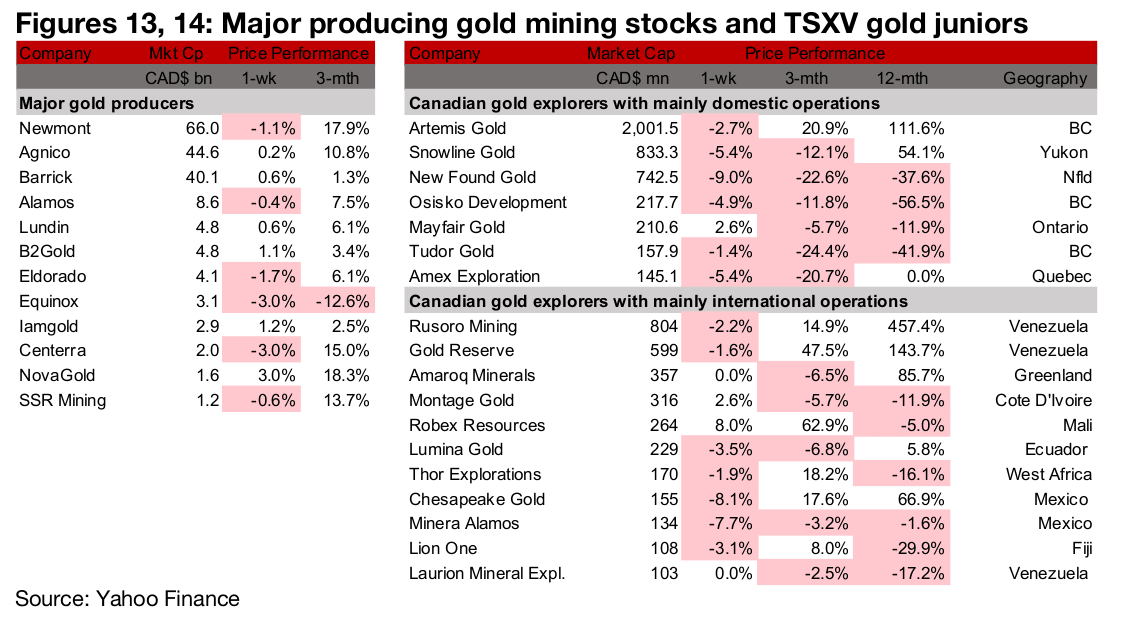
Producers and TSXV large cap gold mixed
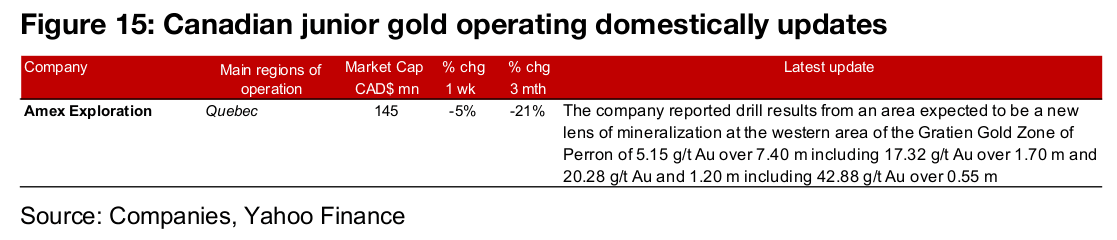
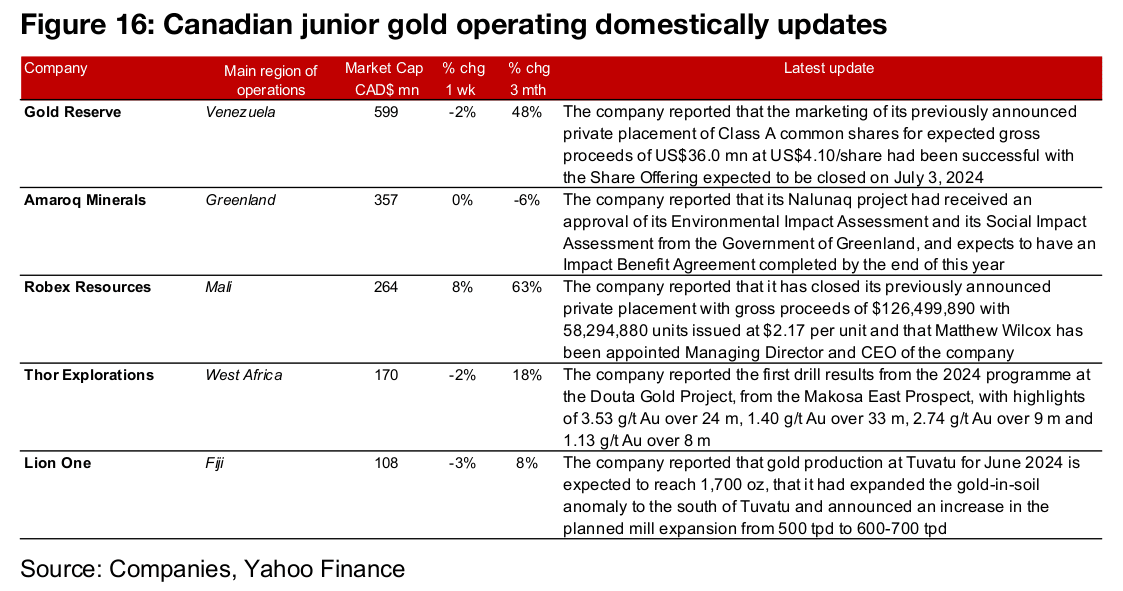
The large gold producers and the TSXV large cap gold were mixed (Figures 13, 14). For the TSXV gold companies operating domestically, Amex reported drill results from the western area of the Gratien Gold Zone of the Perron project (Figure 15). For the TSXV gold companies operating internationally, Gold Reserve reported that it has completed marketing its US$36.0mn private placement and Amaroq received its Environmental Impact Assessment and Social Impact Assessment approvals for Nalunaq (Figure 16). Robex closed its previously announced $126.5mn private placement and appointed Matthew Wilcox as Managing Director and CEO of the company, Thor Explorations reported drill results from Douta and Lion One reported June 2024 production from Tuvatu, the expansion of a gold-in-soil anomaly South of Tuvatu and an increase in the tonnes/day of its planned mill expansion.
Disclaimer: This report is for informational use only and should not be used an alternative to the financial and legal advice of a qualified professional in business planning and investment. We do not represent that forecasts in this report will lead to a specific outcome or result, and are not liable in the event of any business action taken in whole or in part as a result of the contents of this report.