March 13, 2023
Bank Runs Versus Gold Safety
Author - Ben McGregor
Gold gains as tech and crypto banks collapse
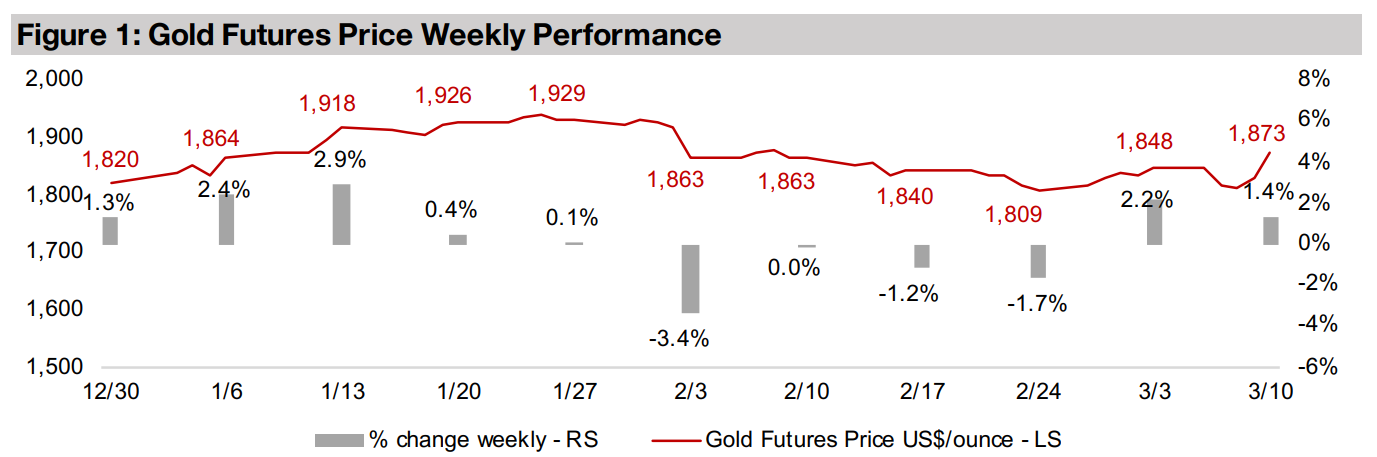
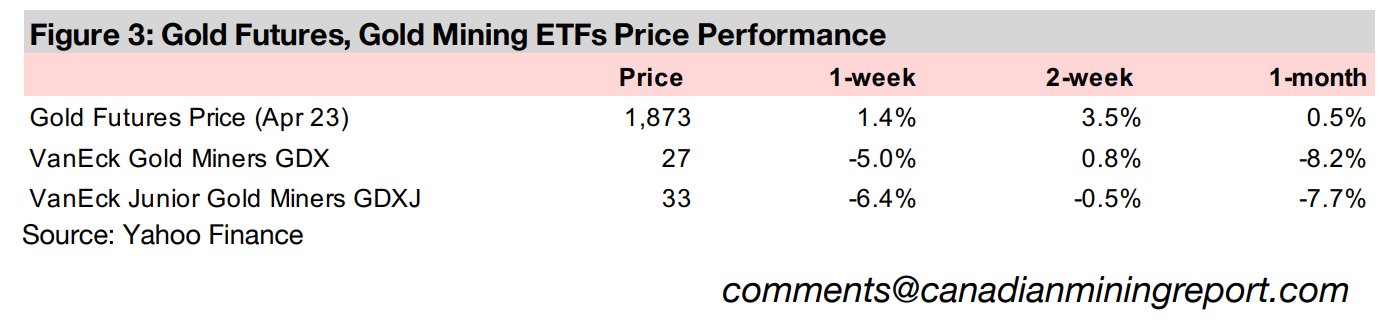
Gold rebounded 1.4% this week to US$1,873/oz, driven by the collapse of two US banks, tech-focussed Silicon Valley Bank and cryptocurrency-concentrated Silverlight Capital, with equity markets plunging and a flight to safety, including gold.
Gold's safety highlighted by issues at Silicon Valley Bank
This week we look at the collapse of Silicon Valley Bank, which was hit by a downward valuation of its bond holdings and declining deposits, and how crises like this in banking and in cryptocurrency over the past year highlight gold's safety.
Producing and junior gold down on equity decline
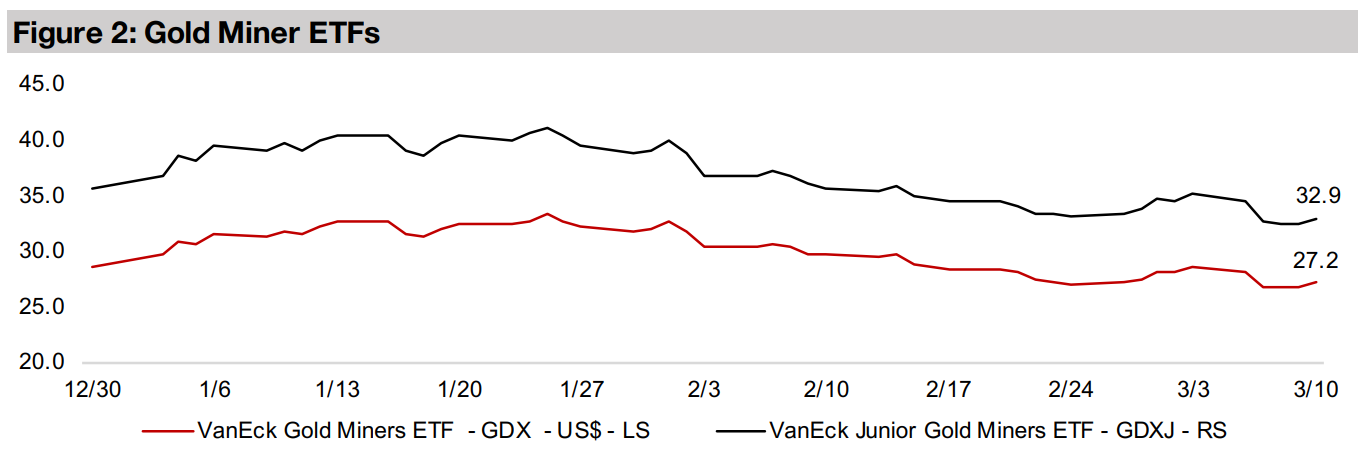
The producing and junior gold miners fell, with the GDX down -5.0% and GDXJ declining -6.4%, although the TSXV gold juniors were mixed, as a rise in gold was offset by a slump in the equity markets on the collapse of the two US banks.


Banks Runs Versus Gold Safety
Gold rose 1.4% to US$1,873/oz as there was a flight to safety as two large US banks collapsed in a single week. The most critical of the two failures was Silicon Valley Bank (SVB), which has been important in funding venture capital-backed companies in the tech space. The company saw a decline in the value of its investment portfolio and then a major withdrawal of deposits by clients, which became a bank run, with its stock plunging -60.4% in a single day on March 9, 2023 and it being shut by regulators by March 11, 2022. Also this week, Silverlight Capital, a bank heavily involved in the cryptocurrency space, announced that it would be closing down, in order to prevent a worsening of a similar run on deposits that it had been facing.
Setting the stage for Silicon Valley Bank's crisis
To understand SVB's current crisis, we need first consider its customer base, and
how this would affect both sides of the company's balance sheet. SVB customers
were largely venture capital-backed companies, which would raise cash from
investors, and then deposit this with SVB. SVB would need to then pay interest on
these deposits, and then lend out this cash at rates above the deposit rates they were
paying, which is the standard banking business model. Important here is that making
loans tends to generate higher rates for banks, given their higher risk, but that some
cash may also be placed investments like bonds or securities, although the rate
generated tends to be lower, so banks will prefer to make loans, all else equal.
What made the SVB situation different however, is that these venture capital
companies were also where SVB would target lending money. However, many of
these companies, often flush with equity funding, did not need to take on debt, or
were pre-revenue and could not meet the more stringent requirements to take out
loans. This was different to a typical bank which would lend across a range of
industries to well-established companies which could meet the requirements to take
on debt, and also prefer debt financing, which is generally cheaper than equity.
First big disruption was a surge in deposits in 2021
This business model was working well for SVB until the disruptions caused by the global health crisis. In 2020, deposits were US$102.0trn, and SVB lent out about 44% of this, or US$45trn, and placed the rest into investments, with the rate on loans and investments combined considerably higher than what they paid out on deposits (Figures 4-7). The first signs of trouble were when deposits into SVB surged 85% to US$189.2trn in 2021, but loans only increased 47% to just US$65.9trn. This drove loans down from 39% of the asset base to just 31%, with investments surging from 43% to 61%. While other banks may have been able to find customers to lend out this huge inflow of deposits to, many of SVB's equity funded tech clients simply did not need to take out major loans, and even if they wanted to, might not qualify for them.
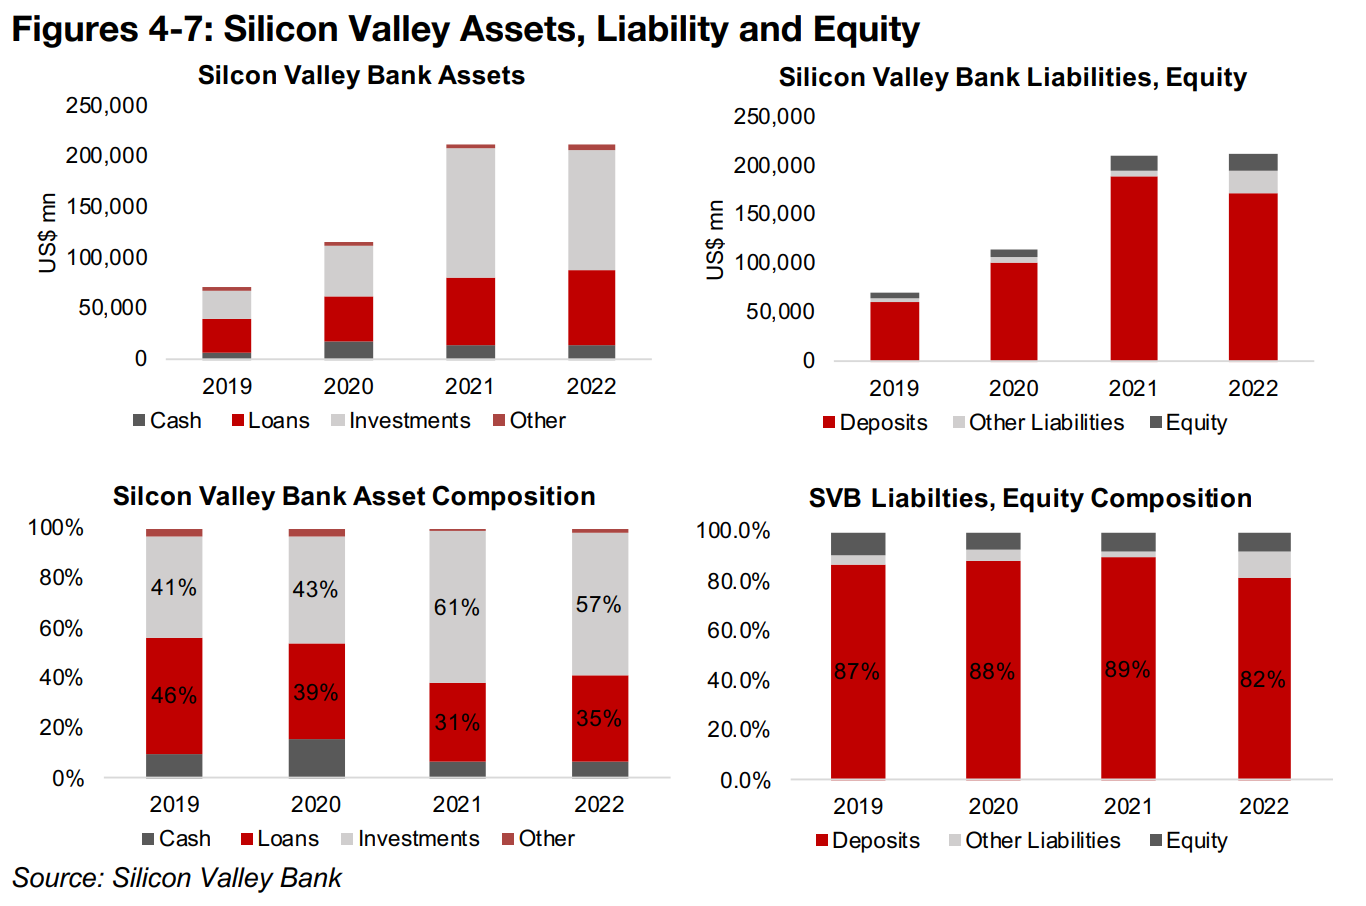
So suddenly SVB had an issue where it was paying out much more on deposits, but not as easily able to offset this by making higher interest rate-earning loans. Much of the new cash inflow was going into lower yield investments, especially bonds. These bonds were also purchased in 2021, when interest rates were very low, and with rates and bond prices moving in opposite directions, this meant the bonds were expensive. Still, while not great for the bank's profitability, it was not a major crisis (yet).
Investments become outsized proportion of SVB assets
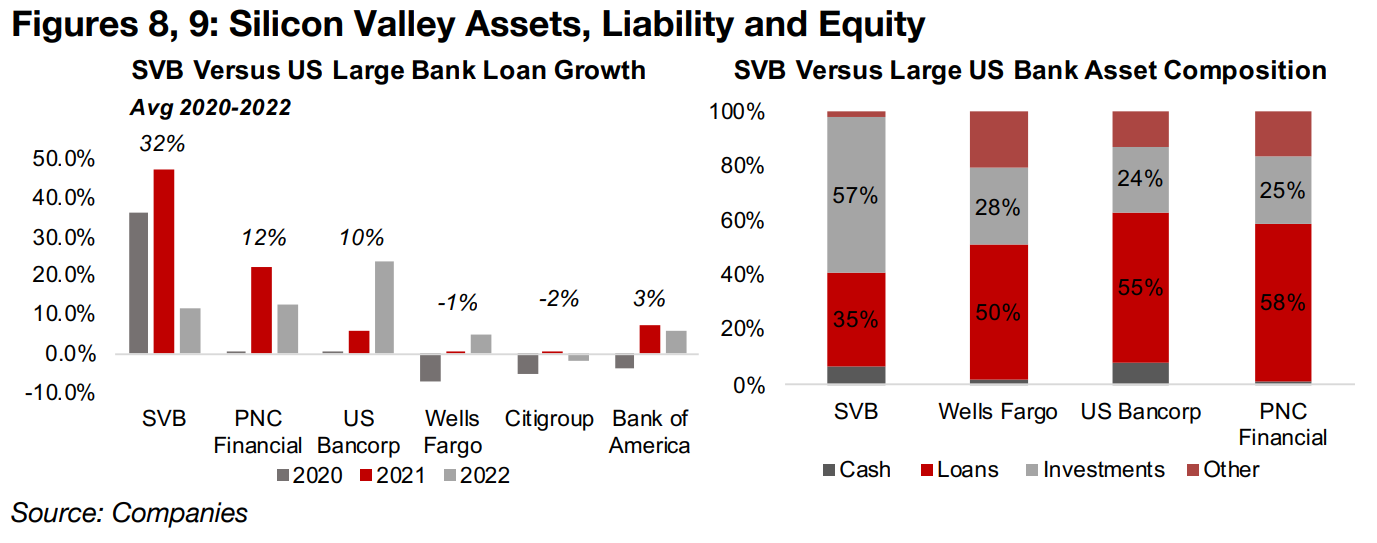
While SVB's lending was unable to keep up with the growth in its deposits, its loan
growth was still extremely strong in the context of other banks, rising 32% on average
from 2020-2021, compared to loan growth ranging from -2% to 12% for a set of the
largest US banks (Figure 8). So SVB management seems to have been lending out
that capital as quickly as it could, but still came up against the structural limitations
of its targeted customer segment.
Comparing SVB to other banks shows just how large its investment portfolio had
become relative to some of its peers. In Figure 9 we include the major 'pure'
commercial banks Wells Fargo, US Bancorp and PNC Financial, for which
investments were just 26% on average in 2022, compared to 57% for SVB. We
exclude Citigroup and Bank of America from this chart, which have other large
divisions like asset management and others which distort the ratios.
Fed's aggressive rate hikes seal SVB's fate
With SVB's balance sheet distortions outlined, we now move on to 2022, when
interest rates started to rise extremely quickly, from effectively zero at the start of the
year to well over 4.0% by the end of the year. With interest rates and bond prices
moving inversely, this meant that the value of the bank's bonds, which were a much
higher proportion of their portfolio in 2022 than in 2020, was abruptly collapsing over
the second half of 2022. Considering that a company goes bankrupt if its assets
decline below the value of its liabilities, SVB suddenly had a major problem.
The value of SVB's loans at the end of 2022 was US$73.6trn, the value of its
investments, mostly bonds, was US$120.0trn, and the value of its total assets,
US$211.8trn. Subtracting its liabilities, which were mostly deposits, of US$195.5trn,
the bank has US$16.6trn in equity. The value of the bond investments as of end-2022
assumed that the bank could continue operating and hold them to maturity over many
years. However, the market in recent weeks had become concerned as the bank was
forced to sell off these investments at a loss and could not hold them to maturity.
This occurred because deposits started to flow out of the bank, and SVB needed to
offset these cash outflows. If we assume that the market value of the bank's
investments had declined just 30%, that would imply assets of US$181.3trn, and on
liabilities still at US$195.5trn, before accounting for the run on deposits, the bank
would have negative equity of US$-14.2trn, which would mean it was bankrupt.
This situation led the bank to attempt to shore up its finances by attempting to raise
capital over the past week, which created even more concern for clients and investors.
This drove many of the venture capital funds backing the companies which had their
deposits with SVB to encourage them to withdraw them. This was because many of
these startups were not generating any cash flow and maintaining their cash balance
at the bank was much more critical than for the typical company that could fund itself
through internal cash. This then turned into a run on the bank, as all depositors
clamoured to withdraw their funds, and the bank was forced closed by regulators.
Severe interest rates hikes were bound to cause major disruption eventually
One of the most important takeaways from the SVB debacle, is that a massive surge
in interest rates like that of the past year cannot happen without substantial economic
disruption. However, there can be an extended 'grace' period where the problems
are percolating but have not reached the surface, as seen over the past six months.
We expect that this will just be the beginning of some big economic issues, and while
we don't necessarily expect a string of bank runs, we do expect that many companies,
and the global economy overall, may start to show more signs of distress.
One more far-reaching effect may be to dampen the tech and crypto sectors. While
both of these sectors were already under pressure since mid-2022, this week's
events will likely see investors heavily reevaluate how much capital they will allocate
to them in the short to medium term. Both tech and crypto were crucial in the 2013-
2019 boom and in the H2/20-2021 rebound from the global health crisis. An absence
of strong growth from these two sectors, so key in propelling the growth of at least
the past decade, could have a negative multiplier effect across other sectors.
Gold and gold stocks seeing rising interest on flight to safety
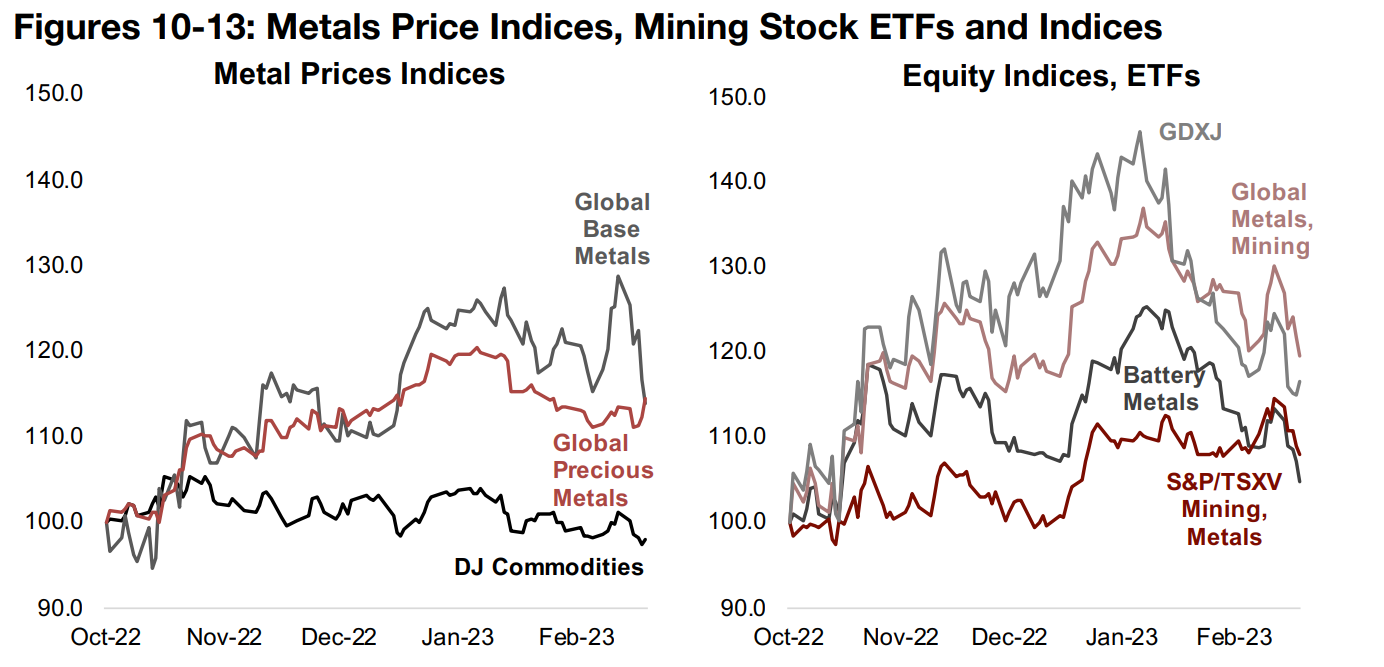
All of this disruption has been good for gold, which has been in a reasonably strong
uptrend, along with gold stocks, since October 2022, apart from a pullback in
February 2023. In the disruption this week we have seen gold outperform other metals
on a flight to safety, with investors likely concerned about other metals' heavy
exposure to the industrial cycle. There has been an abrupt reversal especially for base
metals, which collapsed from a 29% gain versus October 2022 to just 13.8%
currently (Figures 10, 12). This has brought the base metals performance down below
precious metals, which are up 14.5% October 2022, and overall holding up
reasonably since mid-February.
The iShares MSCI Global Metals and Mining Stock ETF has trended down since late
January 2023, and especially tumbled over the past two weeks, although it is still up
19.5% since October 2022 (Figures 11, 13). This puts it ahead of the GDXJ ETF of
junior gold miners, up 16.6%, which has lost its lead over the Global Metals and
Mining ETF it had through December 2022 to January 2023.
However, it is interesting that the GDXJ had commanded that lead at all, and how the
gap between the performance of the two is still quite tight at 2.9%, given that many
companies in this ETF are pre-production and therefore quite risky compared to the
producing giants that comprise the Global Metals and Mining ETF. We might have
expected more of a discount for the GDXJ, but it may be pointing to investors
increasingly wanting to shift to the safety of gold and gold stocks.
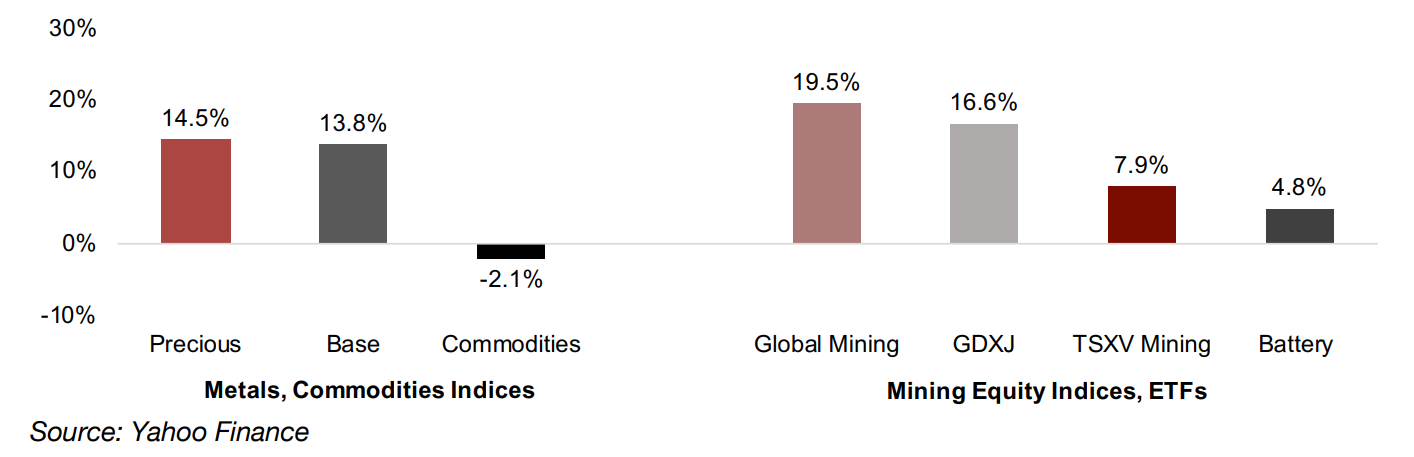
The S&P/TSXV Mining and Metals Index weakened considerably over the past week,
down -5.8%, as the relative resilience of gold stocks was offset by weakness in base
metals and lithium and battery metals stocks, which also comprise large chunks of
this index. This decline has not only affected the junior battery metals stocks, but also
the major producers in the sector, with S&P's Index of Core Battery Metals Stocks
up just 4.8% since October 2022, down from an 25.2% gain as of end-January 2023.
We see this split between the gold junior and base metals performance as a potential
critical turning point. The rally from October 2022 to January 2023 had really been
across all the metals. However, the market seems to be making a distinction between
the relative safety of gold, driven more by monetary and political and economic risk
factors and the base and battery metals, tied to shifts in the industrial cycle. This has
been a big test for whether gold stocks would hold up if the bear market that started
in late 2021 resumed, with the October 2022 to January 2023 gains in the broader
global equity markets now looking like a potential bear market rally.
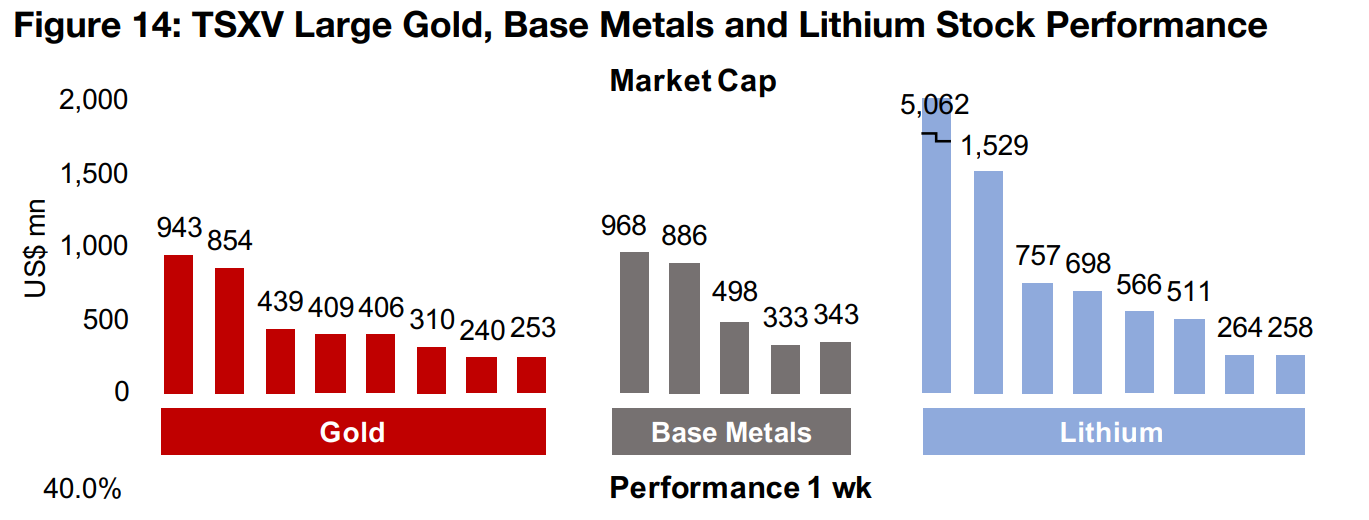
TSXV large gold stocks outperform base metals and lithium stocks
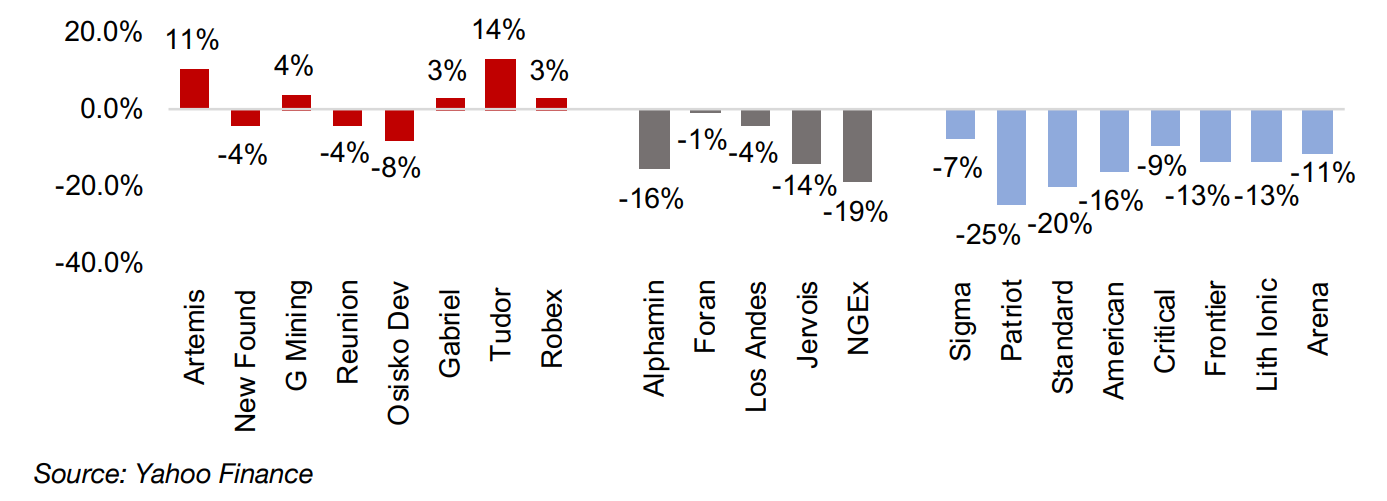
We can see further evidence of this developing divergence between the sectors by looking at the performance of the Top TSXV mining stocks (Figure 14). Only one of the top eight TSXV junior gold stocks dropped below -5% over the past week, and five out of eight stocks made gains. Compare this to the top five base metals stocks, which all declined, with three down by -14% or more, and the top eight lithium stocks, with six down well over -10% and two down over -20%. The market is clearly unloading the base metals and battery metals relative to gold stocks, and even buying into some gold stocks, as apparently the overall attractiveness of gold is offsetting the risk inherent in junior miners and the overall pressure on equity markets.
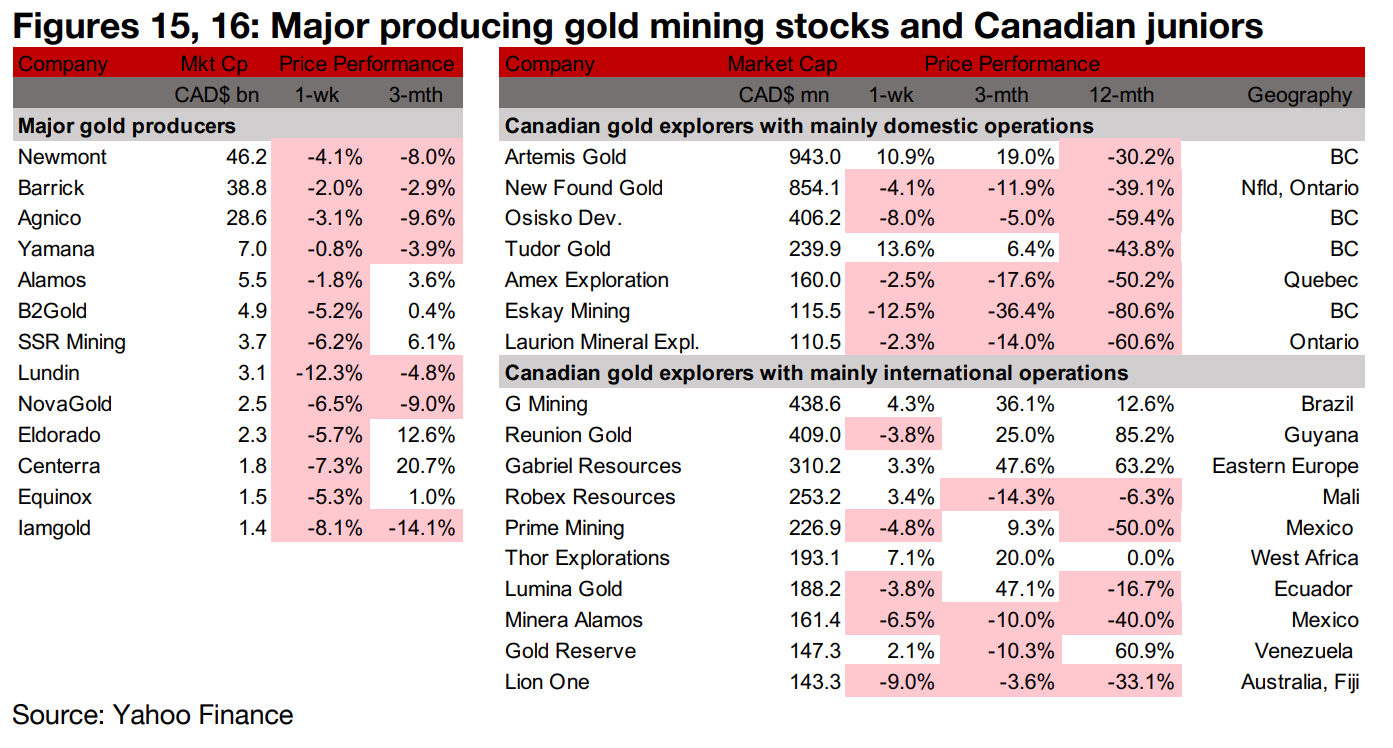
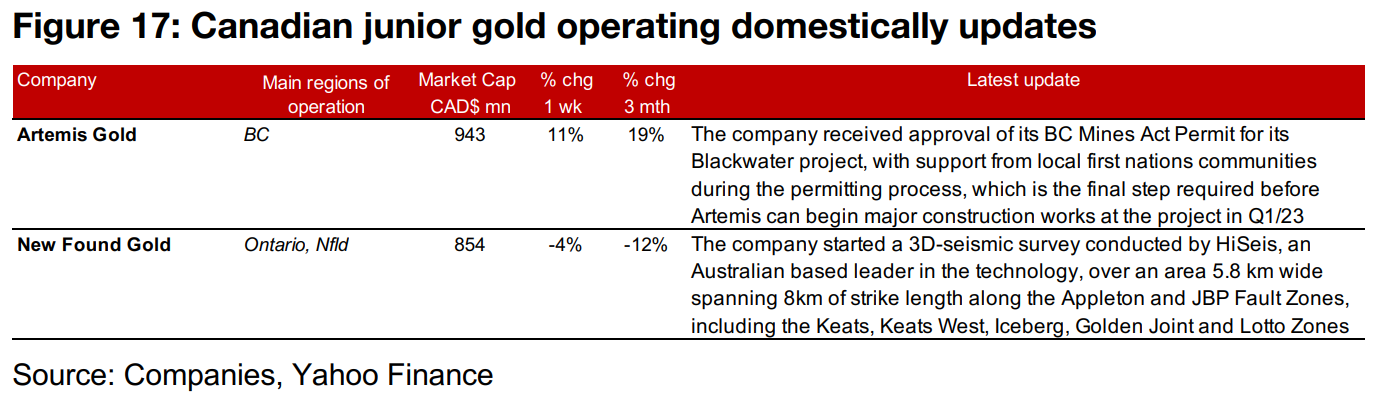
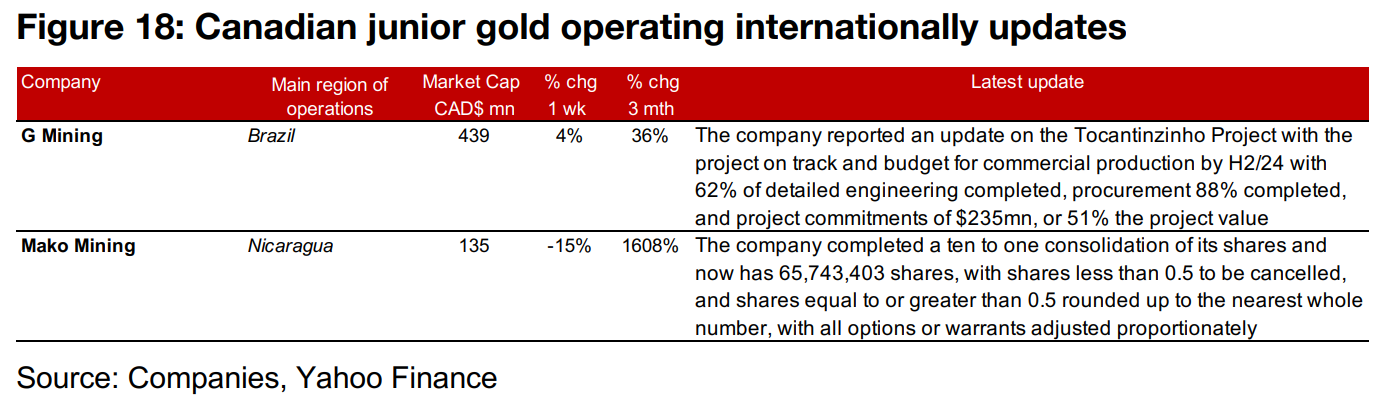
Gold producers down and TSXV gold mixed
The producing gold miners were all down and the TSXV junior gold miners were mixed as gold rose but equity markets declined (Figures 15, 16). For the Canadian juniors operating mainly domestically, Artemis received approval of its BC Mines Act Permit for Blackwater and New Found Gold began a 3D-Seismic survey with Australia's HiSeis for the Appleton and JBP Fault Zones (Figure 17). For the Canadian juniors operating mainly internationally, G Mining reported an update on the Tocantinzinho Project and Mako Mining completed a ten to one consolidation of its shares to 65.7 mn (Figure 18).
Disclaimer: This report is for informational use only and should not be used an alternative to the financial and legal advice of a qualified professional in business planning and investment. We do not represent that forecasts in this report will lead to a specific outcome or result, and are not liable in the event of any business action taken in whole or in part as a result of the contents of this report.