Key region for Canadian gold mining
Quebec is over 30% of Canada's gold production
Major opportunities for juniors
Quebec is second largest producer in Canada
In this report we outline the Quebec gold mining industry, including its major producers, and a survey of many of the junior miners focused on the province. Quebec accounts for 34% of Canadian gold production (second to Ontario, with 44%) and remains a major focus for both producers and junior miners.
Quebec is the 18th most attractive global mining district
Juniors likely to continue to target the region
District attractive in global context
While Quebec's attractiveness as district has declined from a peak number at number 4 (out of 83) in the Fraser Institute survey 2018, it is still high in a global context at 18 (out of 76) in 2019, and we do not expect this to dissuade juniors focused on the region from continuing exploration.
Abitibi and James Bay the major gold mining regions
Quebec home to four of Canada's largest mines
Abitibi and James Bay the focus
The historically strong Abitibi region is the main focus of Quebec gold mining currently, but the relatively underexplored James Bay region is seeing rising interest. Given that the province is home to four of Canada's largest producing mines, has high exploration potential, and given the rising gold price, we expect that activity from juniors in Quebec will continue to be high.


Looking at four groups of miners in Quebec
A survey of notable Quebec junior miners
In this report we look at notable Quebec gold miners in four groups; 1) producing mines, 2) junior miners with resources above 2 mn ounces, 3) juniors miners with resources with resources below 1 mn ounces, and 4) very early stage explorers, with no material resource estimates.
Gold price has averaged above US1,600/ounce over the crash
Juniors' share prices down on concerns capital raising may be more difficult
Gold price strong, but capital access an issue
While the gold price has been volatile since the crash, on average it has held up well, averaging above US$1,600 and even rising slightly since late February, compared to over a 20% decline for the S&P 500. While this should be supportive of junior gold miners, this has been somewhat offset by concerns of ability to raise capital in this more difficult environment. Overall, most Quebec junior miners have seen their prices decline since the crash, as capital raising and operational shutdowns offset strong gold.
Highlighting 8 out of 29 companies in the survey
Focusing on the pre-crash differentiating stories
Highlighting group of eight Quebec explorers
At the end of this report, we highlight a group of 8 Quebec focused gold companies, out of the 29 in our broader survey, that we believe have interesting stories. Given that the most obvious recent driver of all of these names has been the market crash, we take that as rote and in our summaries and focus more on the pre-crash developments of the companies to differentiate between them.
Short-term issues will weigh on the sector
Long-term outlook for juniors in Quebec remains strong
Quebec remains strong opportunity for juniors
The current crisis will clearly put some short-term pressure on the sector, with production shutdowns for many mines announced, juniors halting exploration activities, and capital suddenly more difficult to access. While admittedly this may shake out some small juniors, in the long-term, especially with the renewed strength of the gold price, we believe that opportunities for the stronger junior gold miners in Quebec that we cover in this report will remain strong.
1) Quebec gold mining overview
Quebec is second largest contributor to Canadian gold
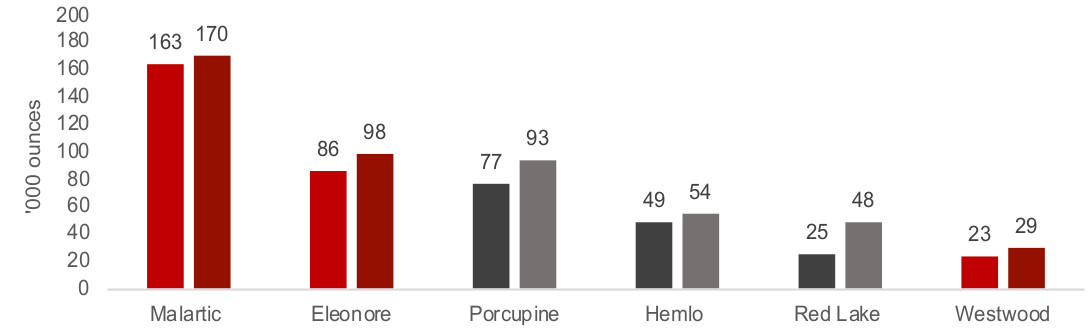
Quebec is the second largest contributor to Canadian gold output, with 56,073 kg produced in 2017, or a total 34.1%, after Ontario, at 44.3%, with other provinces being relatively small contributors (Figure 1). While Ontario's gold output is larger than Quebec in aggregate, Quebec has the country's largest producing mine, Malartic, with 170,000 ounces of output in Q4/19 and Eleonore with 98,000 ounces ( (Figure 2). The other largest producing mines in Canada are in Ontario; Porcupine (93,000 ounces in Q4/19), Hemlo (54,000 ounces) and Red Lake (48,000).
Figure 1: Canadian gold production by province (kg, 2017)
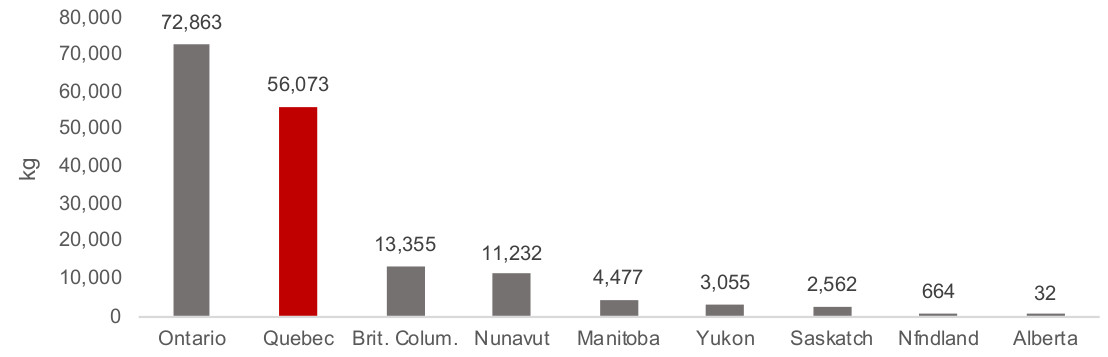
Figure 2: Output of major Canadian mines ('000 ounces)
Gold activity concentrated in Abitibi and James Bay
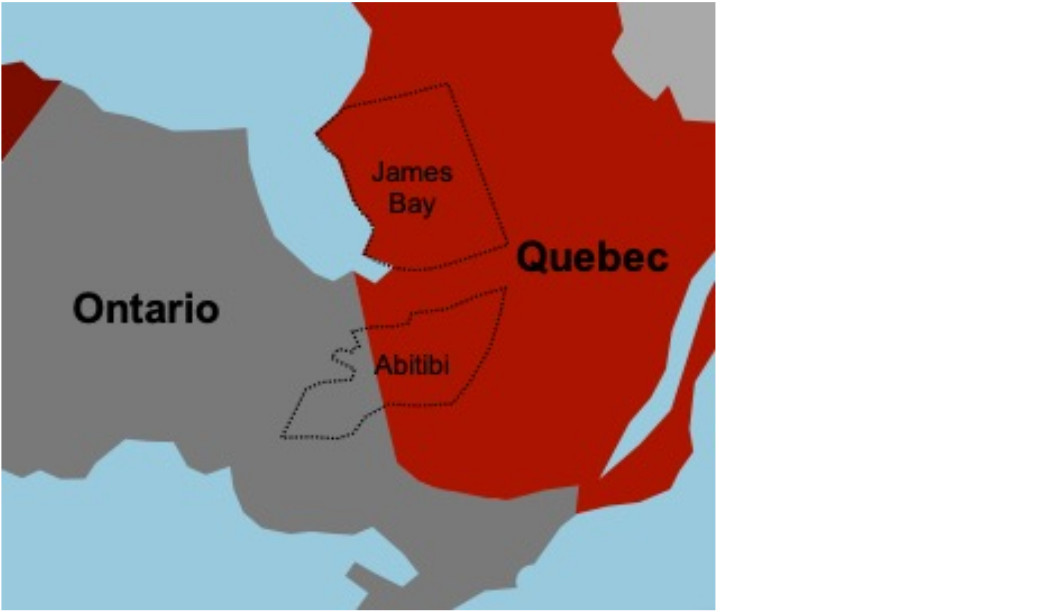
Figure 3 shows the two major centers for Quebec Mining, Abitibi and James Bay, although there are several other areas in the province also with gold exploration ongoing. Abitibi is the site of the largest single producing gold mine in Canada, Malartic, and has a long history of extensive exploration and production. The second area of concentration, James Bay, is relatively underexplored and has historically had far less output than Abitibi, and therefore is an area for potential exploration long-term. The largest producing gold mine in James Bay is the Eleonore mine.
Figure 3: Major Quebec major gold mining regions
Quebec still an attractive district even after ranking decline
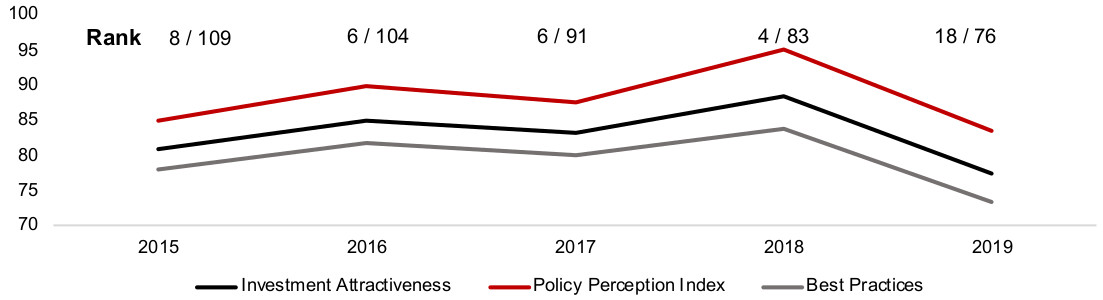
Quebec has seen a considerable decline in its investment attractiveness ranking in the 2019 Fraser Institute annual global mining survey to 18 (out of 76) from 4 (out of 83) in 2018. This puts the district third in Canada after Saskatchewan and Ontario, and just ahead of British Columbia (Figure 4). The decline was driven mainly by rising concerns over a potentially tightening regulatory environment, with Quebec's policy perception index and the best policies index declining (Figure 5). However, the juniors we survey in this report are Quebec based and focused, and we do not expect that a drop in this survey dissuade them from operating in the province. Also, in a global context, Quebec still remains in the top third of global mining districts, even at 18.
Figure 4: Fraser Institute mining district investment attractiveness ranking
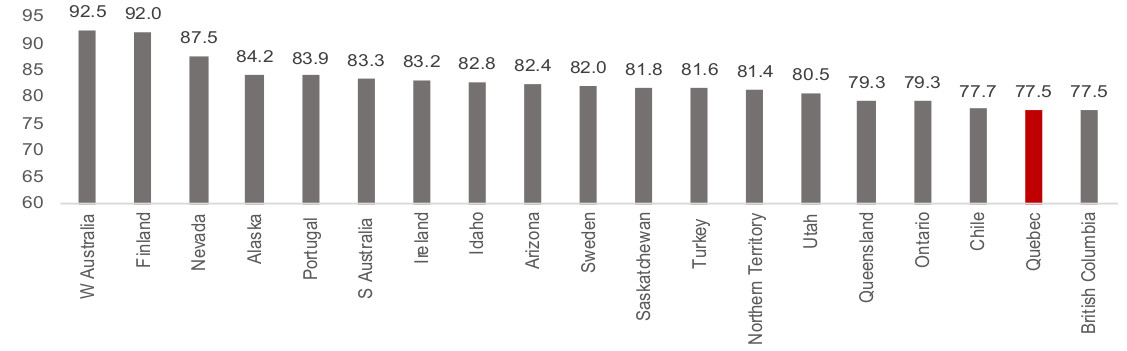
Figure 5: Quebec mining Fraser Institute survey scores, ranking changes
2) Quebec gold production and exploration
Six large listed companies with Quebec revenue
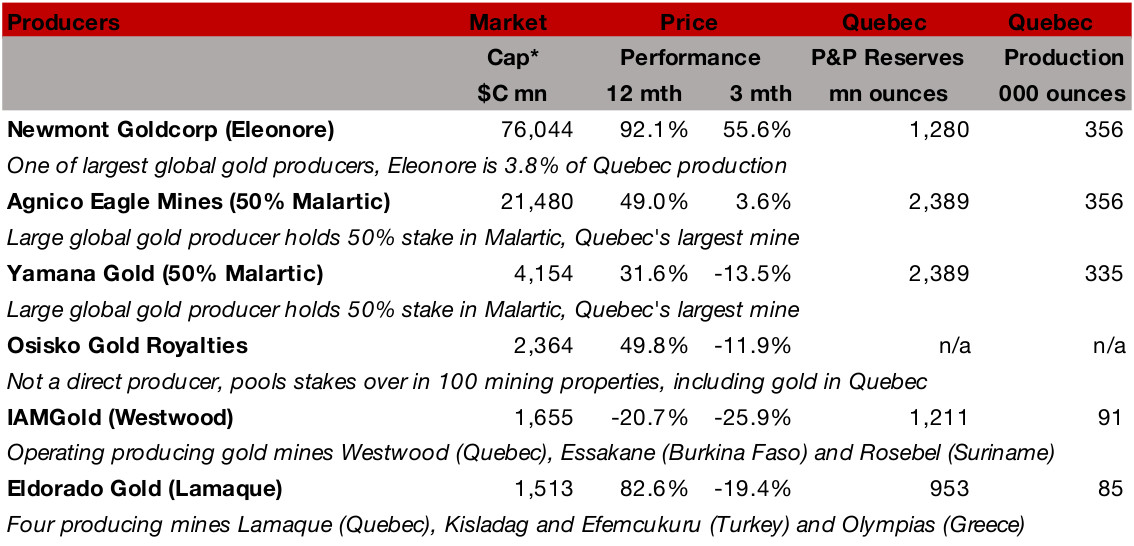
Quebec's largest cap gold stocks include five major producers, and a sixth gold mining cash flow stream aggregator (listed in Figure 6 by market cap). The largest stock in the group is Newmont Goldcorp, although Quebec is only a modest 3.8% of its gold reserves, through its holding of the Eleonore mine. The next two largest are Agnico Eagle and Yamana, which each hold 50% of Malartic, Quebec's largest gold mine. Osisko Royalties is the fourth largest of the group, which is not a producing miner, but instead pools royalty streams from many different mines, including mines in Quebec. IAMGold is the fifth largest stock, operating Westwood, Quebec's third largest mine with 1,211k ounces in reserves. The sixth, El Dorado, operates the fourth largest mine in Quebec, Lamaque, with 953k ounces in reserves.
Figure 6: Quebec producing mines
The current and long-term outlook for the major mines
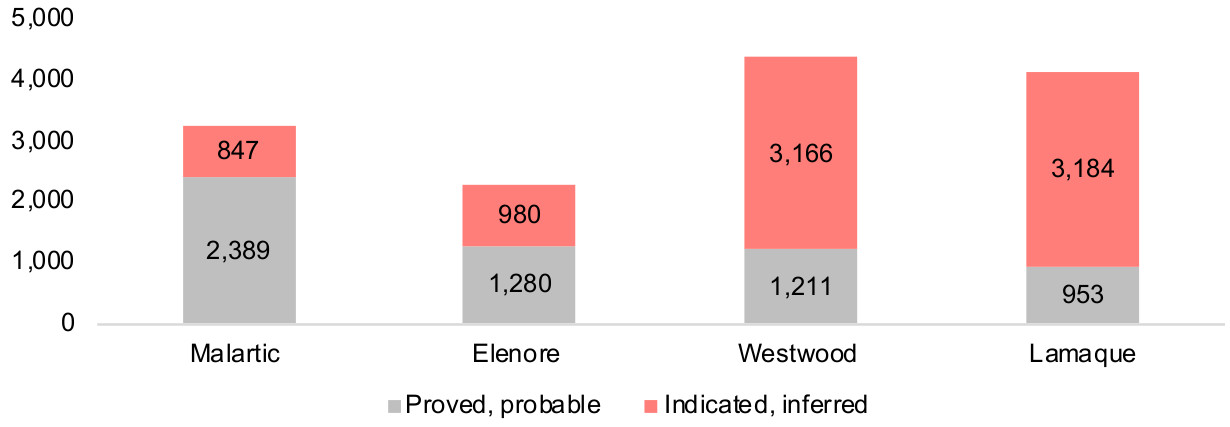
Figure 7 shows the current production, probable reserves, and mine life of the major Quebec mines. While Malartic and Eleonore are the largest Quebec mines by reserves, given their high current production, they have relatively short lives of 7 and 5 years respectively, based on proved and probable reserves (P&P) (Figure 7). They also have limited upside potential given their relatively lower indicated and inferred resources (I&I) (Figure 8). The future of Quebec production looks instead to be Westwood and Lamaque, with mine lives of 20 and 10 years, respectively, given their relatively low levels of current production. These mines also have substantial indicated and inferred reserves, which could extend their mines lives considerably from the P&P estimate.
Figure 7: Major Quebec gold mines production, life, reserves
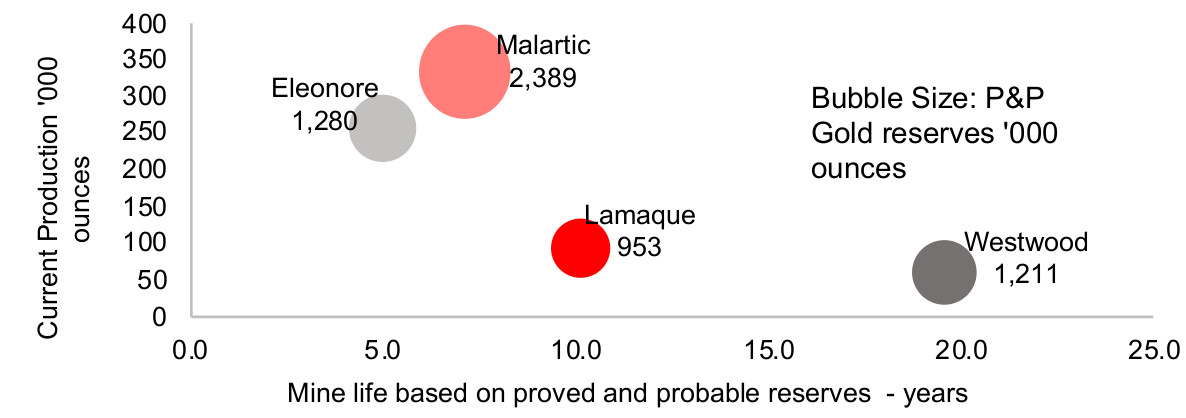
Figure 8: Major Quebec gold mines reserves
Later stage explorers with larger estimated resource bases
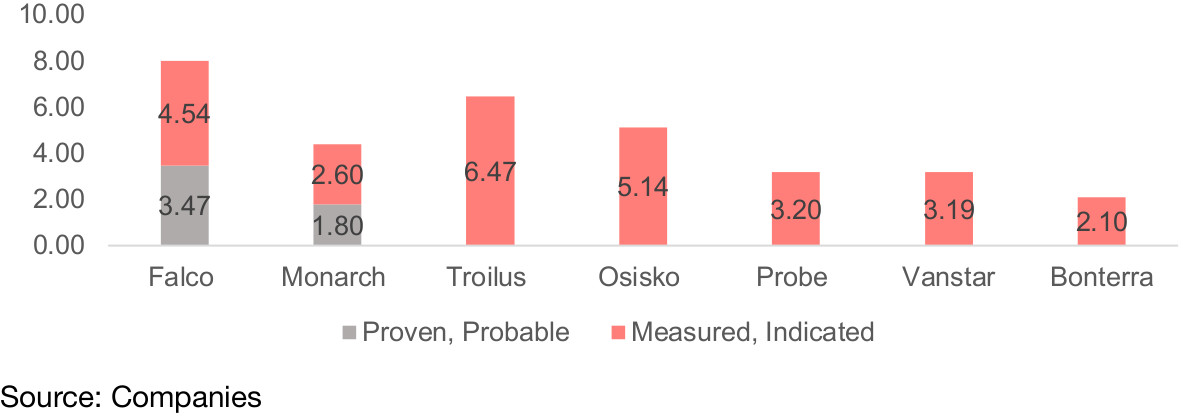
Figure 9 shows Quebec larger cap gold exploration firms with P&P probable or measured and indicated (M&I) reserves above 2mn ounces. Figure 10 shows what the market is paying per ounce of estimated mineral resources, and Figure 11 shows the breakdown in resource estimate between P&P and M&I. Osisko has by far the largest market cap of the group, with the highest M&I reserves, at 5.14mn ounces, and is the most advanced in the exploration process, with a preliminary economic assessment of its Windfall project at CAD$412mn. We do not show Osisko in Figure 9, as its high market cap/ounce of US$114 puts it well outside of the rest of the group.
Figure 9: Quebec junior gold miners with resource estimates >2mn oz
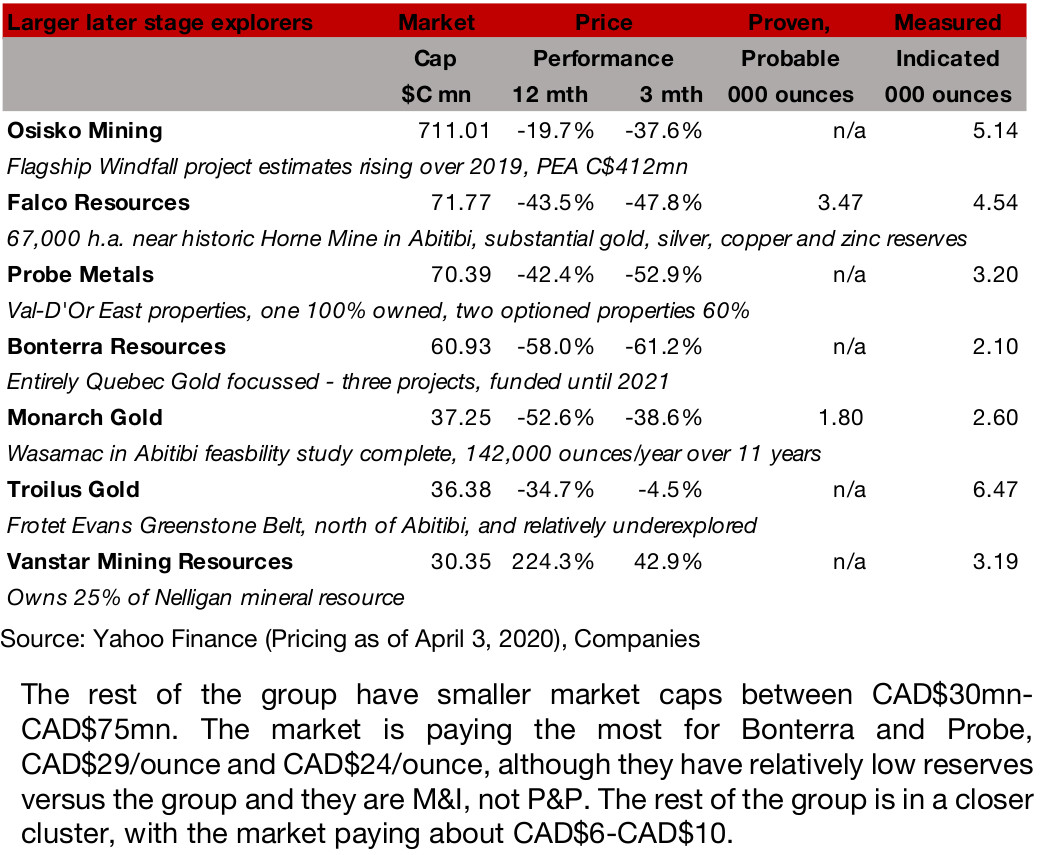
Figure 10: Larger gold junior miners (> 2mn oz) mkt cap/resource
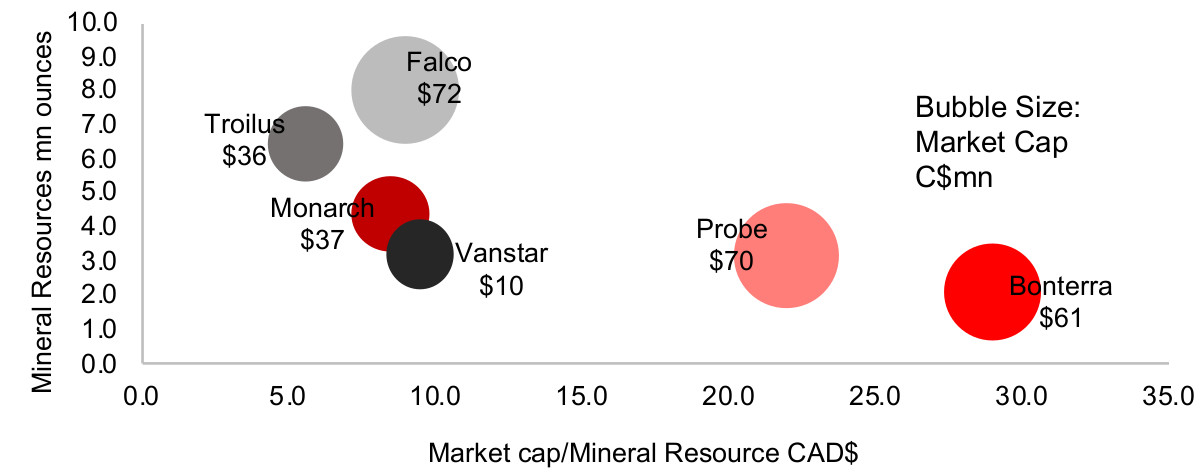
Figure 11: Larger junior miners resource breakdown P&P and M&I
Early stage producers with smaller estimated reserve levels
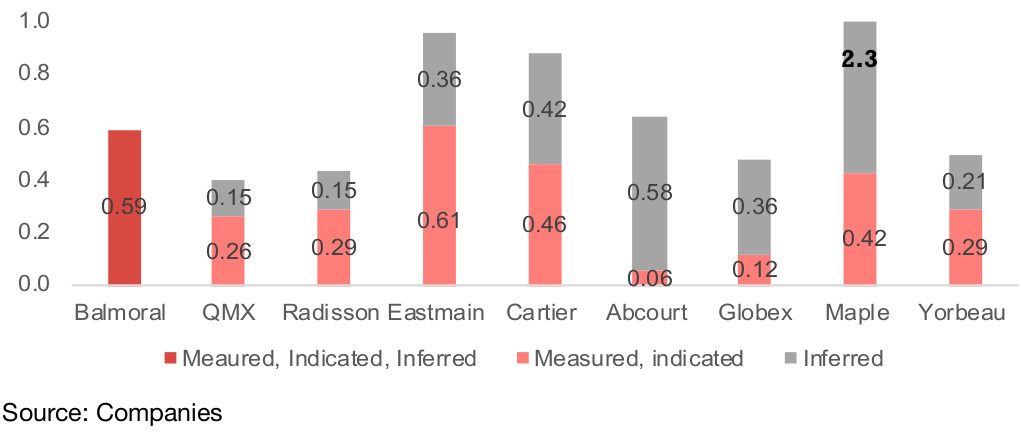
Figure 12 outlines the smaller earlier stage explorers, which have measured and indicated reserves below 1 mn ounces, and none of which have moved to the P&P stage. Figure 13 shows what the market is paying per ounce of reserves, and similar to the larger cap exploration firms, the market is paying a premium for three firms, Balmoral, Radisson and QMX at CAD$100, CAD$92 and CAD$90/ounce, respectively, while the rest of the group is in a cluster ranging from CAD$17-CAD$32/ounce. QMX and Radisson have the lowest reserves of the group, but the market seems to have more confidence in their ability to move these to eventual production than the other firms (Figure 14).
Figure 12: Quebec smaller earlier stage explorers < 1mn oz
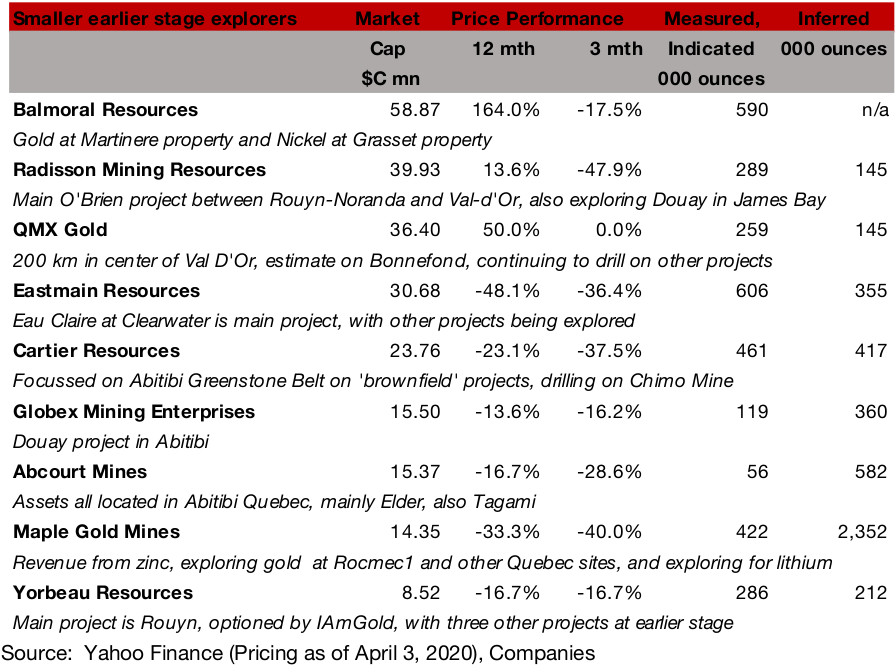
We have not included Maple Gold Mines in Figure 13, as its very high level of inferred resources put it literally off the chart, and the market does not appear to be attributing much value to these very high level of reserves, given Maple's relatively low market cap, even with this large resource estimate. Also of note is Balmoral, which is merging with Wallbridge (which is in the group below of very early stage explorers). Both Balmoral and Wallbridge are seeing high levels of value from the market on our chosen metrics, and this is likely because the firms are afforded a premium due to these merger plans. In the current environment size will likely prove to be an advantage as combining the two firms resources should make them more interesting to potential providers of capital. (For Balmoral there is also not a split available between M&I and inferred resources, so only a combined figure is included in Figure 14).
Figure 13: Smaller gold junior miners (< 1mn oz) mkt cap/resource
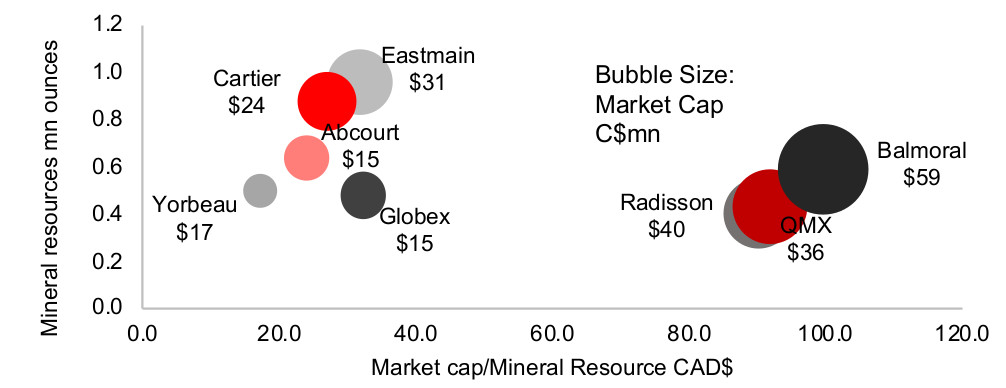
Figure 14: Smaller junior miners resource breakdown M&I, Inferred
Very early stage explorers
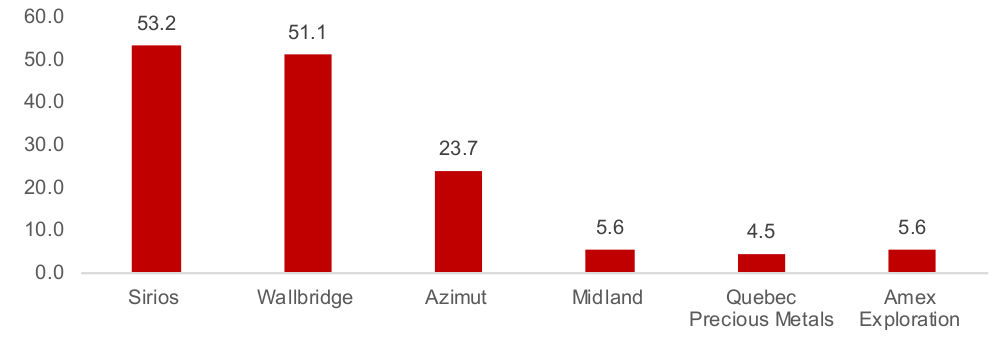
Figure 15 shows Quebec's very early stage gold miners, which have yet to report reserves even to the indicated and inferred (I&I) level. We could compare these based on market cap/planned drilling programs, but we don't have information for the entire group. Therefore we use the only metric we have across all six companies, market cap to average operating costs over the past year, or what the market is paying for these companies to keep operating. Sirios, Wallbridge and Azimut are being afforded a significant premium to Midland, Quebec Precious Metals and Amex Exploration (Figure 16).
Figure 15: Quebec very early stage miners
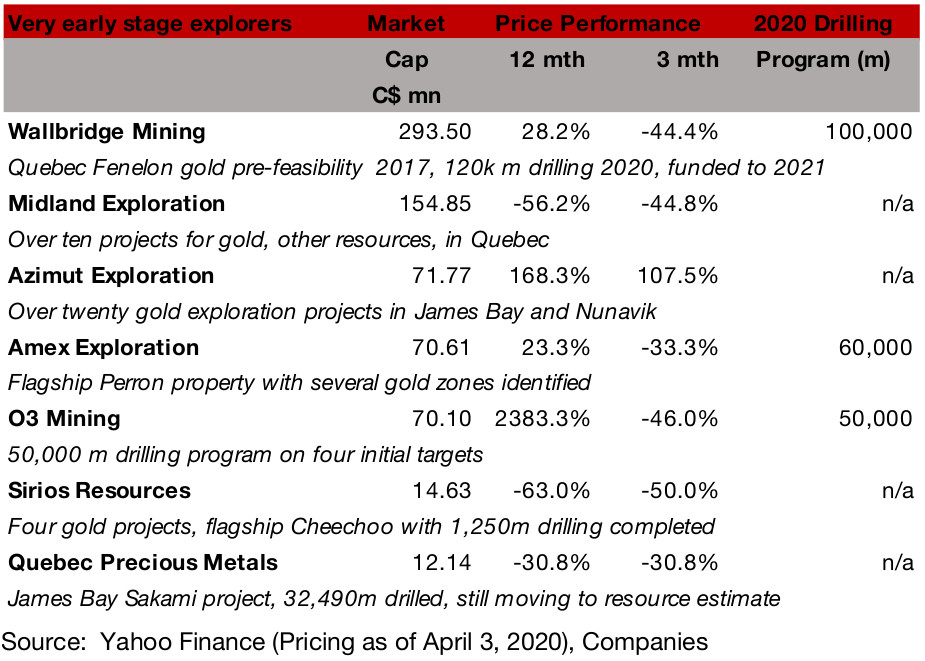
Figure 16: Very early stage miners market cap to cash
4) Revenue side: Gold price remains resilient
Gold price holding up under market crash pressure
The gold price has held up well under the pressure of the market crash of the past month, and from prior to its onset on February 18, 2018 to April 3, 2019, the price is actually up 3.1%, compared to a 26.5% decline in the S&P 500 index (Figure 17). However, the journey there has not been a smooth one, as gold faces three main forces in a broader equity market crash. Two are bullish; 1) one being a move to safer assets, and 2) the second as a specific protection against money printing, given the track record of central banks over the past decade. One is bearish, that being margin calls from other assets forcing liquidation of even safer assets investors would rather not sell.
Figure 17: Gold vs S&P 500 since the market decline
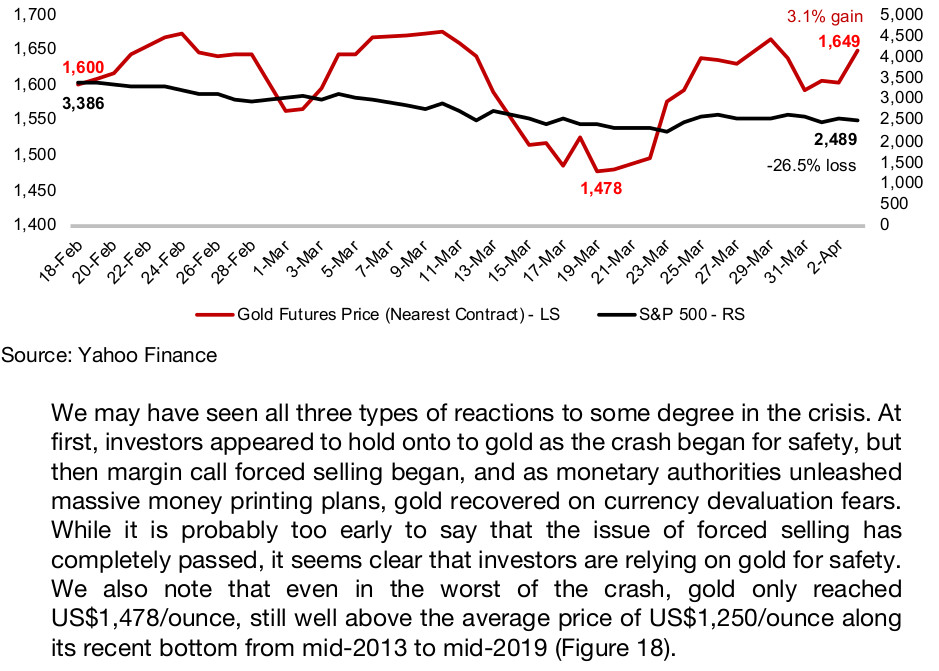
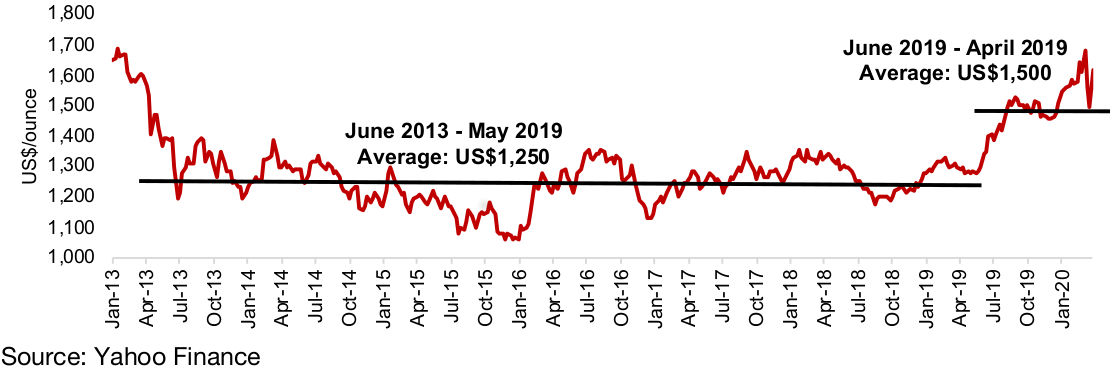
Figure 18: Long-term gold price
The crisis could actually drive up gold jewellery purchases
While the more short-term crisis-driven movements, and the safety motive, will likely dominate for the gold price this year, the current disruption will also have effects on the underlying core drivers of gold demand. The single largest core long-term demand driver is gold jewellery, which was weak in 2019, with China and India both seeing over 8% declines (Figures 19, 20).
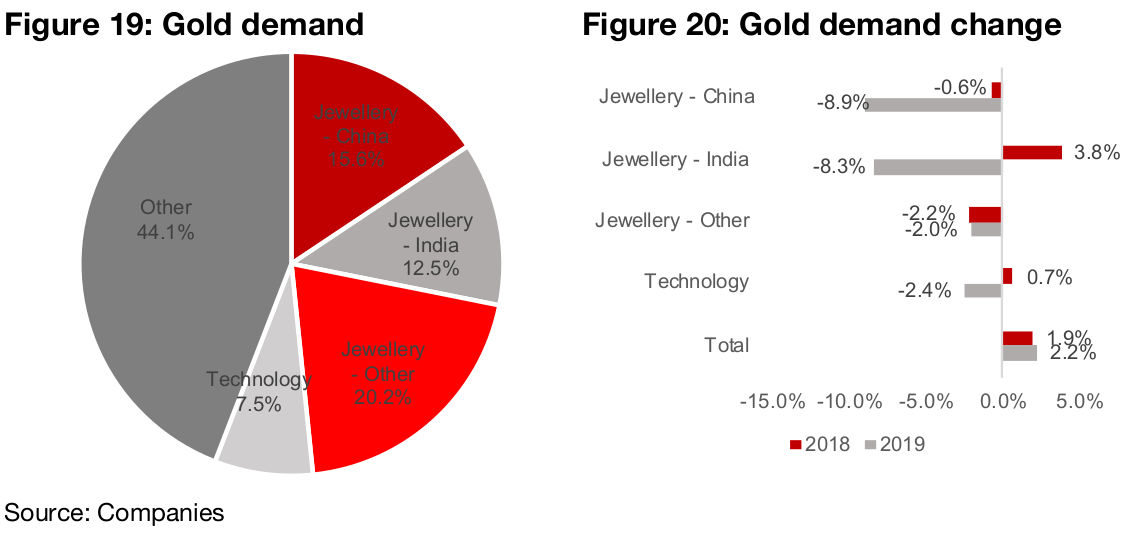
While with other luxury goods, we might expect demand to decline in a recessionary period, gold jewellery may prove to be an exception. Many reports from the physical gold market are pointing to low supply and extremely high demand, and this could help support the gold jewellery market, especially in China and India where gold jewellery is often considered a safe store of value.
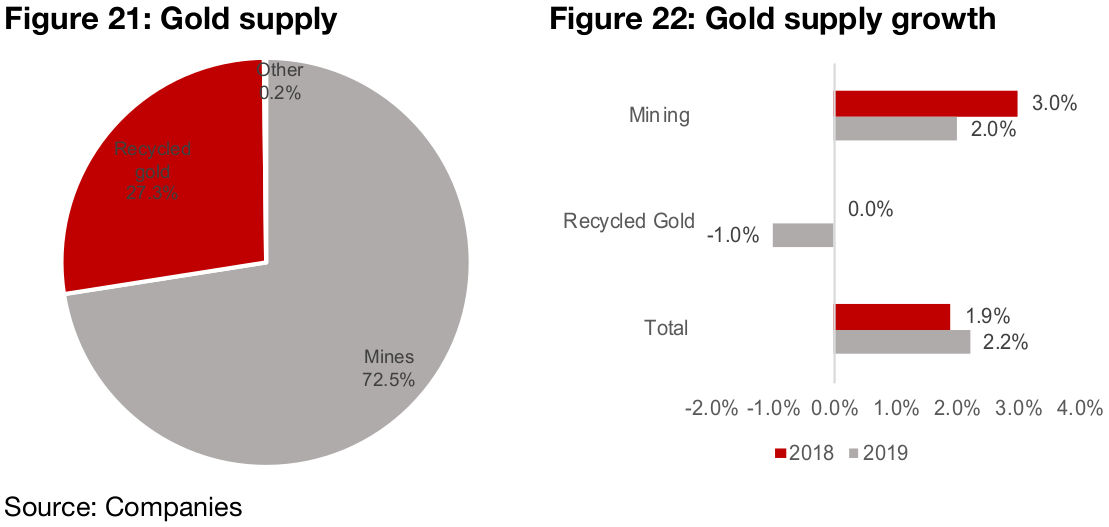
Gold supply growth from mines may decline this year
On the supply side, mining is the main driver, at 72.5% of total supply in 2019 (Figure 21), and this has risen 3% in 2018 and 2% in 2019, putting pressure on the gold price (Figure 22). However, growth in the gold supply, which was already expected to be lower y-o-y before the crisis, will be down in 2020, with a wave of temporary suspensions at many mines at least until mid-April.
Gold likely to hold up above US$1,500 in 2020
Taking all these factors together; 1) the bullish push for gold from rising risk and money printing, 2) the potential increase in demand in the physical market coming through as a rising demand for gold jewellery, especially in China and India, and 3) a likely contraction in mining output this year, we would expect that the gold price is quite easily going to average at least US$1,500. This year, the lowest gold reached even at the height of margin call based forced selling, was still only just below this level at US$1,478, and the average over Q1/20 has already been US$1,600.
5) Cost side: Gold price now well above costs
Exploration becoming more attractive with price jump
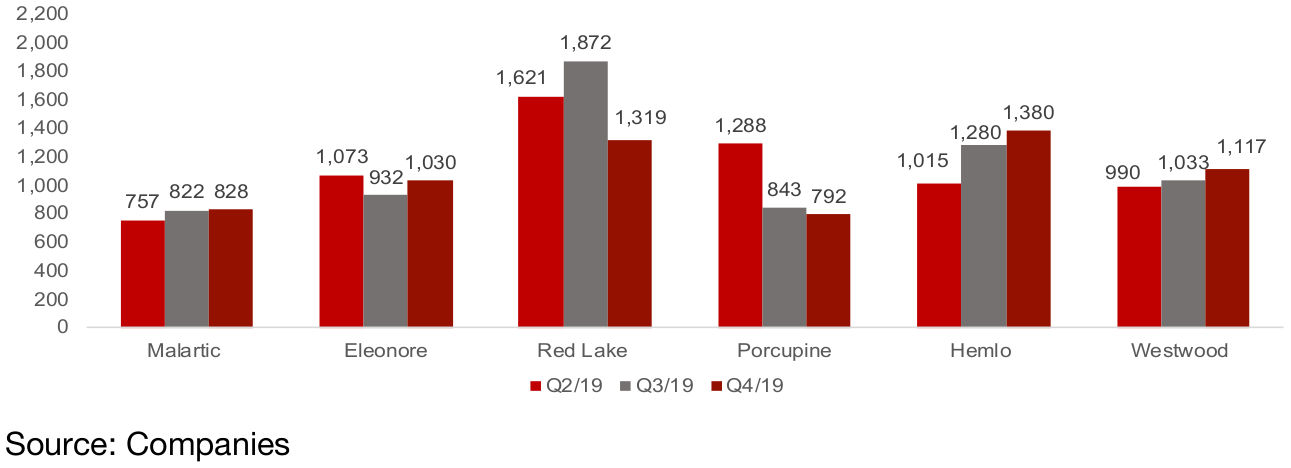
The higher gold price over Q1/20 is making the economics of gold mining more attractive. The all in sustaining cost per ounce of production of the major Canadian mines in recent quarters is shown in Figure 23, ranging from CAD$757 in Q2/19 at Malartic to CAD$1,380 at Hemlo in Q4/19 (the Red Lake Q1/19-Q2/19 figures are temporarily high on a maintenance shutdown). While with gold prices averaging US$1,250 from mid-2013 to mid-2019, only lower cost mines were profitable, with the gold price averaging above CAD$1,600 over Q1/20, most mines are profitable.
Figure 23: Cost per ounce (AISC) for major Canadian mines
Capital could be harder to raise for some juniors post-crash
For the producing mines, beyond the temporary shutdowns, with the gold price high, the outlook for profitability is rosy. However, for the juniors, the crash brings an additional problem, which is access to capital. In contrast to the producers, which have P&P reserves and established operations, the juniors have much more risk, less cash on their balance sheets, and less access to capital. The market crash has made investors much more wary, and could make it more difficult for juniors trying to raise capital to continue exploration activities. While this could result in a shake out of weaker and smaller juniors, most of the companies outlined in this report have the kind of size and management track record which should lead to eventual support from the market via capital, as the crisis passes and exploration resumes.
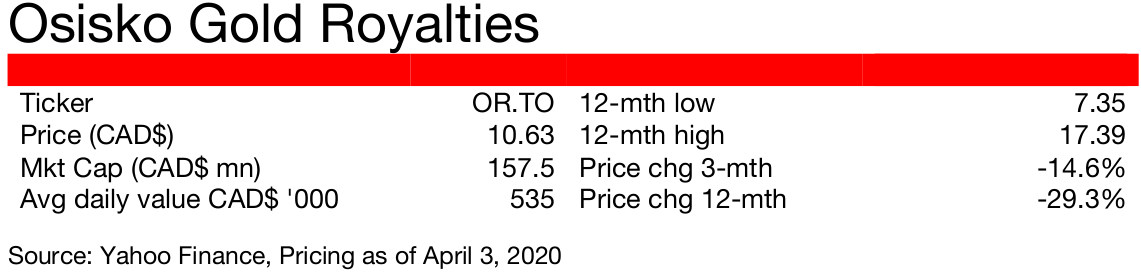
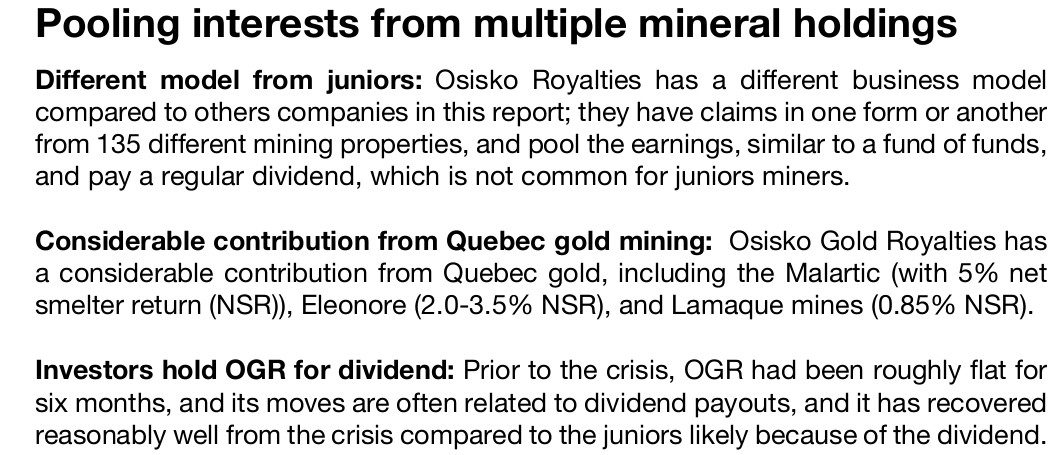
Figure 24: Osisko Gold Royalties share price and volume
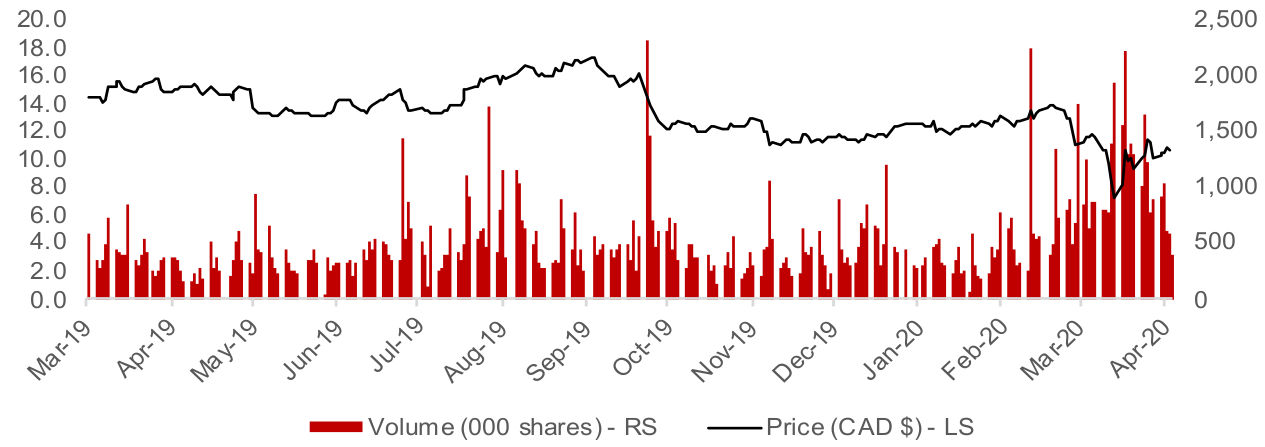
Source: Yahoo Finance
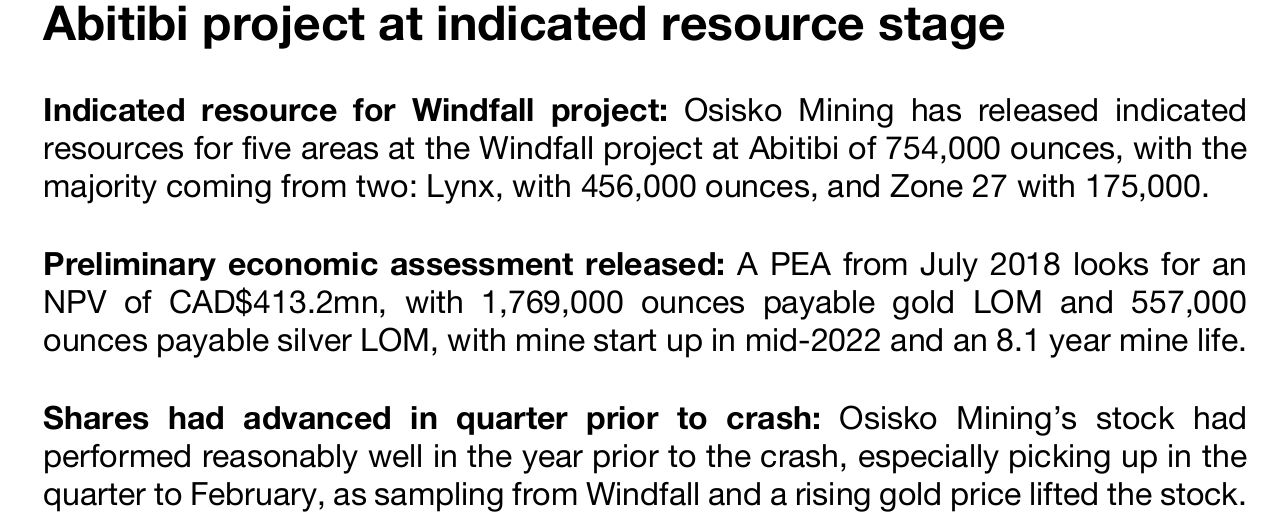
Figure 25: Osisko Mining share price and volume
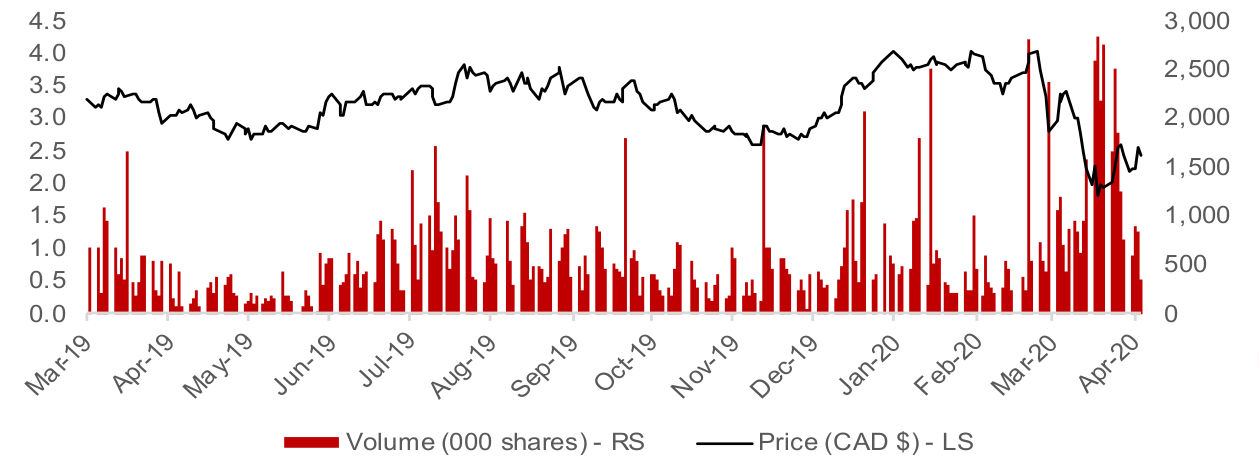
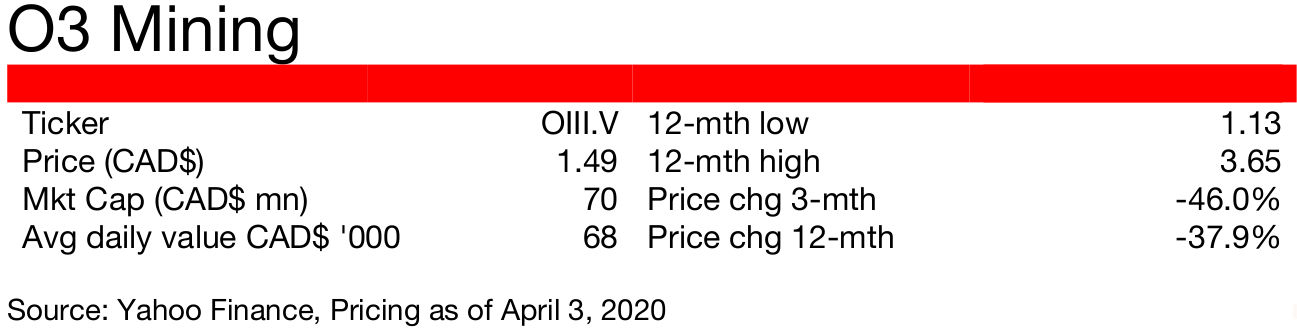
Figure 26: O3 Mining stock price, volume
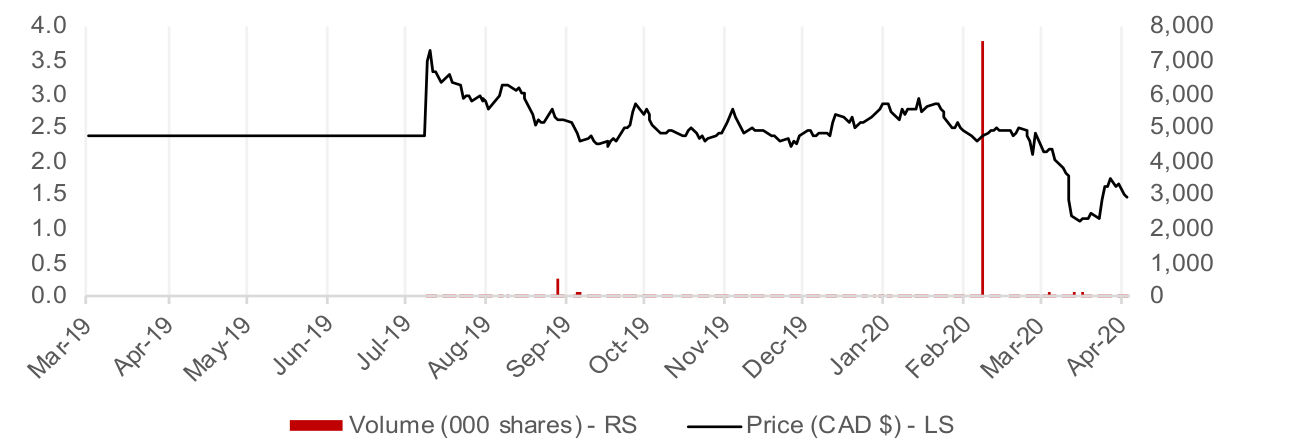
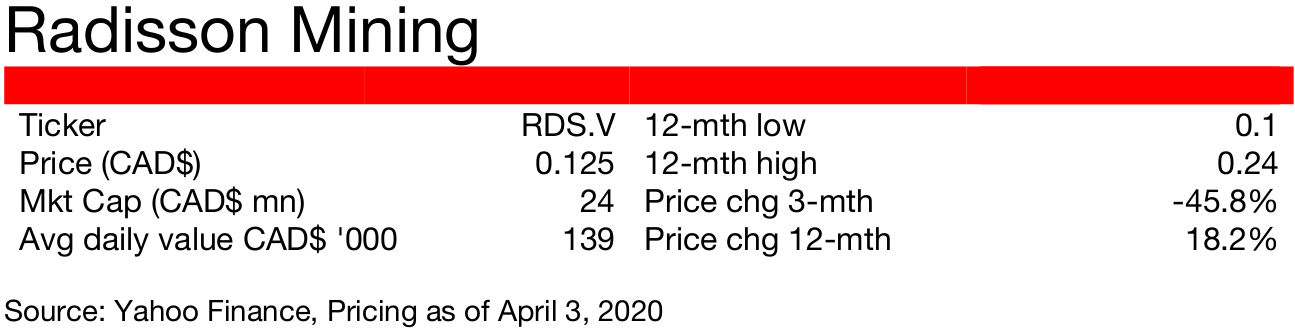
Figure 27: Radisson Mining share price and volume
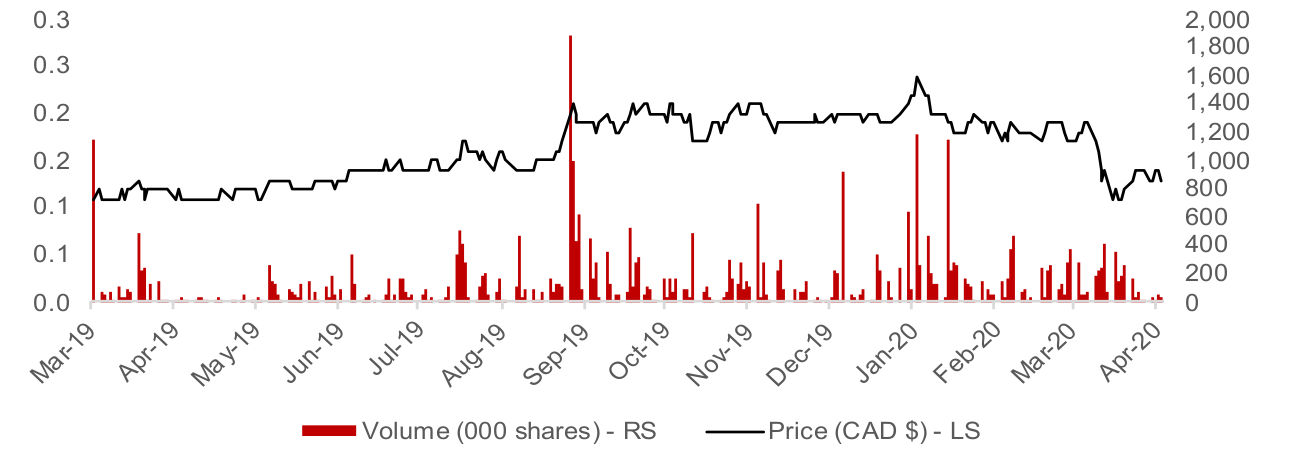
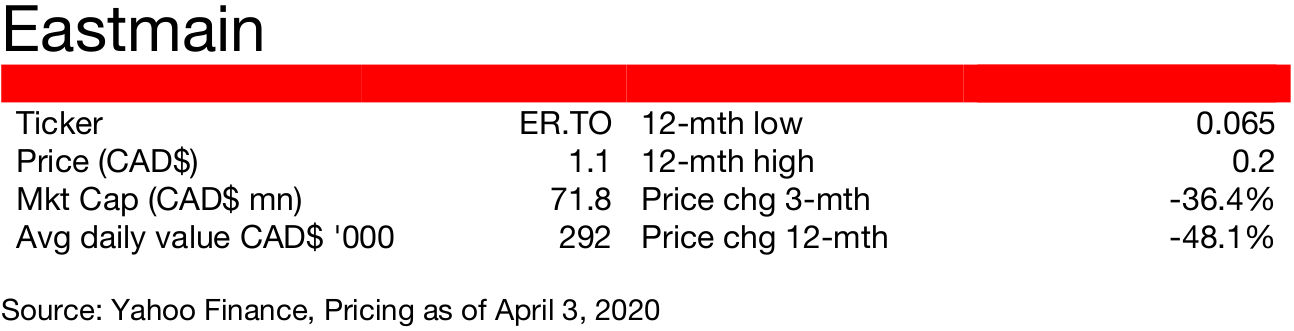
Figure 28: Eastmain Resources share price and volume
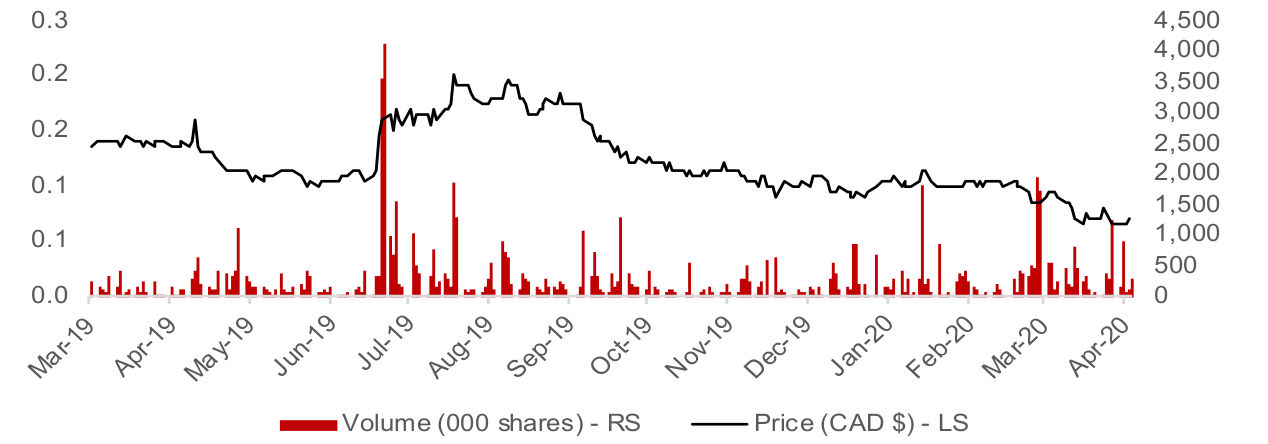
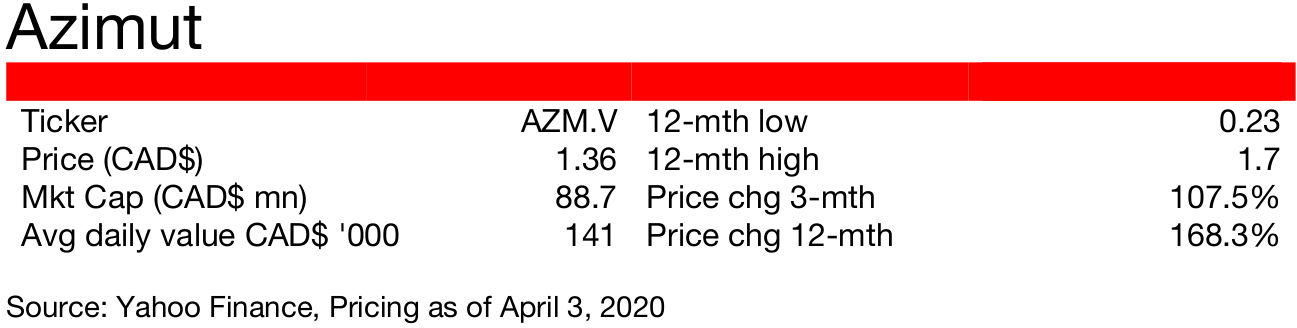
Figure 29: Azimut share price and volume
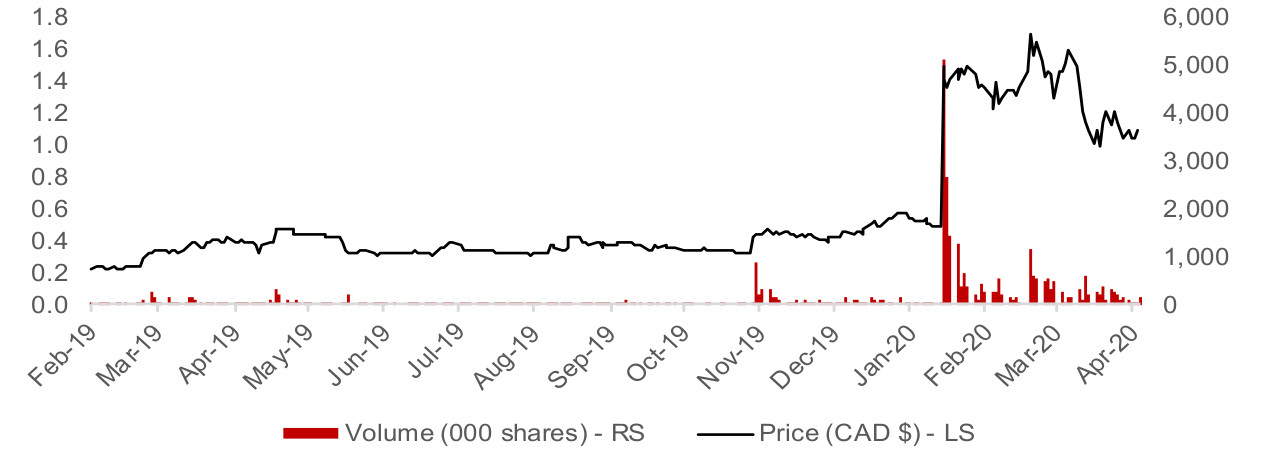
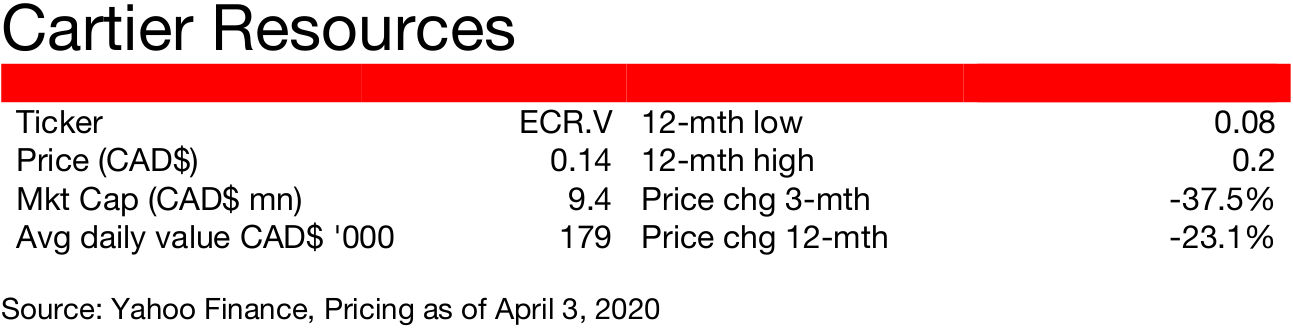
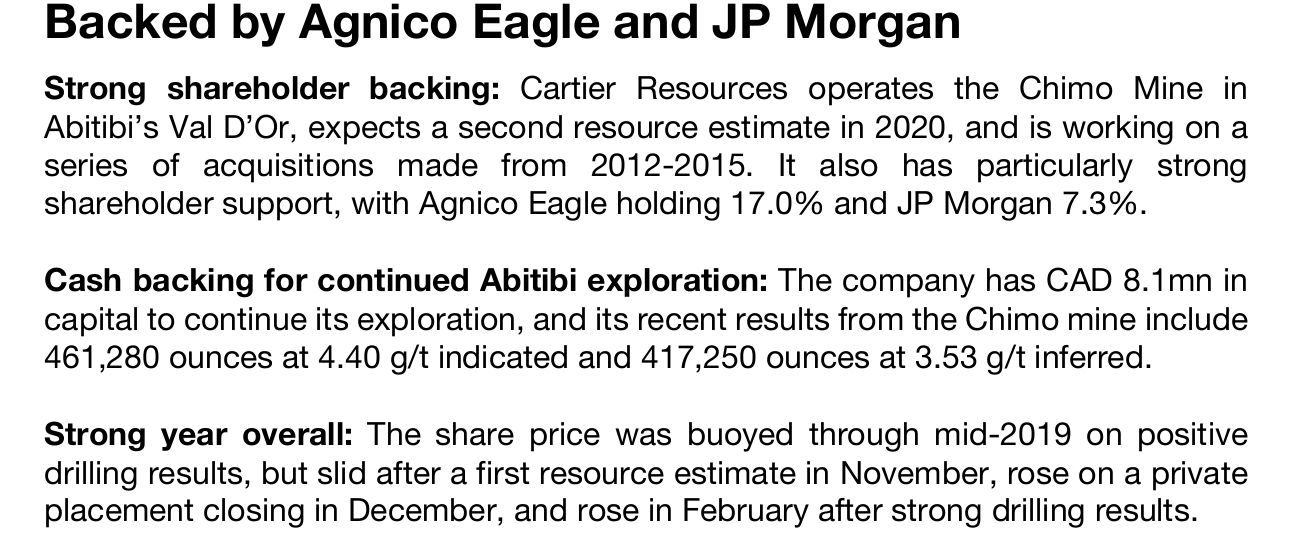
Figure 30: Cartier Resources share price and volume
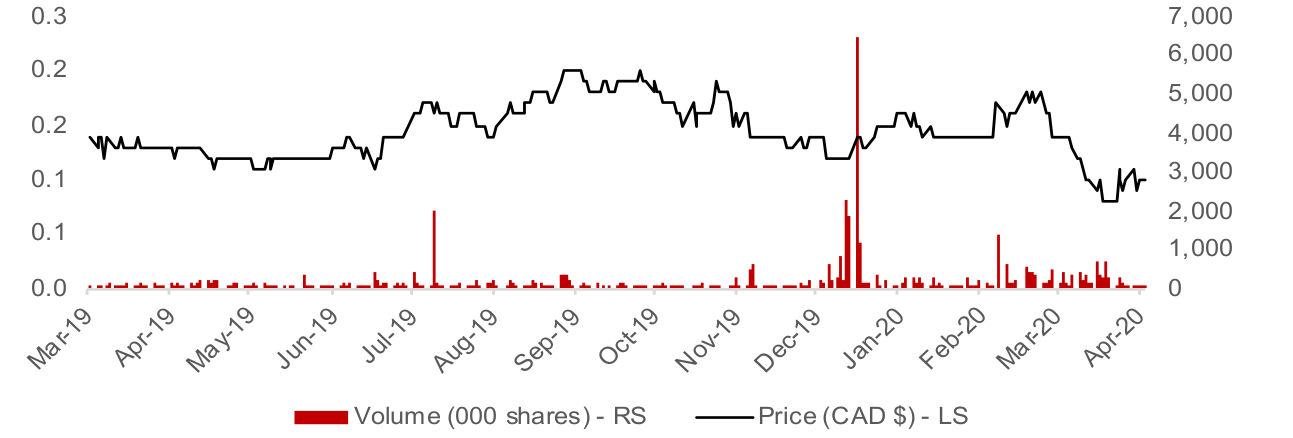
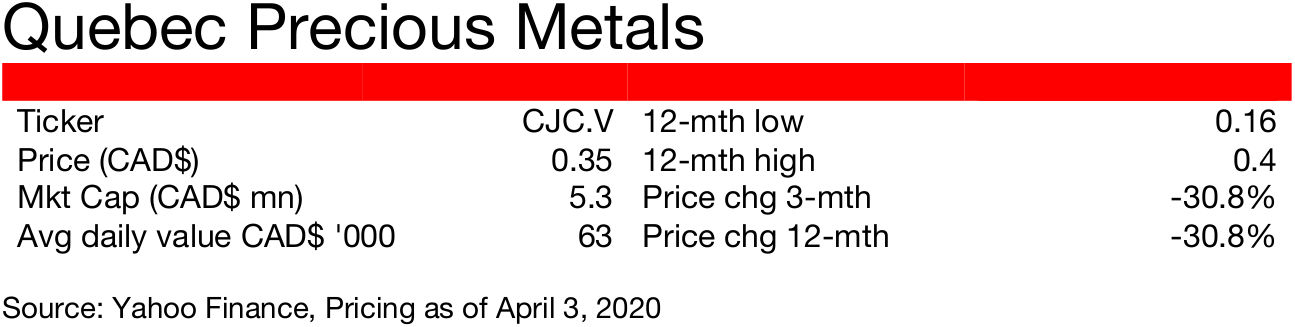
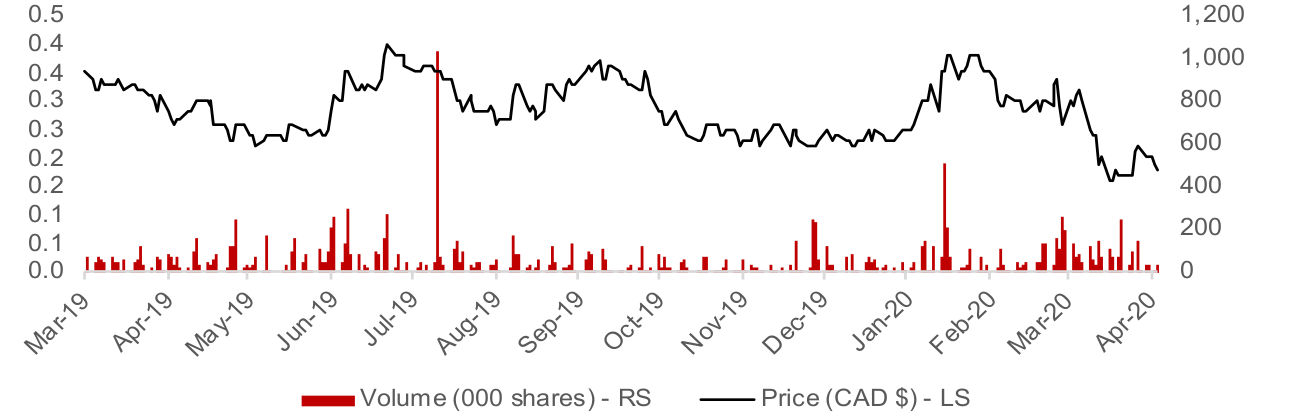
Figure 31: Quebec Precious Metals share price and volume
Juniors will remain active in Quebec
Production and exploration activities shutdown
Juniors may face reduced access to capital
Many short-term pressures
The big issues facing gold miners now are not Quebec specific, but rather global, with the crisis forcing the shutdown of production and exploration activities across the world. Meanwhile the juniors, in Quebec and elsewhere, also have the added issue of potentially reduced access to capital, as investors become materially more risk averse. Adding to this is the lack of any clear timeline on when the global health crisis will start to subside, it is difficult for firms to make any plans or projections, and in turn puts capital raising activities on hold.
The crisis has boosted the gold price to a new sustainable level above US$1,500
Gold averaged US$1,250 only in the six years to mid-2019
Long-term outlook remains strong
Nonetheless, while the immediate crisis may be a difficult period for juniors, it looks to be very supportive of the gold price. Gold has averaged US$1,500/ounce since June 2019, well above average production costs of major Canadian mines, and with a major monetary and debt expansion on the way in response to this crisis, this level (or higher) looks to be sustained for a considerable period. Post-crisis, this will surely be good for juniors, as the gold price had languished at just an average US$1,250/ounce for the six year prior to mid-2019, barely high enough to encourage large miners to make investment, let alone inspiring the market to support the activities of the juniors.
Strong district, major operating mines, and underexplored areas
Crisis may shakeout more marginal players, leaving remaining firms in better situation
Quebec will see continued interest from juniors
Quebec is likely to see continued interest from juniors, given its combination of a globally attractive district, the presence of major operating mines and potential to explore near them, many underexplored sites and a gold price that is likely to remain high. Meanwhile the current crisis may shake out some of the more marginal players, this could leave operators with management teams with a solid track record and higher and more quality resources with access to capital that may have previously have been spread more thinly across more firms.
Disclaimer: This report is for informational use only and should not be used an alternative to the financial and legal advice of a qualified professional in business planning and investment. We do not represent that forecasts in this report will lead to a specific outcome or result, and are not liable in the event of any business action taken in whole or in part as a result of the contents of this report.