April 25, 2022
Aggressive Fed Talk Drives Down Gold
Author - Ben McGregor
Gold stocks under pressure as gold and equity markets fall
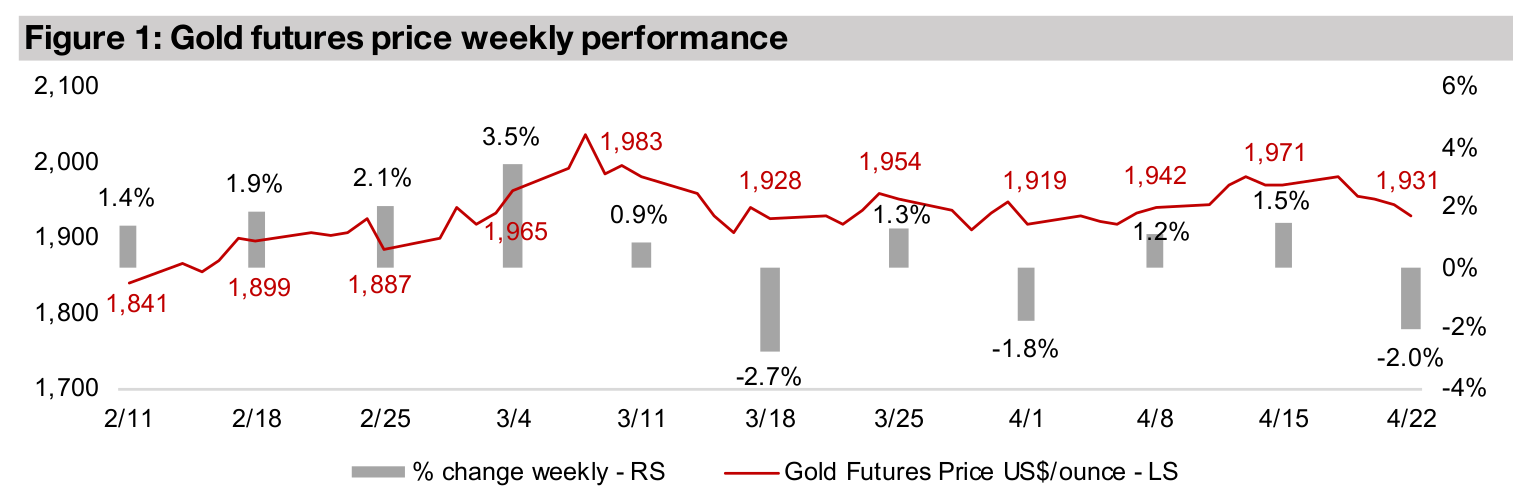
Gold fell -2.0% to US$1,931/oz this week and equity markets saw a major decline as the US Fed indicated that it would be hiking rates faster than previously expected in reaction to continued high inflation, which put pressure on gold stocks.
Looking at gold production in a long-term context
This week we look at global gold production in a long-term context going back to the late 1890s, showing that world output of the metal is still near all-time highs, as is Canadian production, with only a slight decline caused by the global health crisis.
Producers and juniors down heavily
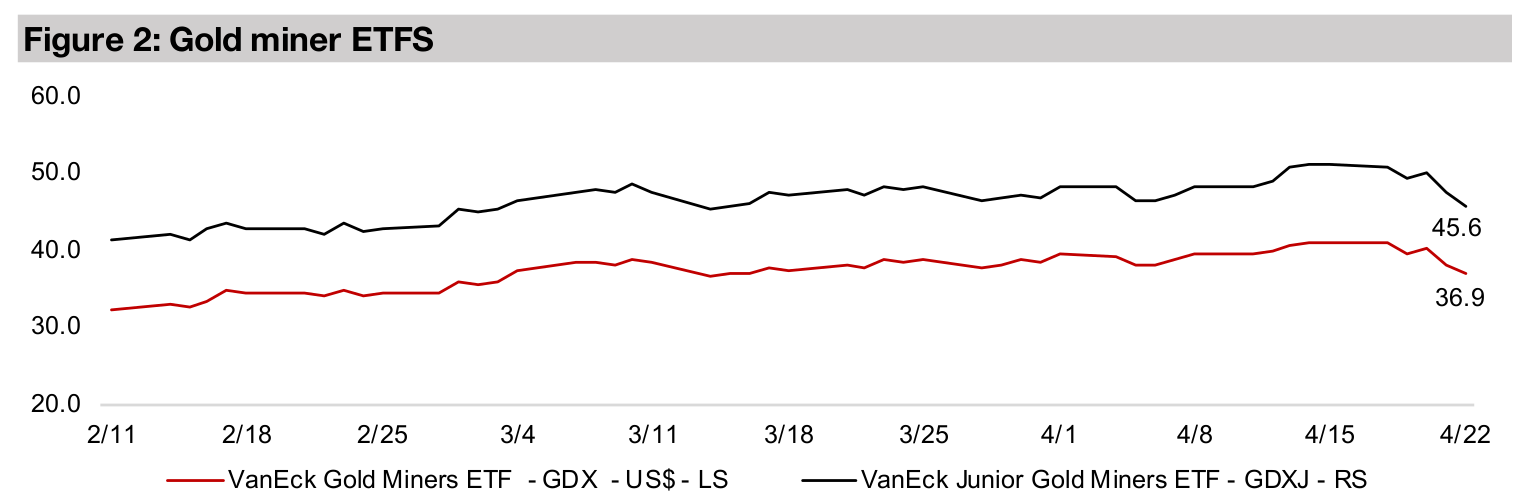
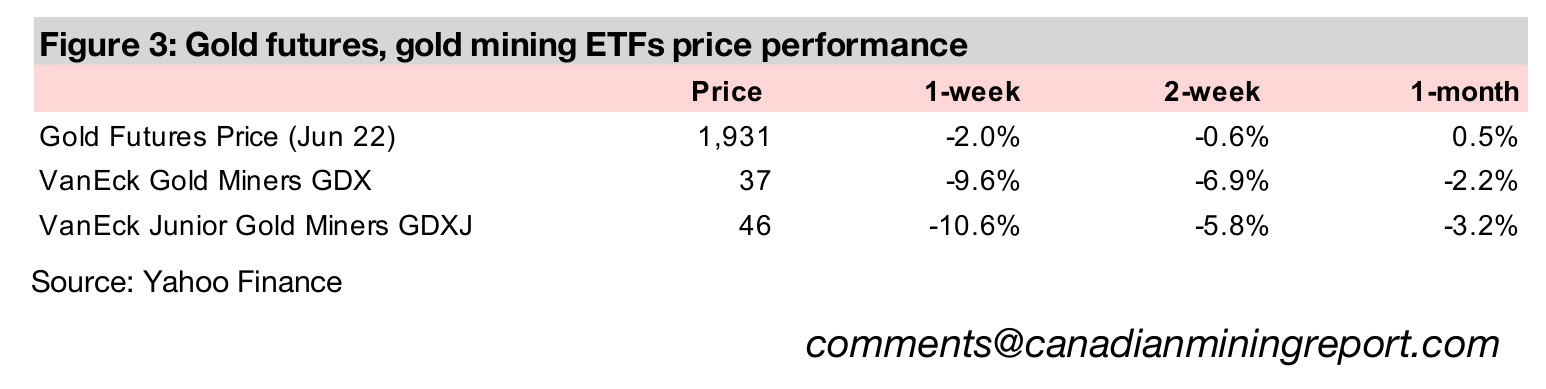
The producers and juniors were both down heavily, with the GDX falling -9.6% and the GDXJ down -10.6% and most of the TSXV Canadian juniors dropped materially as the Fed's warning of faster coming rate hikes hit both gold and equity markets.


Aggressive Fed Talk Drives Down Gold
Gold was down -2.0% to US$1,931/oz this week and equity markets declined heavily as the US Fed indicated a faster pace of rate hikes to come, which drove a significant decline in gold stocks. The Fed has a mandate to regulate the money supply to both support economic growth and limit price inflation to a maximum around 2.0%. However, with inflation surging to over 8.0% in the US, far above this target, and at levels not seen in nearly forty years, the Fed has for the first time in decades come under real pressure to take strong action to curb rising prices. The increasingly hawkish Fed has put pressure on equity markets for most of the year, and it has also hit the gold price. This is because while US 10-year real bond yields remain heavily negative, making gold an attractive alternative, the market may be concerned that higher nominal rates and flattening or falling inflation could make these real yields less negative, thus putting some pressure on gold. We believe that Fed will be limited in the rate hikes it can make, as it could precipitate not only a stock market, but a broader economic decline, and that gold will remain strong this year.
Canada's gold production in a very long-term global context
This week we look at Canada's recent gold production versus the world in a very long-term context, with global data for world production going back to 1682 with output at 6 metric tonnes (MT) (Figure 4). There was a rise in production in the 1700s to 20 MT by mid-century, but production declined again to just 7 MT by the early 1800s and stayed low until the industrial revolution propelled a surge to 24 MT by 1852, with a moderate pull back over the next two decades before another jump to high as 451 MT in 1899 driven especially by the North American goldrush before a decline to 366 MT by 1900. The second half of Figure 4 rebases the scale from a 500 MT maximum to 3,500 MT, showing the massive growth in output erupting in the first forty years of the 1900s, more than tripling to 1,301 MT.
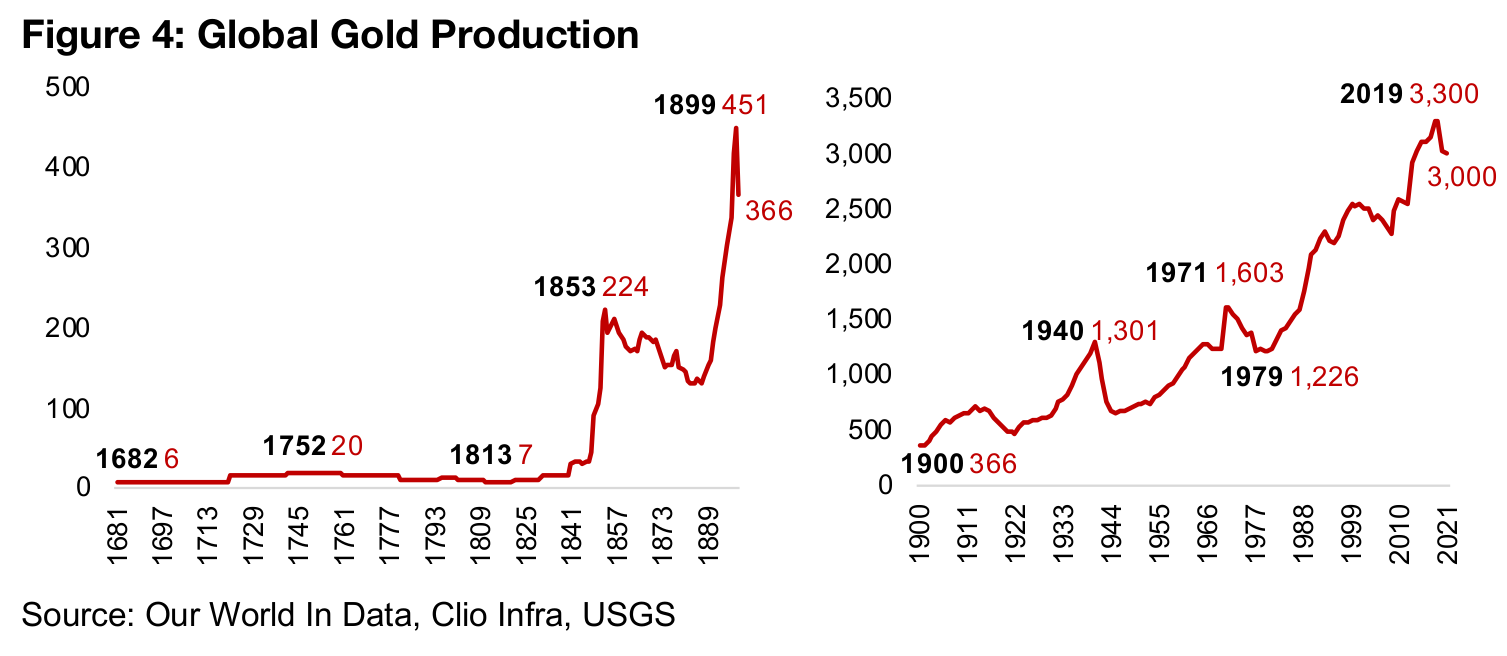
There was a major decline in gold production during the second world war as
resources were diverted to military use, but over the 1950s and 1960s production
recovered, and reached new highs in 1971 at 1,603 MT. Production decreased over
the 1970s to a low of in 1979 at 1,226 MT, but with the surging gold price from the
mid-1970s encouraging renewed investment in the industry, production again rose,
and has been relatively uninterrupted since, hitting a peak at 3,300 MT in 2019, with
even the global health crisis only reducing output to 3,000 MT in 2021.
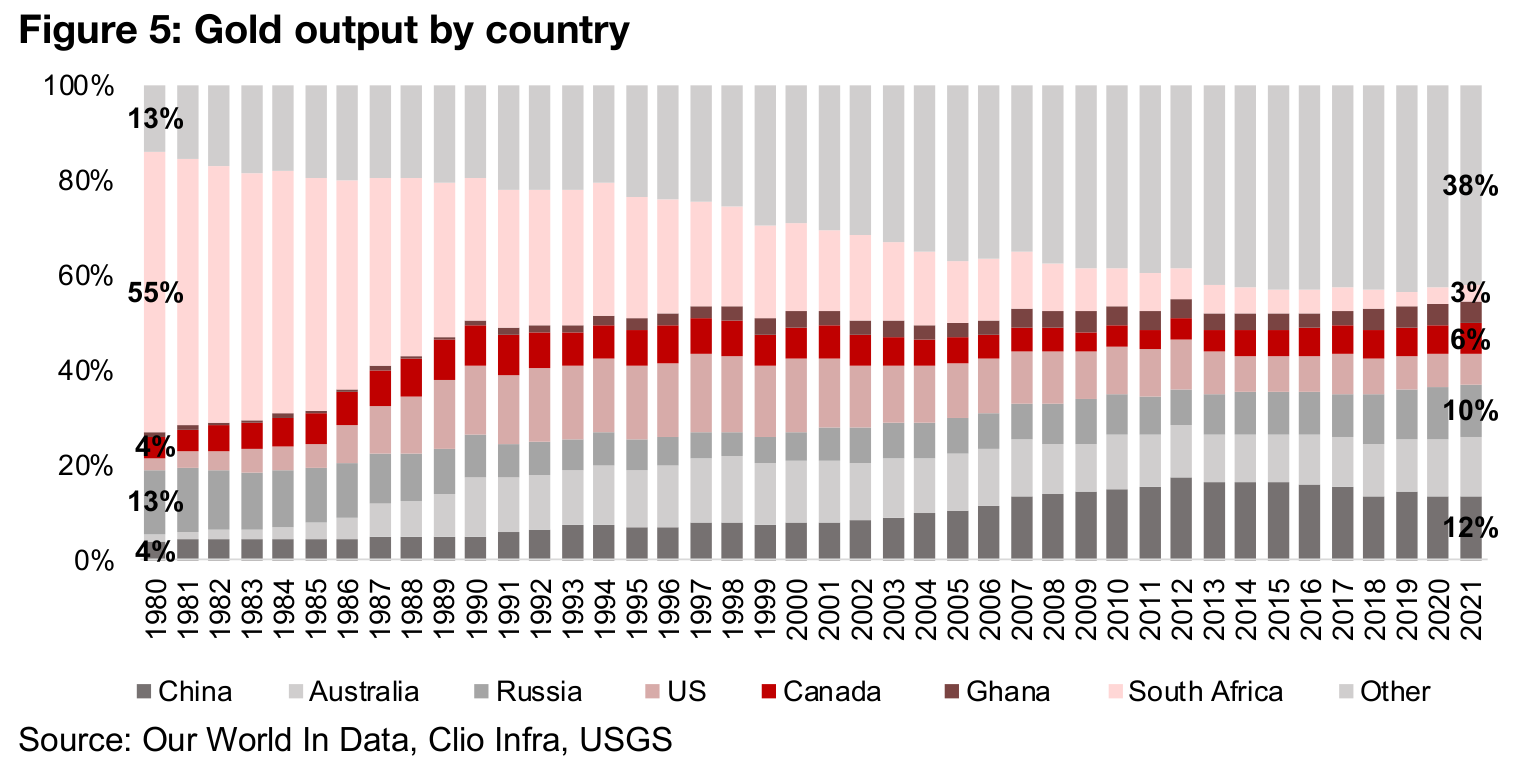
There have been a few major shifts in the composition of gold production over the
past four decades. First has been the major decline in South African gold production,
from being by far the global dominant producer in 1980, at 55% of the world total, to
just 3% in 2021 (Figure 5). Second has been the rise in 'other' countries, those with
production below around 60 MT in 2021, which combined have risen from just 13%
of output in 1980 to 38% in 2021, as the mining industries in many emerging
economies have become more developed especially since the 1990s, leading to
growth in mineral resource extraction for countries with such natural endowments.
Third is the major increase in China's and Australia's output, from relatively small
players in 1980s, with 3.7% and 1.5% of global output, respectively, to becoming the
world's two leading producers. China produced 370 MT in 2021, or 12.3% of the
global total, and Australia 330 MT, or 11.0% of the world total. Russia had been a
strong number two global player in 1980, at 12.6%, and while its share slipped in the
1990s, it has picked up since, to become the third largest global producer in 2021, at
10.0% of the total. The US has seen a substantial increase in its share from just 2.5%
in 1980 to 6.0% in 2021, becoming the fourth largest global player.
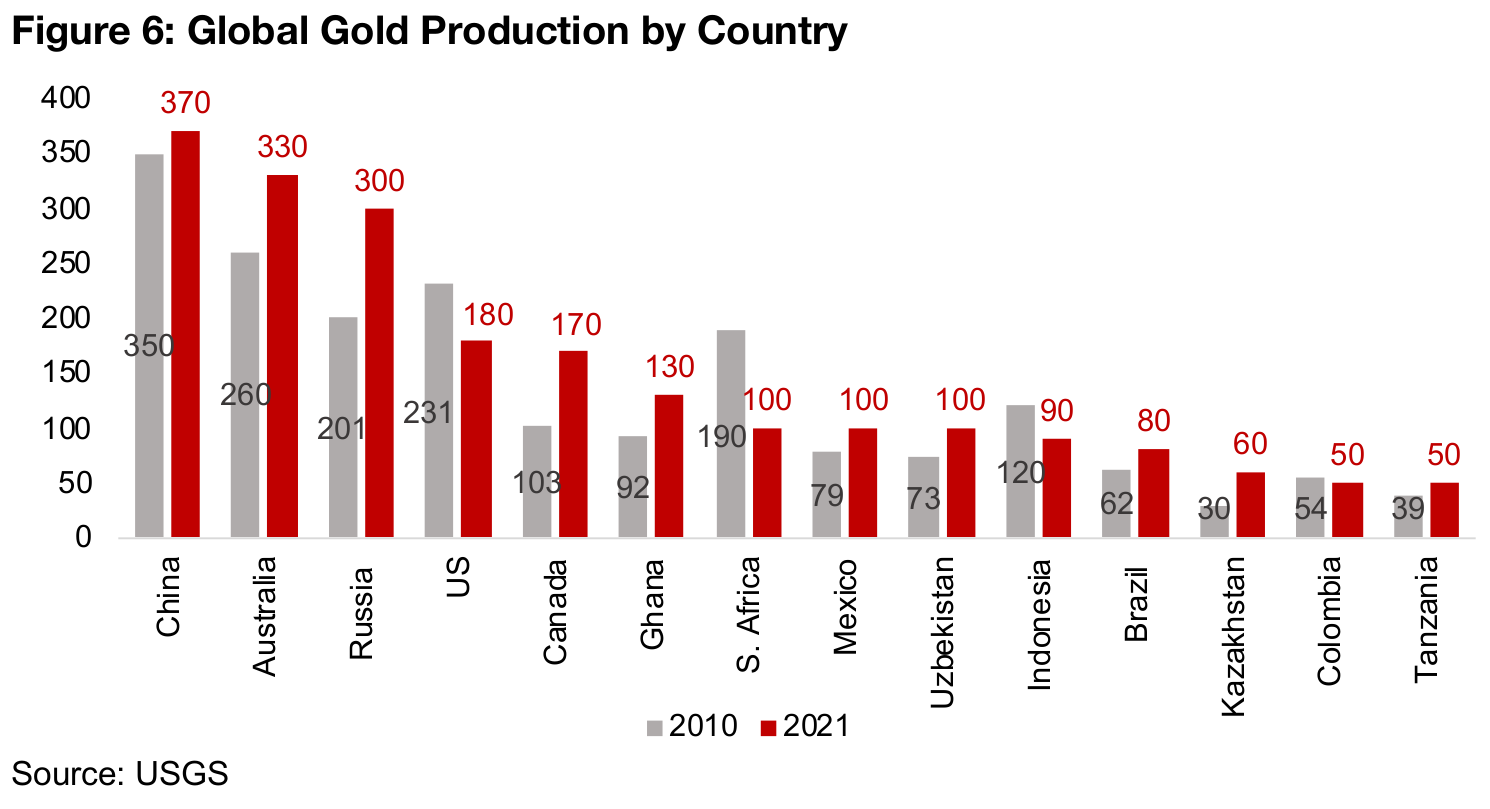
Canada has been quite steady in its share of global production, having generally been able to increase its output along with the global level, accounting for 4.2% of total in 1980 and 5.7% in 2021, maintain its position as the fifth largest player (Figure 6), and reaching a peak share over the past forty years of 8.1% in 1989 and a low of 3.7% in 1974. Figure 7 shows Canada's gold production and its current level of production and global share in a long-term historical context since the 1900s. Its started the century with a big increase in its share because of the Klondike goldrush in the Yukon territory that carried over from the 1890s, with a peak of 42 MT, at 11.5% of global production in 1900, before the bust to just 13 MT by 1907.
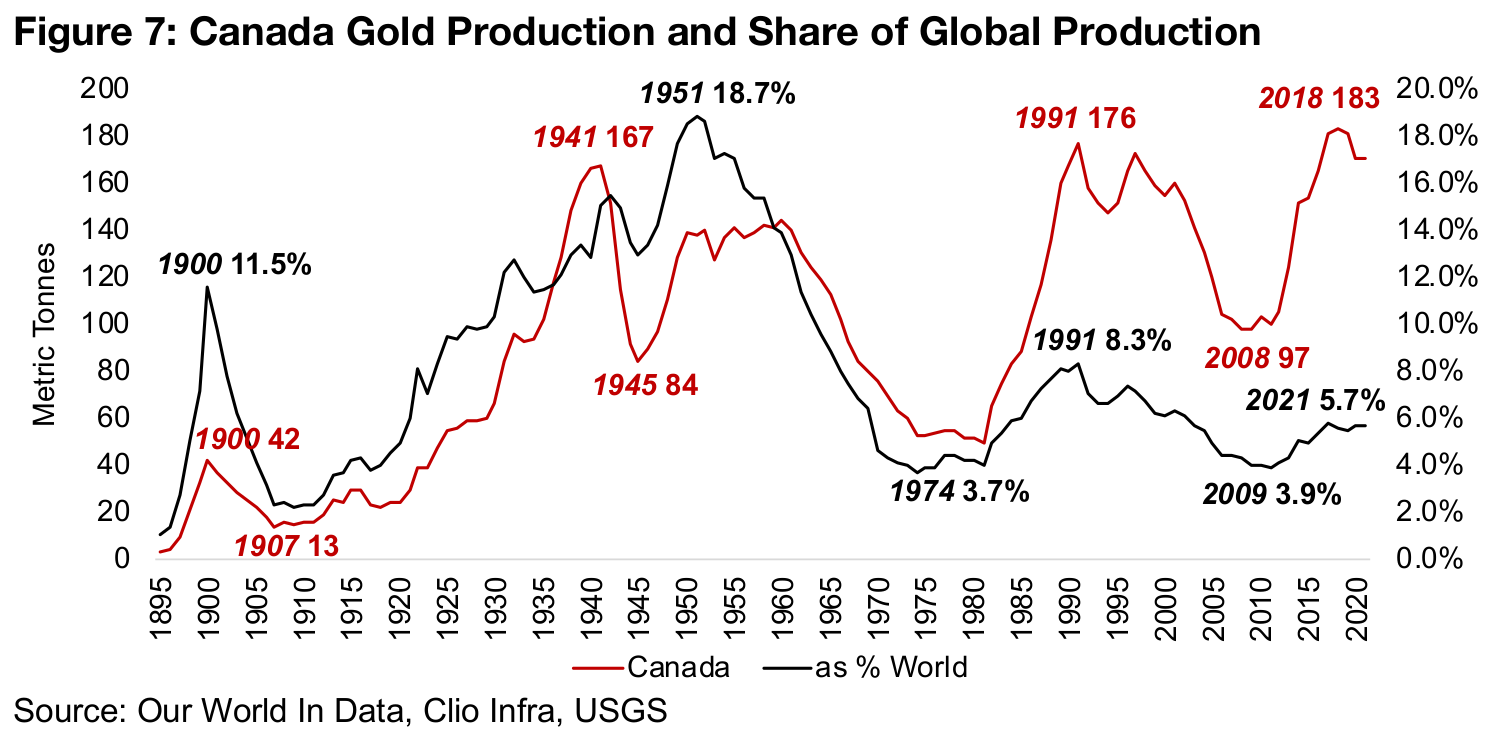
However, from the 1910s, output continued up nearly continuously until 1941, when it peaked at 167 MT, before World War II diverted resources to other uses. However, Canada's while absolute gold production decreased over the war to a trough of 84 MT, the share of global output continued to rise to its highest ever level at 18.7% in 1951, as global production in other countries declined even more than in Canada because of the war and its aftermath. Over the next two decades, however, Canada's absolute production plummeted to 49 MT in 1981, with its share of global production reaching a trough at 3.7% in 1974, especially driven by a surge in production from South Africa. Output rebounded through the 1980s, peaking at 176 MT and 8.3% of the global total in 1991, then declined over the next twenty years to a low of 92 MT in 2008, with a trough global share of 3.9%, before rising to an all-time peak of 183 MT in 2018, with its global share picking up to 5.7% by 2021.
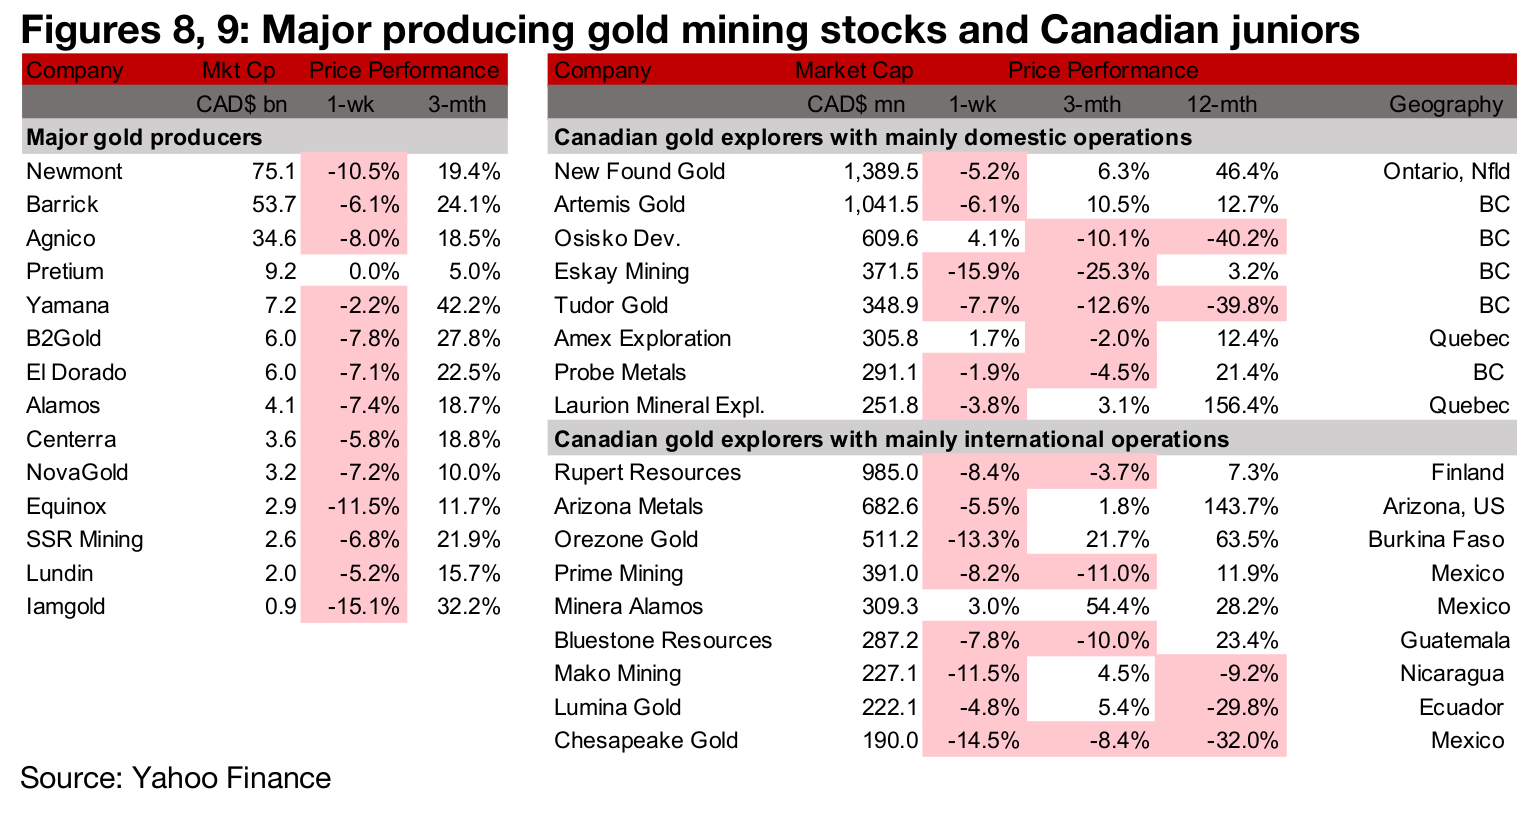
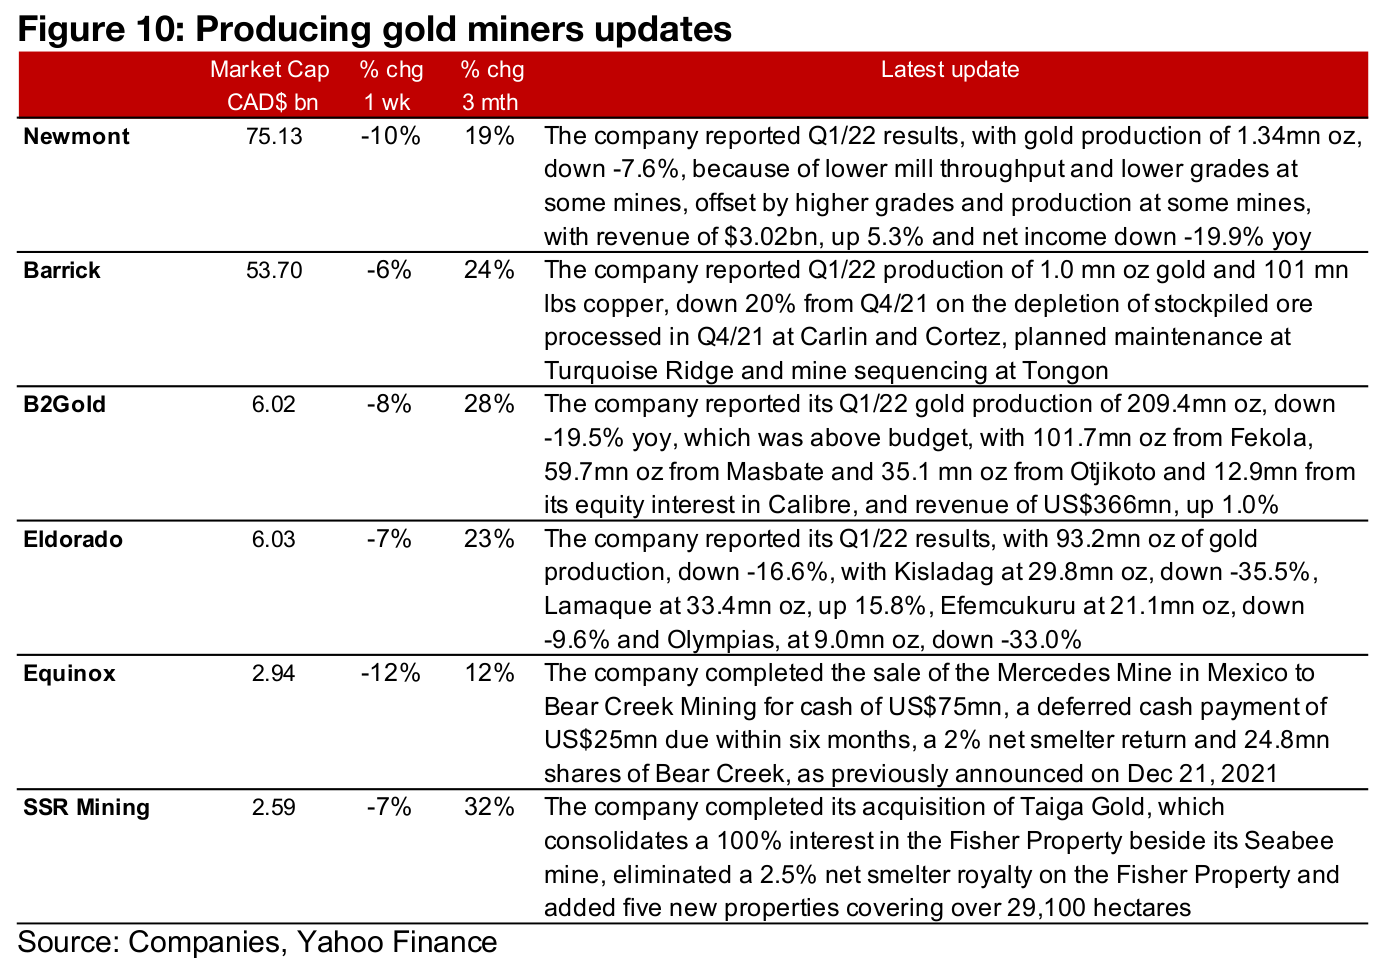
Producers and Canadian juniors down on gold and equity decline
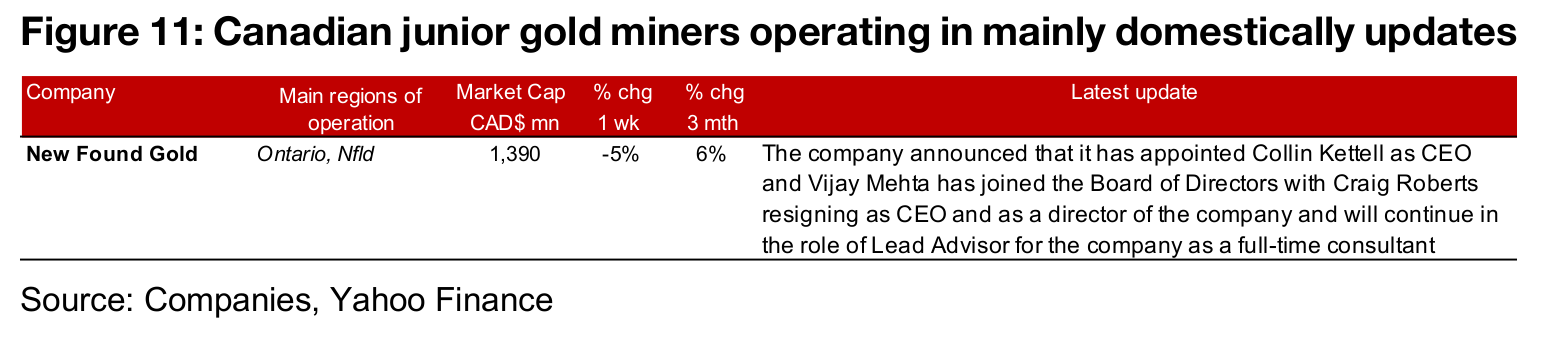
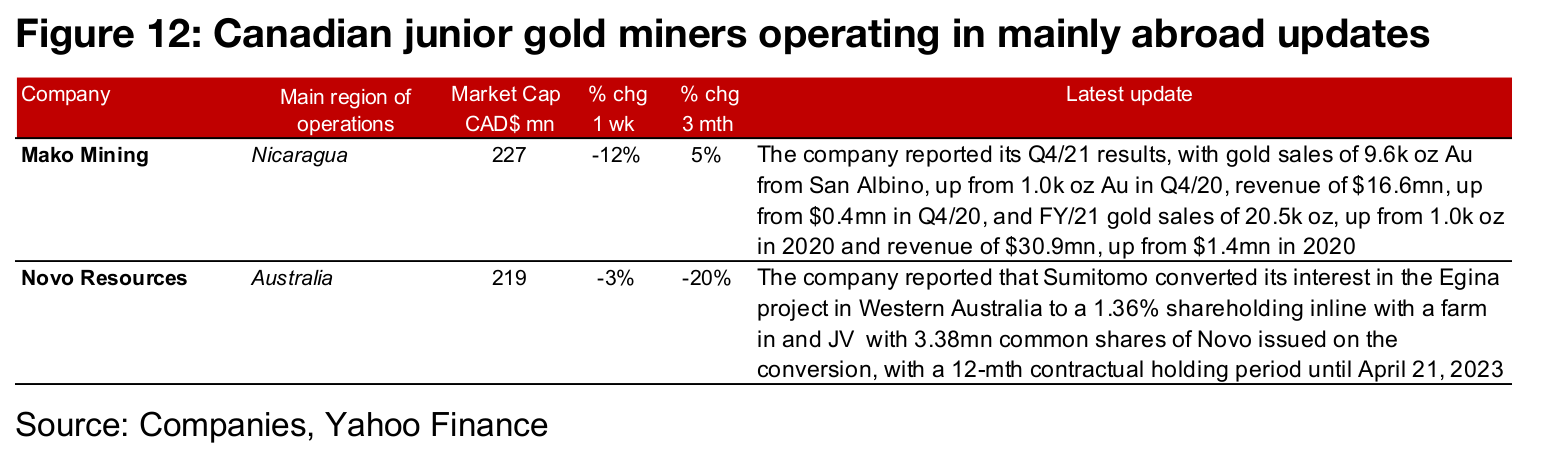
The producing gold miners and the Canadian juniors were almost all down on the gold and equity market decline (Figures 8, 9). For the producers, Newmont reported Q1/22 results and Barrick, B2Gold and Eldorado all reported Q1/22 production, while Equinox completed the sale of the Mercedes Mine in Mexico to Equinox and SSR completed the acquisition of Taiga Gold (Figure 9). For the Canadian juniors, New Found Gold announced the appointment of Collin Kettell as its new CEO and Vijay Mehta to its Board of Directors, Mako Mining reported its Q4/21 results and Novo reported that Sumitomo converted its stake in the Egina project in Western Australia (Figures 11, 12).
In Focus: Eskay Mining (ESK.V)
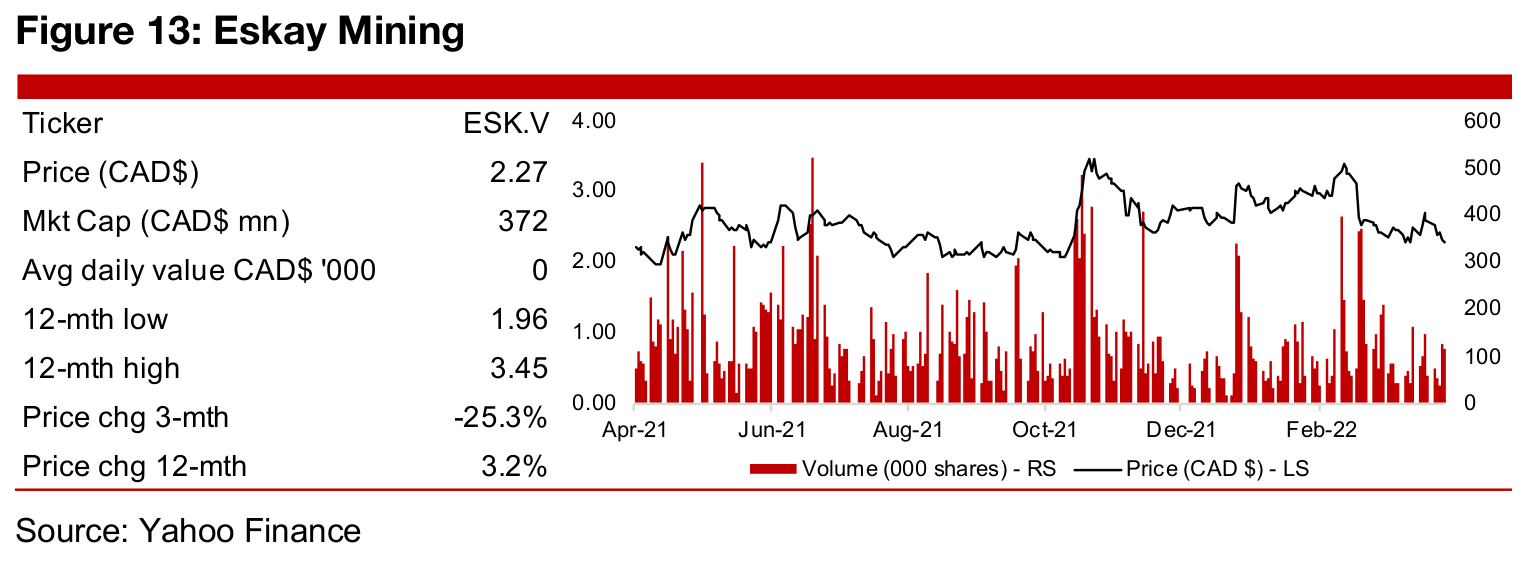
Preparing for another drill program in B.C.'s golden triangle
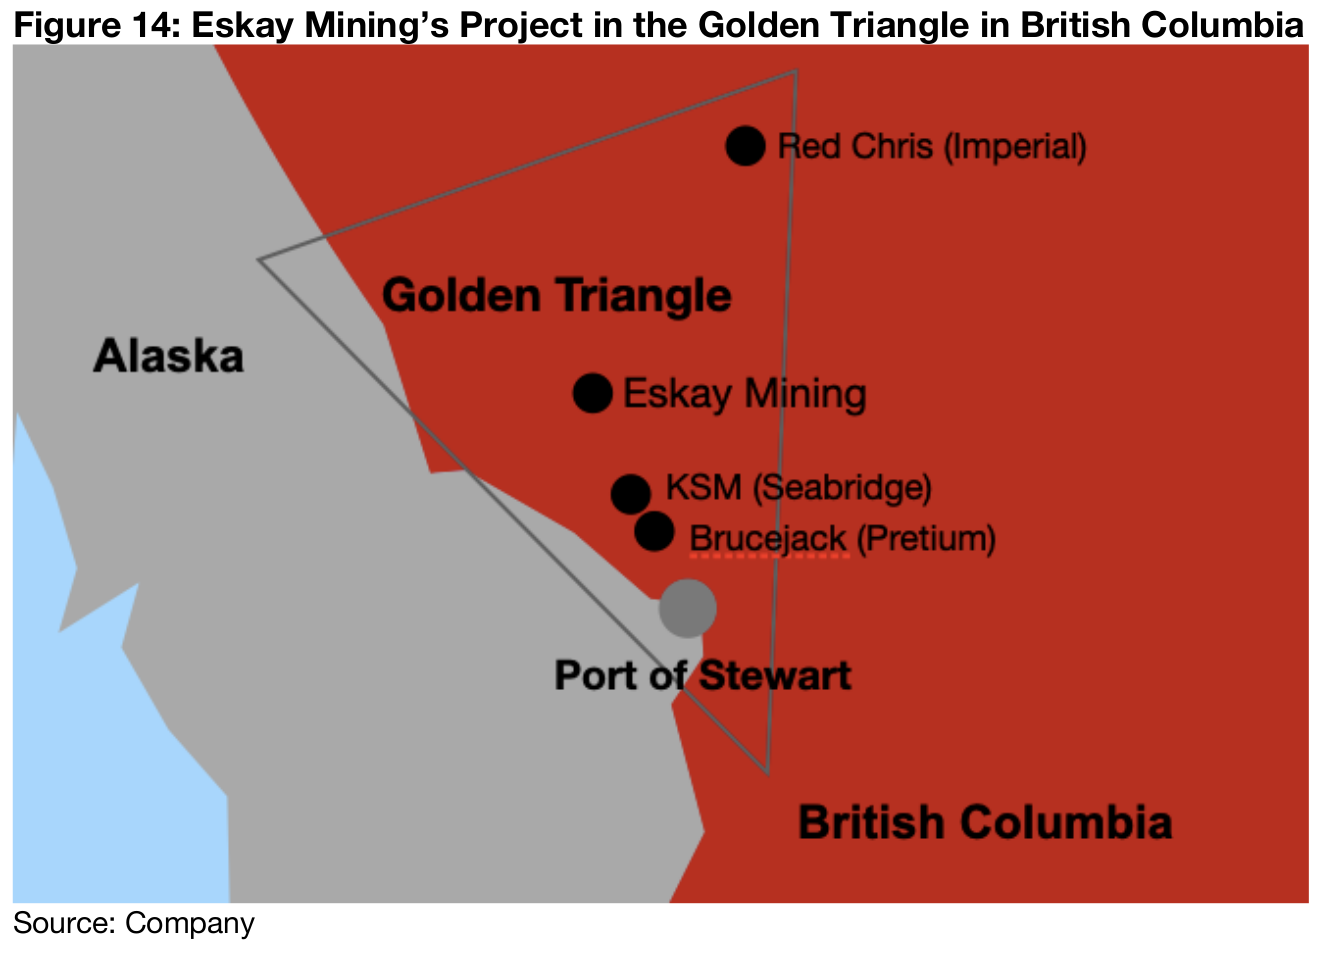
Eskay Mining is preparing for another drill program at its 52,600 hectare Eskay project
covering 52,600 hectares in British Columbia's Golden Triangle, which has historically
seen strong gold production. The Eskay project is close to the largest gold mine in
British Columbia, Newcrest's Brucejack, and Seabridge's KSM deposit, which is
among the largest gold development projects in Canada, and the Golden Triangle is
also home to Imperial's Red Chris copper/gold mine (Figure 14). The upcoming
program follows the company's successful 2021 drilling, which focused on the
company's thesis that that the area shows evidence of substantial Volcanogenic
Massive Sulphides (VMS).
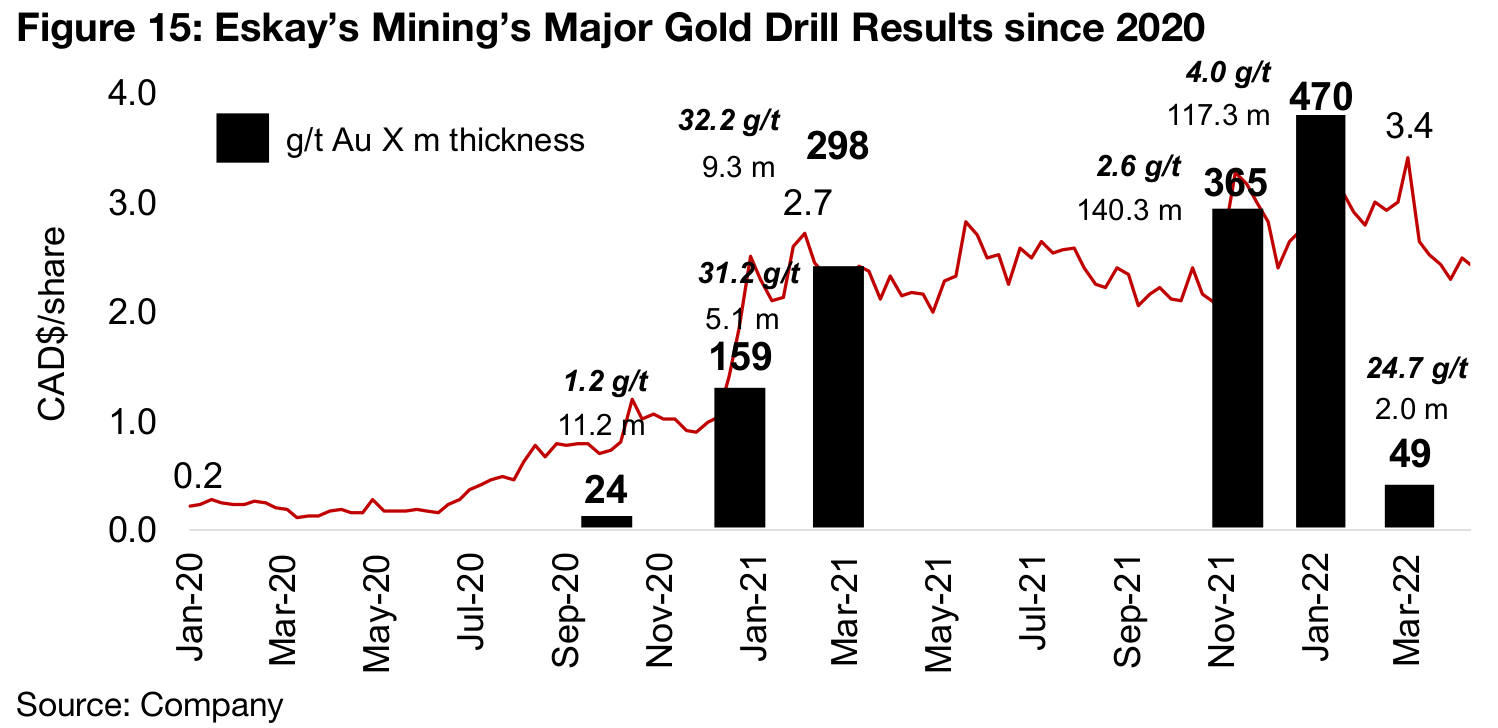
This thesis was developed after the re-examination of data from prior drill holes
starting especially since 2020, and exploration results late that year saw the first major
increase in the company's share price, with results of over 30 g/t Au for grams-
thickness highlights of 159 in January 2021 and 298 in March 2021 that really started
to drive up the share price, which reached CAD$2.7/share by Q1/21 (Figure 15). The
share price remained relatively flat over the next six months but jumped again on
another strong set of results from late 2021. While the grades were lower, at 2.6 g/t
and 4.0 g/t, the widths were higher, at 140.3 m and 117.3 m, for a gram-thickness of
365 in November 2021 and 470 in January 2022, which drove the stock price to a
peak of CAD$3.4/share. Subsequent drilling highlights in March 2022 were only at 49
grams-thickness, with the grade high at 24.7 g/t but only over 2.0 m.
The company has outlined eight new targets near the TV and Jeff VMS deposits that
were identified last year which will be the focus of this year's summer exploration
program. The company announced a private placement of up to US$7.0mn in March
2022, with the first tranche of $2.1mn closed in the first week of April 2022, which will
fund the exploration program for this year, with the company having held just $1.5mn
in cash on its balance sheet as of its most recent results on November 20, 2021.
Disclaimer: This report is for informational use only and should not be used an alternative to the financial and legal advice of a qualified professional in business planning and investment. We do not represent that forecasts in this report will lead to a specific outcome or result, and are not liable in the event of any business action taken in whole or in part as a result of the contents of this report.