May 30, 2022
Gold Edges Up on Dollar and Yield Decline
Author - Ben McGregor
Gold edges up as the US dollar and yields continue to decline
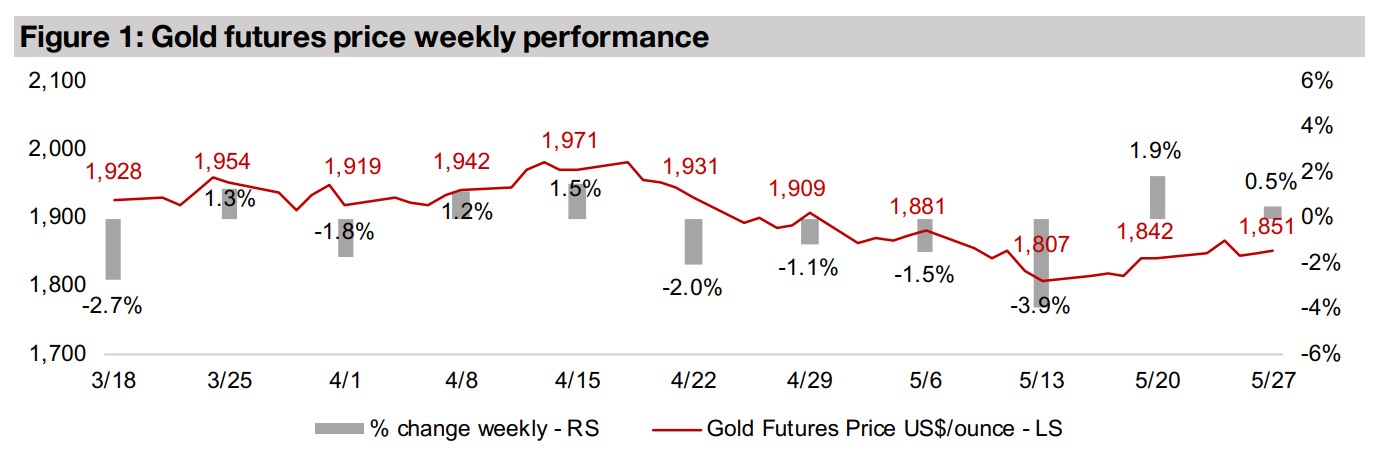
Gold rose 0.5% to US$1,851/oz this week as the US dollar and yields continued to decline even as the Fed saw its preferred gauge of inflation edge down and indicated it would reduce its balance sheet by June 2022, while equity markets jumped.
Large TSXV-listed gold stocks and the Lassonde Curve
This week we look at the large TSXV-listed gold stocks in the context of the Lassonde Curve, a model outlining the typical valuation and de-risking path for a mining project, showing that the stocks are quite evenly distributed across the stages of the curve.
Global producers and juniors rebound moderately
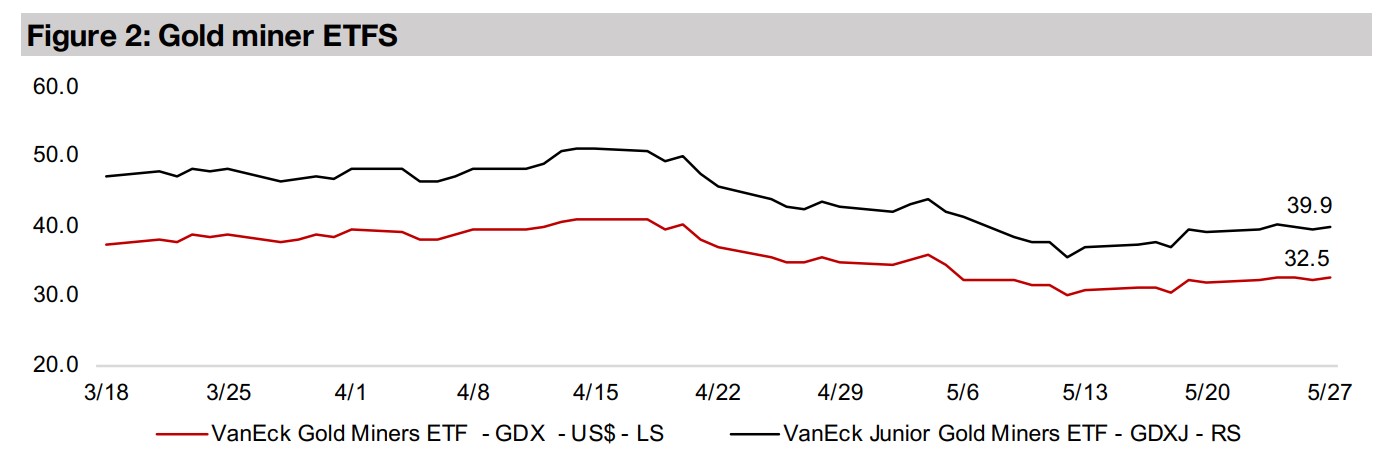
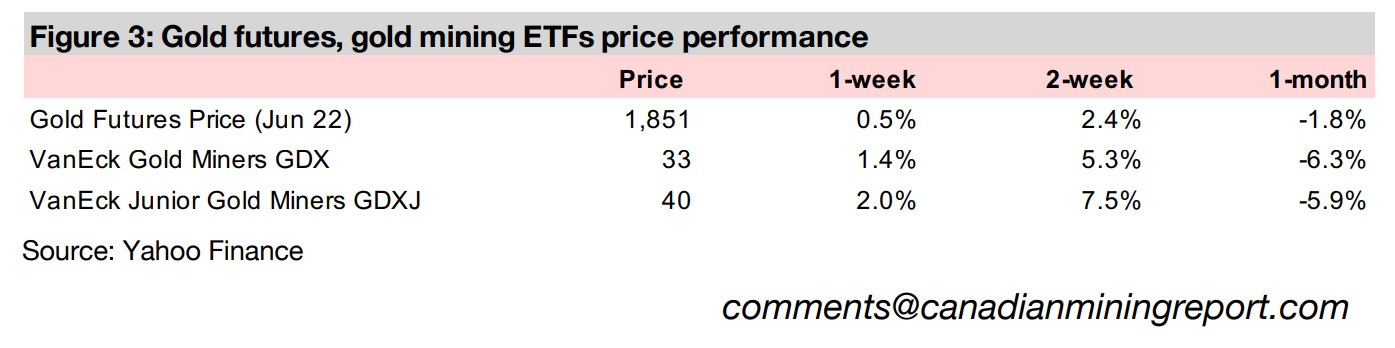
The global gold producers and juniors rebounded moderately on the gain in gold and equity markets, with the GDX up 1.4% and the GDXJ up 2.0% but the Canadian juniors were mainly down and did not participate in the global equity market rally.


Gold Edges Up on Dollar and Yield Decline
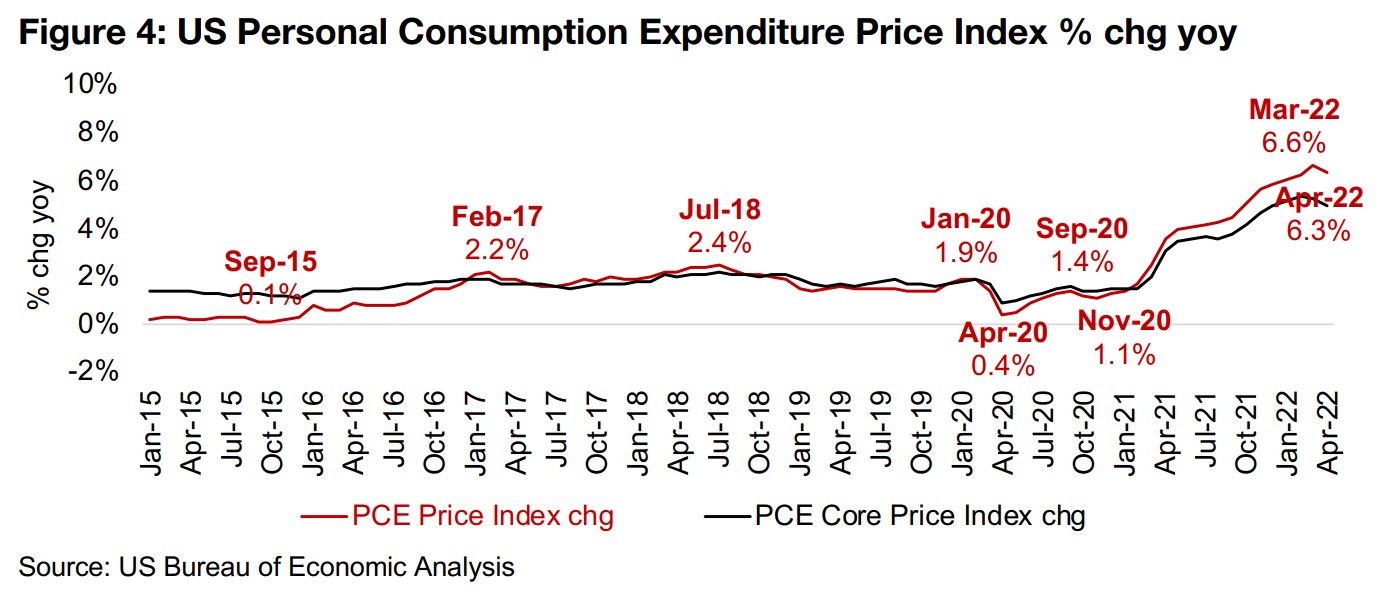
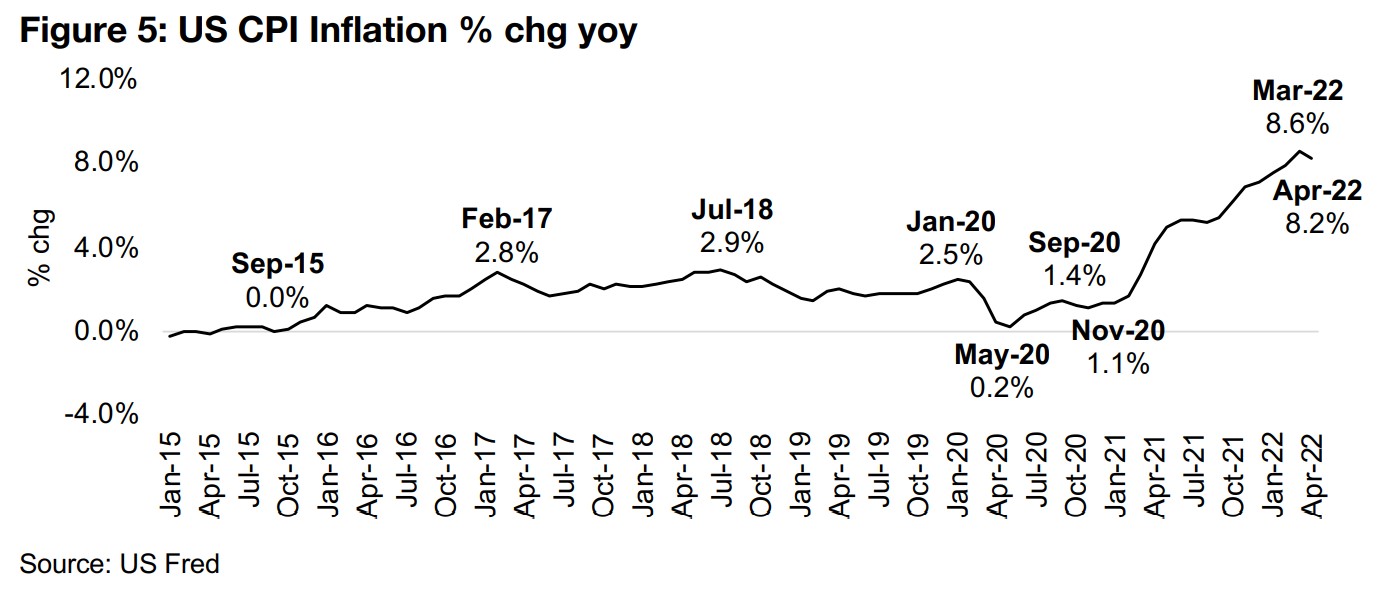
Gold rose 0.5% this week to US$1,851/oz, with the main news being the release of both the minutes of the US Federal Reserve Open Market Committee (FOMC) from May 2022 and the April 2022 US Personal Consumption Expenditure (PCE) Core Price Index, which is the Fed's preferred gauge of inflation. Global equity markets surged towards the end of the week on these two releases, although neither suggested anything particularly bullish for the market in our view. The PCE Price Index inflation did edge down to 6.3% in April 2022 from 6.6% in March 2022, and the Core PCE Index, which strips out food and energy costs, and is one of the main indicators looked at by the Fed to track price inflation, also fell (Figure 4). However, this month on month decline in inflation was already well known to the market, from the US CPI Inflation which was already released three weeks ago. While the absolute levels of the US PCE Price Index and US CPI Inflation do differ, they show a very similar trend and roughly the same peaks as troughs, as shown in Figure 5.
Fed's planned balance sheet reduction could pressure equity markets
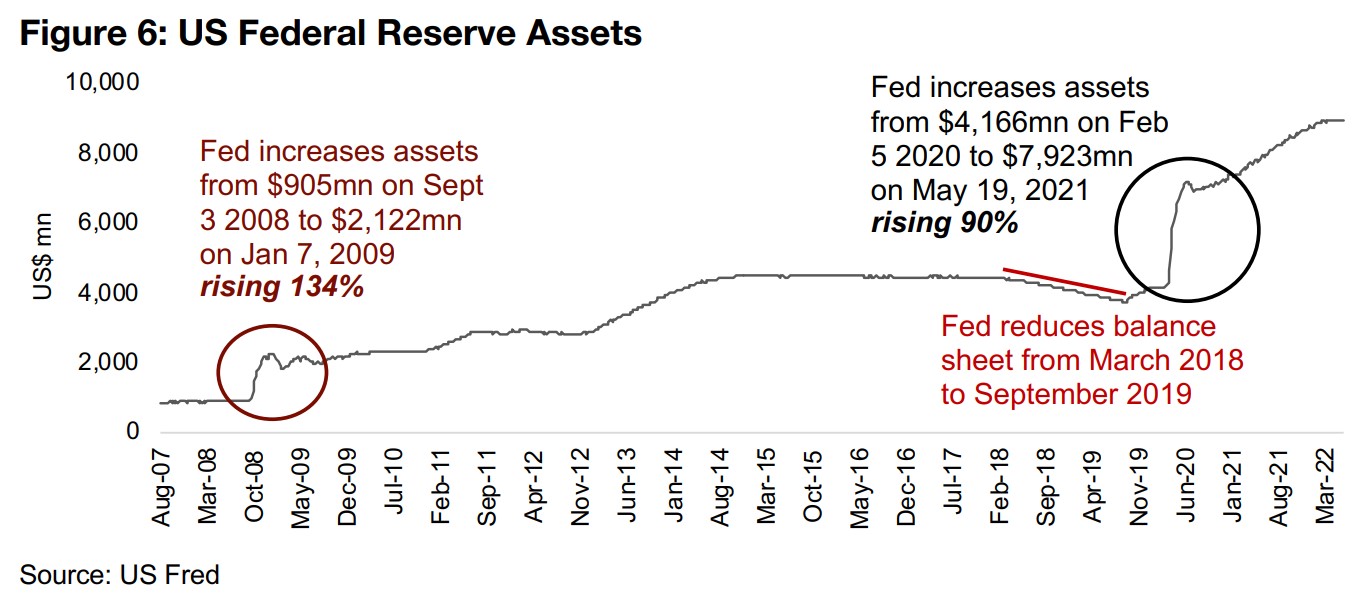
We therefore did not see this PCE Price Index release as being sufficient to drive the big gains in equity markets. The Fed minutes did not contain anything particularly bullish for equity markets either, in our view, with the key new point being that the Fed would begin to reduce its balance sheet as of June 2022. The Fed's balance sheet has seen two massive increases over the past fourteen years, first in the 2008- 2009 global financial crisis, by 134%, and then in the global health crisis from 2020- 2021, by 90% (Figure 6). Over the entire period since 2008, the Fed has really only reduced its balance sheet from March 2018 to September 2019, and this caused weakness in the stock market. We expect it will be very difficult for the Fed to reduce its balance sheet by much without causing further fallout in the equity markets, with its sell off of bonds likely to further exacerbate already rising rates, which would put additional pressure on stock valuations.
Recent equity market rally could just be a standard bear market surge
Overall we don't see much fundamental justification for the big move in equity markets over the past week, and believe that the gain could just be a standard bear market surge. While long bull markets tend to have steady gains over a long period of time with low volatility, bear markets tend to be marked by high volatility. Big surges are met by even bigger subsequent declines as speculators become less confident in upward price moves, with a higher propensity to more quickly lock in gains by selling. We can see this in the movement of the MSCI World Index since late 2021, with three major upswings being reversed to even lower lows. In bear markets these short-term swings are often not necessarily reflective of underlying fundamental news flow, and we believe this may have been the case this week, with neither the FOMC minutes or PCE data really warranting such a jump in the markets.
Some fundamental drivers turn in gold's favor
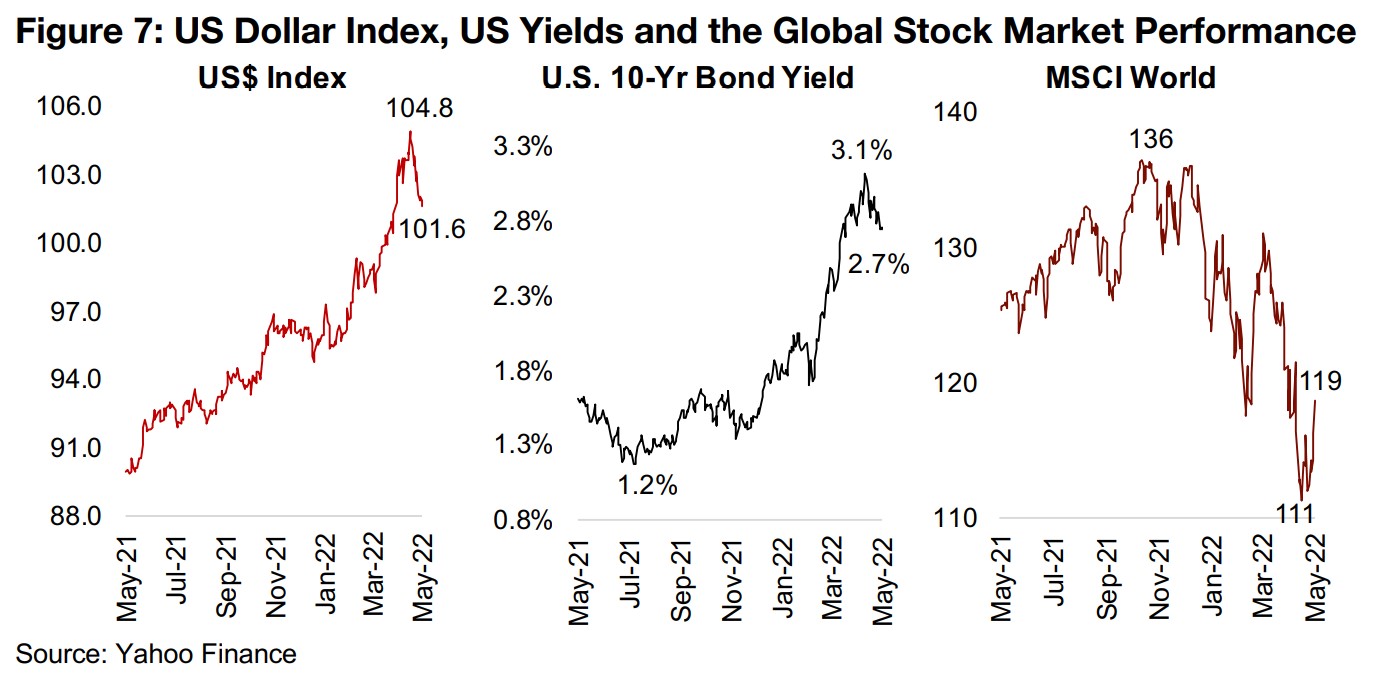
For the gold price, we might expect the news of the reduction in the Fed's balance sheet and the implication of rising yields and the fall in inflation to be negative drivers, but it still did gain for the week. This has likely been because of a continued fall in both yields, with the 10-year US bond yield down from a 3.1% peak to just 2.7% and a decline in the US dollar index from a peak of 104.8 to 101.6 over the past month (Figure 7). This suggests that the market is perhaps not fully buying into the idea that the Fed will be able to aggressively reduce its balance sheet or hike rates. We expect that the Fed will likely be forced by economic and market fallout to pull back on this strategy and that the market is weighing in such a scenario, thus supporting gold.
Gold stocks may be pulled down by broader pressure on equity markets
However, even if gold continues to hold up relatively well, we expect that gold stocks
could remain under pressure, as the Fed is likely to implement a few more rate hikes
before being forced to pullback, which is unlikely to be viewed favorably by markets,
given the reaction to hikes so far in 2022. There is also the issue of stock market
valuations still being at excessive levels, and a retreat in those multiples could further
exacerbate the decline. While the valuations for gold stocks, including the juniors, are
actually still reasonably low in contrast to the rest of the market, we expect that they
will also face selling pressure if a broader equity market decline continues.
This would suggest that the valuations of gold stocks may move from currently
moderate to very inexpensive, but that it could take time and pain in the markets to
get there, so we do not see a major rush to buy in here. The current period is likely
more one for research to determine the best picks in the context of a given investor's
risk and reward profile, with a target to get in later once the Fed is eventually
compelled to reverse its rate hikes and balance sheet reduction. By that time some
serious deals are likely to be had in the sector, especially among the juniors, which
have taken a major hit as small caps have been heavily sold off in recent months.
The Lassonde Curve a model for mineral deposit valuation over its cycle
In determining how a given junior mining stock fits within an investor's risk and reward
profile, the Lassonde Curve can be a helpful model for determining the shift in market
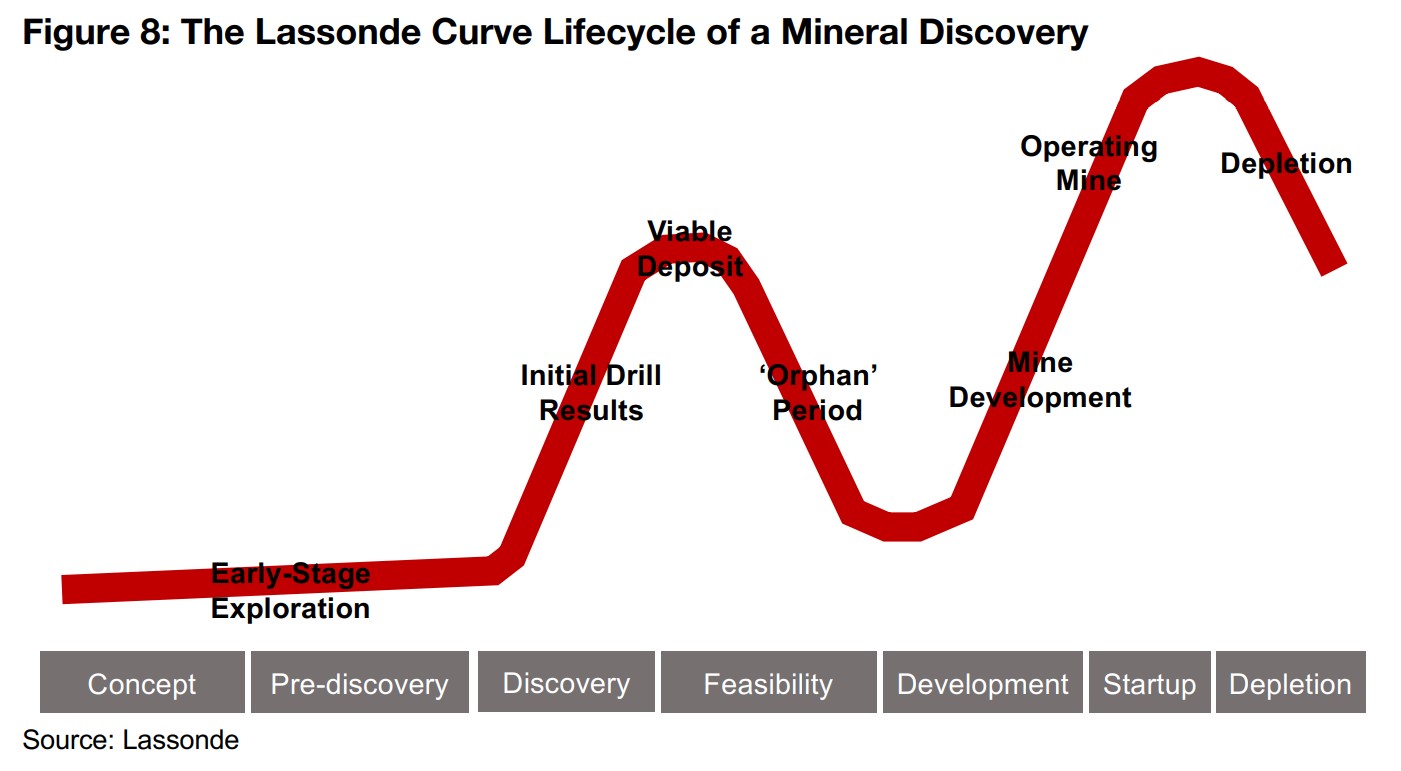
value of a mining project and its level of risk over time. The model outlines seven main
phases, with the project at its lowest level of value at the first Concept stage, when
the company will have a geological thesis for the deposit that hasn't been well tested
(Figure 8). The value can increase into the second Pre-discovery phase as evidence
starts to come through supporting the thesis. More extensive drilling takes place in
the third Discovery phase and strong results can see the value of the project surge
as it becomes more widely recognized by the market.
Once it appears that there is a viable deposit the value of the project can hit a local
peak before it shifts to the fourth Feasibility stage. This where the hope and
speculation based mainly on high drilling grades in the Discovery phase gives way to
the hard reality of assessing the project's economic and political viability and securing
funding. This can mark an extended downturn in the market value of the company,
as early speculators may exit their holding to move on to the next big thing and
longer-term supporters of the company may not have bought in yet. In the fifth
Development phase, the market value again picks up as the project achieves permits
and funding and then reaches the sixth Start Up phase when production begins.
Production eventually peaks and then declines in the final seventh Depletion phase.
Placing the large TSXV-listed gold juniors on the Lassonde curve
In Figure 9 we place the large TSXV-listed gold juniors on the Lassonde curve, giving
a rough estimate of where these companies are in this process of de-risking, and see
that they are reasonably evenly distributed across the curve, giving a variety of
options of for investors depending on their risk and reward preferences. There are
four companies that are in the discovery stage, with the main drivers being drill results,
with none having yet reached a mineral resource estimate. Prime Mining and Arizona
Metals have seen strong drill results especially since 2021, while Eskay Mining and
New Found Gold are further along, releasing strong drill results since 2020.
There are four companies we would place in the Feasibility stage. Two have gotten
as far as their initial mineral resource estimates, with Rupert Resources having
released one for its Ikkari project in September 2021 and Tudor Gold ahead of this,
releasing an estimate for its Treaty Creek project in March 2021. Probe Metals is
further along in this stage, being the most recent to release a Preliminary Economic
Assessment, in September 2021. Bluestone has been at this stage for an extended
period, with a PEA released for its Cerro Blanco project in 2019 and updated in
February 2021, and targets early works on its mine by late 2023.
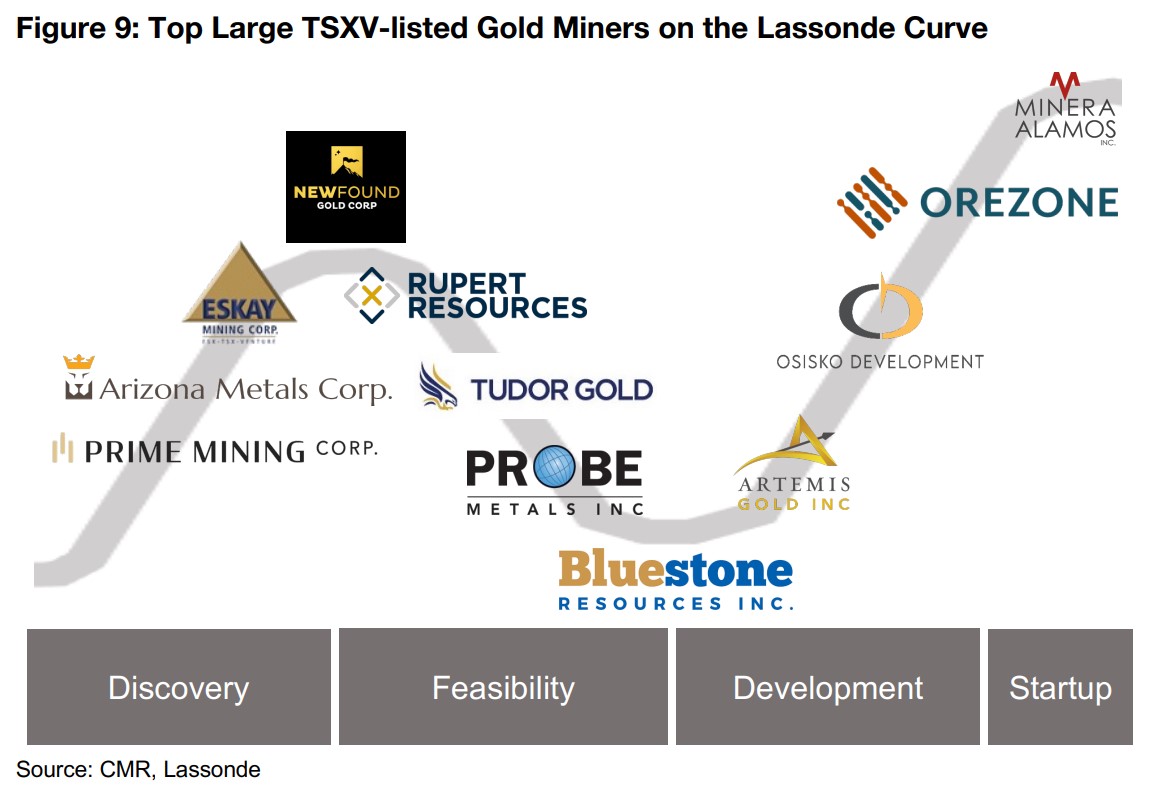
Three companies have projects that have clearly shifted into the development stage. Artemis has secured debt and equity financing for its Blackwater project and is currently arranging agreements with contractors to build its mine, with production expected by Q2/24. Osisko Development is also at an advanced stage for its Cariboo project, with production expected by Q4/23, and Orezone is the most advanced, with first gold pour expected for its Bombore project by Q3/22, while its share price has picked up significantly this year and is one of the highest performers of the group, given that it has mostly been de-risked. Only one of the companies is actually in production, Minera Alamos, with its Santana project having had its first gold pour in November 2021, and it has two other projects in the development stage.
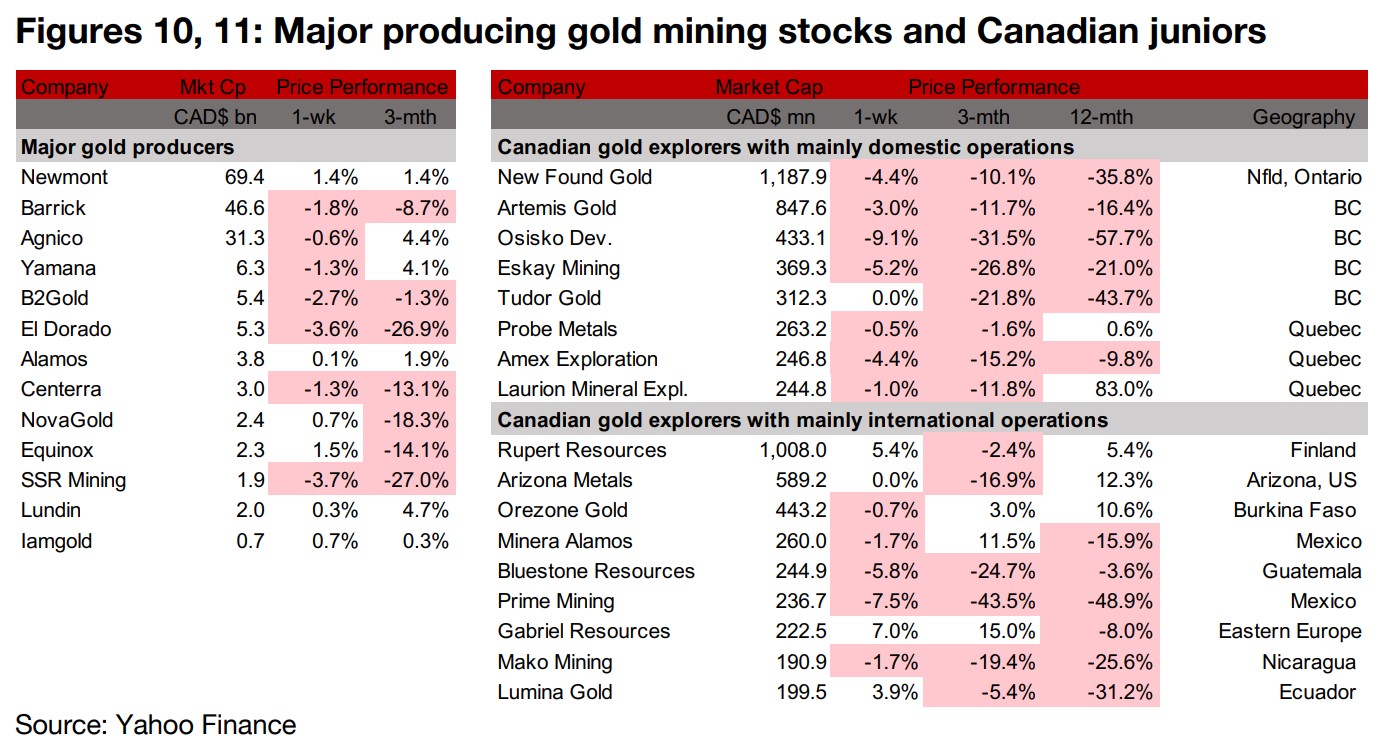
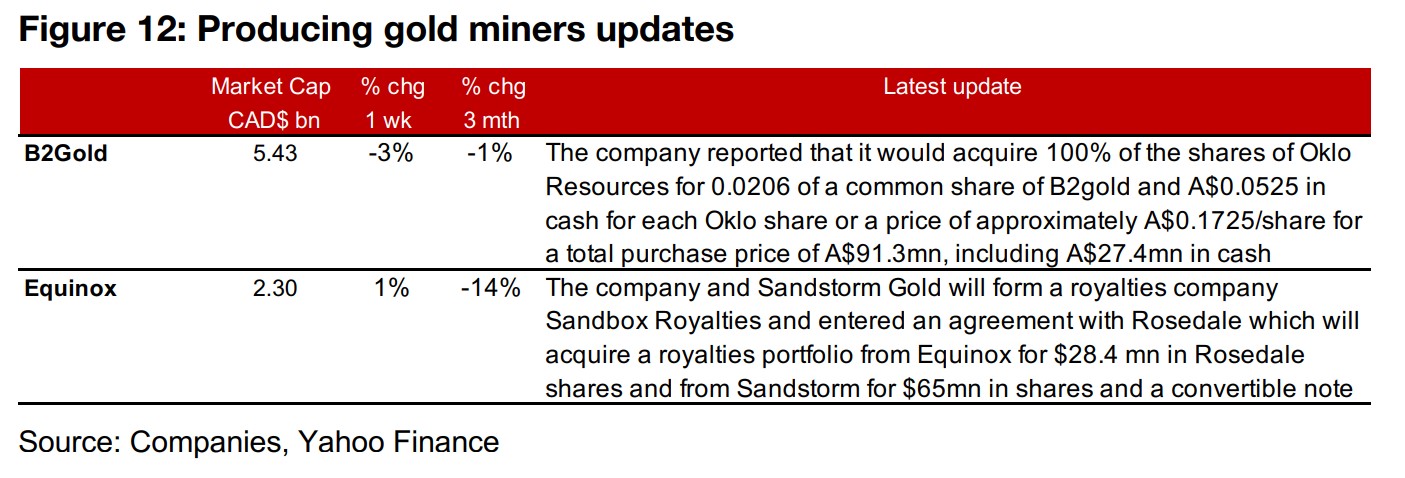
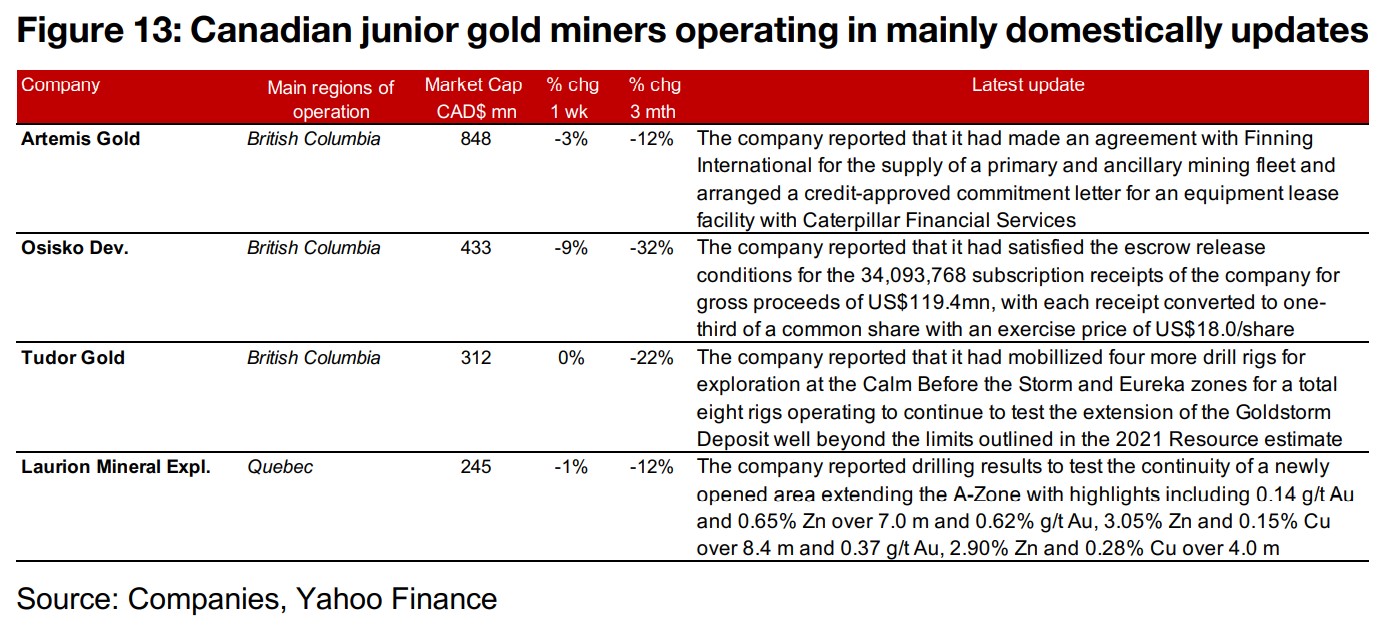
Producing miners and Canadian juniors mostly down
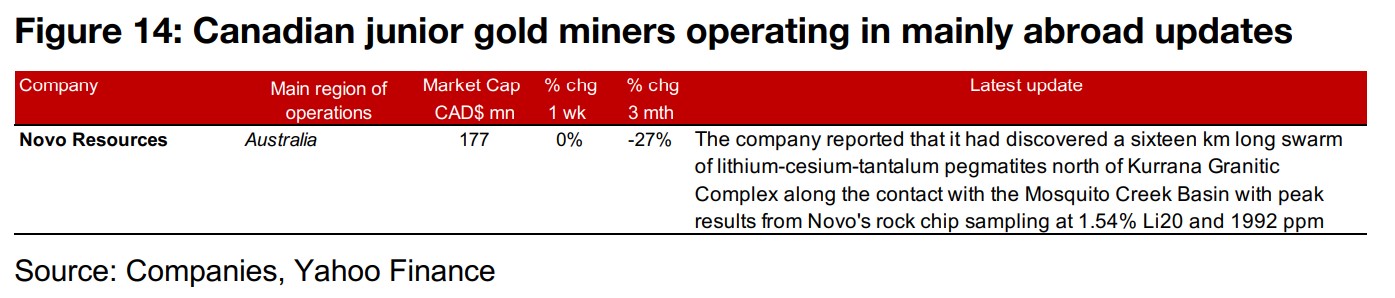
The producing gold miners and the Canadian juniors were mostly down for the week even as the gold price and equity markets picked up (Figures 10, 11). B2Gold reported that it would acquire Oklo for A$91.3 mn, and Equinox announced that it would form a royalties company, Sandbox Royalties, with Sandstorm Gold (Figure 12). For the Canadian juniors operating mainly domestically, Artemis made agreements with Finning International and Caterpillar Financial Services for mining equipment, Osisko Development satisfied the escrow release conditions for US$119.4mn of subscription receipts, Tudor Gold mobilized four more rigs at Goldstorm and Laurion reported new drilling results (Figure 13). For the Canadian juniors operating mainly internationally, Novo reported a new lithium discovery (Figure 14).
Disclaimer: This report is for informational use only and should not be used an alternative to the financial and legal advice of a qualified professional in business planning and investment. We do not represent that forecasts in this report will lead to a specific outcome or result, and are not liable in the event of any business action taken in whole or in part as a result of the contents of this report.