Bittersweet Truth for Gold Stocks: What You Need to Know / Commodities / Gold and Silver Stocks 2021

When the Fed entices grown up kidswith sweet words, they hit the candy store and stock up on gold, silver, andstocks. A sugar hangover follows.
Beware of the candyman!
With Fed Chairman Jerome Powellperforming his usual dovish dance on Aug. 27, gold, silver, and mining stockswere like kids in a candy store. However, with the short-term sugar highs oftenleaving investors with nasty stomach aches, the sweet-and-sour nature of theprecious metals’ performances may lead to pre-Halloween hangovers.
HUIIndex: Harbinger of Things to Come
To explain, while the HUI Indexinvalidated the breakdown below its previous lows, the bullish reversal mayseem quite sanguine. However, an identicaldevelopment occurred in 2013 right before the index continued its sharpdecline. Moreover, I warned previously that the HUI Index could record acorrective upswing of 4% to 8% (that’s what happened after the breakdown in2013) and that it would not change the medium-term implications. And after theindex rallied by more than 6% last week, the bounce is nothing to write homeabout.
Furthermore, after recording a similarbreakdown below the neckline of its bearish H&S pattern in 2000, ashort-term corrective upswing followed before the HUI Index resumed its swiftdecline. As a result, gold, silver, and mining stocks may not behave like JollyRanchers for much longer.
Please see below:
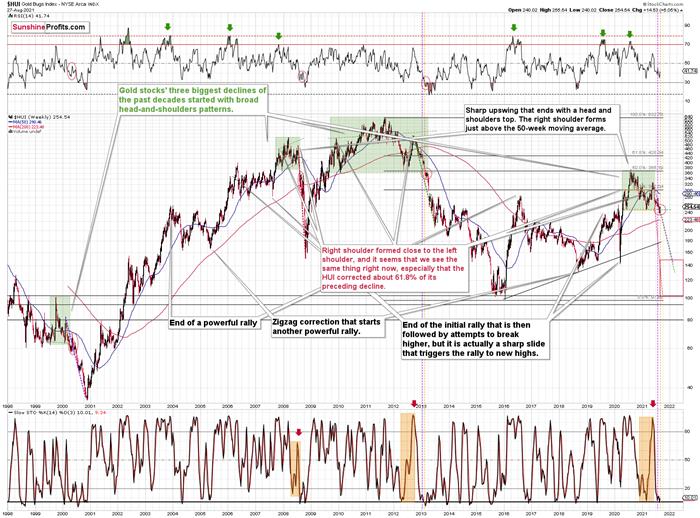
What’s more, the vertical, dashed linesabove demonstrate how the HUI Index is mirroring its decline from 2012-2013.After a slight buy signal from the stochastic indicator in 2012, the short-termpause was followed by another sharp drawdown. For context, after the HUI Indexrecorded a short-term buy signal in late 2012 – when the index’s stochastic indicator was already below the 20level (around 10) and the index was in the process of forming the rightshoulder of a huge, medium-term head-and-shoulders pattern – the index moved slightly higher, consolidated, and thenfell off a cliff. Thus, the HUI Index is quite likely to decline to its200-week moving average (or so) before pausing and recording a correctiveupswing. That’s close to the 220 level. Thereafter, the index will likelycontinue its bearish journey and record a final medium-term low some time inDecember.
Furthermore, I warned previously that theminers’ drastic underperformance of gold was an extremely bearish sign. Therewere several weeks when gold rallied visibly and the HUI Index actuallydeclined modestly. Last week, we finally saw gold miners moving back up alongwith gold. But just like one swallow doesn’t make a summer, this move updoesn’t change the fact, that in general, performance of gold stocks has beentruly terrible.
After all, gold stocks are trading closeto their previous 2021 lows, while gold is almost right in the middle betweenits yearly high and its yearly low.
And why is this quote so important? Well,because the bearish implications of gold stocks’ extreme underperformance stillremain intact.
Let’s keep in mind that the drasticunderperformance of the HUI Index also preceded the bloodbath in 2008 as wellas in 2012 and 2013. To explain, right before the huge slide in late Septemberand early October 2008, gold was still moving to new intraday highs; the HUIIndex was ignoring that, and then it declined despite gold’srally. However, it was also the case that the general stock market sufferedmaterially. If stocks didn’t decline so profoundly back then, gold stocks’underperformance relative to gold would have likely been present but moremoderate.
Nonetheless, broad head & shoulderspatterns have often been precursors to monumental collapses. For example, whenthe HUI Index retraced a bit more than 61.8% of its downswing in 2008 and inbetween 50% and 61.8% of its downswing in 2012 before eventually rolling over,in both (2008 and 2012) cases, the final top – the right shoulder – formedclose to the price where the left shoulder topped. And in early 2020, the leftshoulder topped at 303.02. Thus, three of the biggest declines in the goldmining stocks (I’m using the HUI Index as a proxy here) all started withbroad, multi-month head-and-shoulders patterns. And in all three cases, thesize of the declines exceeded the size of the head of the pattern. As areminder, the HUI Index recently completed the same formation.
Yes, the HUI Index moved back below theprevious lows and the neck level of the formation, which – at face value –means that the formation was invalidated, but we saw a similar “invalidation”in 2000 and in 2013. And then, the decline followed anyway. Consequently, I don’tthink that taking the recent move higher at its face value is appropriate. Itseems to me that the analogies to the very similar situation from the past aremore important.
As a result, we’re confronted with twobearish scenarios:If things develop as they didin 2000 and 2012-2013, gold stocks are likely to bottom close to theirearly-2020 low.If things develop like in 2008(which might be the case, given the extremely high participation of theinvestment public in the stock market and other markets), gold stocks could re-test (or break slightly below) their2016 low.
In both cases, the forecastfor silver, gold, and mining stocks is extremely bearish for the nextseveral months.
GDXand GDXJ Comparison
For even more confirmation, let’s comparethe behavior of the GDX ETF and the GDXJ ETF. Regarding the former, the seniorminers (GDX) also rallied above the neckline of their bearish H&S pattern.And while Friday’s (Aug. 27) euphoria occurred on high volume, prior volume spikes in buying sentiment actually marked four peaks (or close to)within the last 12 months. Thus, while the bullish bids may push the GDXETF slightly higher in the near term, history implies that investors’excitement often does more harm than good.
Please see below: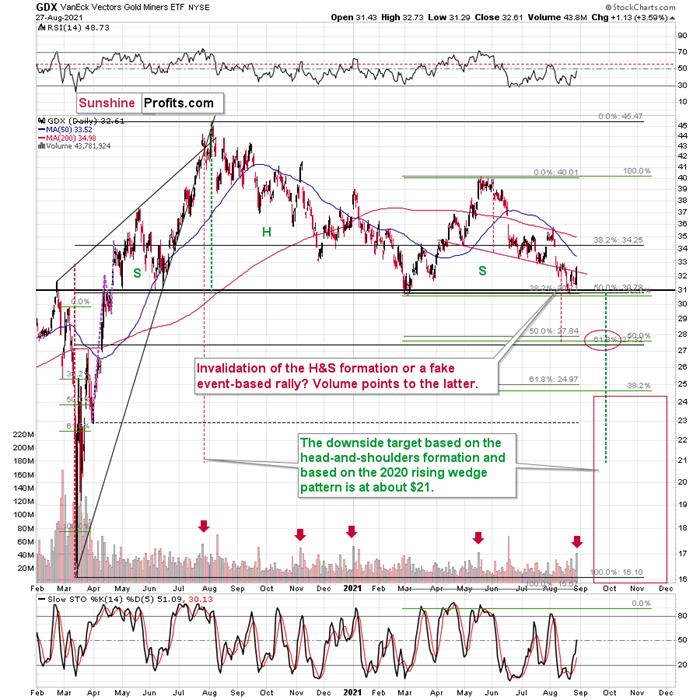
In all 4 out of previous 4 cases, thespike-high volume during GDX’s upswing meant a great shorting opportunity.
Meanwhile, the juniorminers (GDXJ) didn’t invalidate the breakdown below the neckline of theirbearish H&Spattern; and Friday’s close still left the GDXJ ETF below its previouslows. Moreover, while the juniors’ future direction following volume spikesisn’t quite as clear as it is with the GDX ETF, more often than not, euphoricspikes are followed by medium-term declines.
Please see below: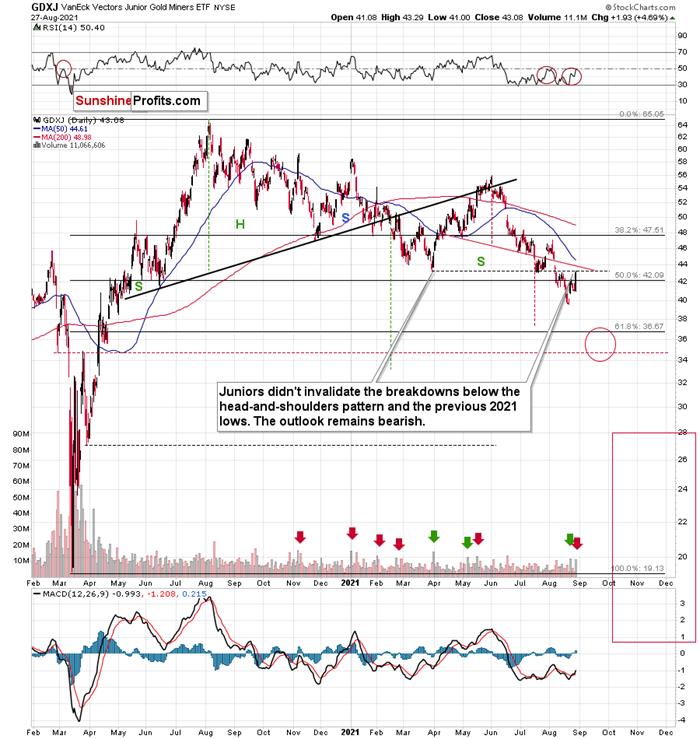
As further evidence, if you analyze theGDXJ ETF’s four-hour chart below, you can see that historical volume spikes(marked by the red vertical dashed lines) nearly always coincide withshort-term peaks. As a result, Friday’s rally was more of an event driven surge– courtesy of Powell – and it’s unlikely to disrupt the GDXJ ETF’s medium-termdowntrend.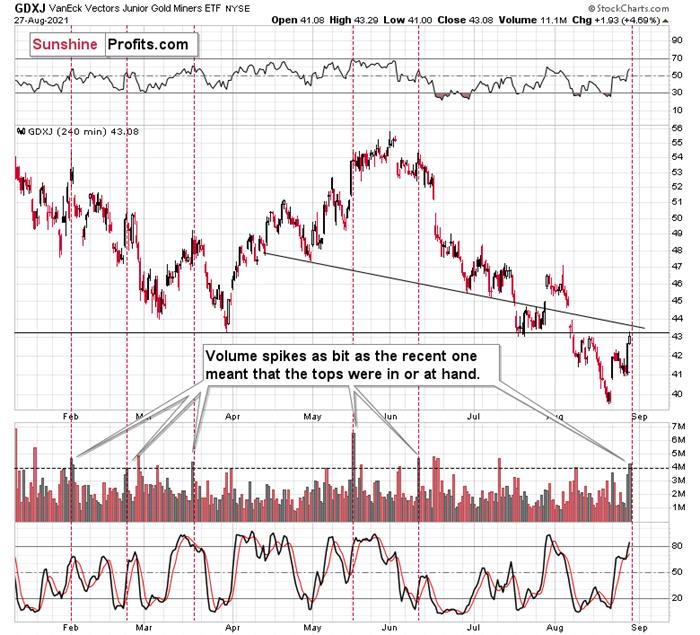
Finally, while the GDXJ/GDX ratio movedslightly higher last week, its downtrend also remains intact. For one, when theratio’s RSI jumped above 50 three times in 2021, it coincided with short-term peaks ingold. Second, the trend in the ratio this year has been clearly down, andthere’s no sign of a reversal, especially when you consider that the ratiobroke below its 2019 support (which served as resistance in mid-2020). When thesame thing happened in 2020, the ratio then spiked even below 1.
Please see below: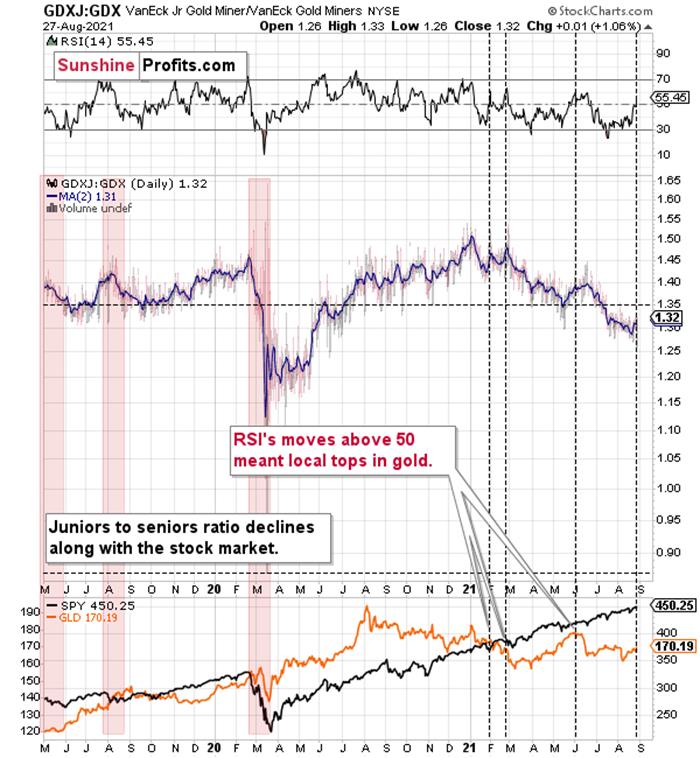
TheBottom Line?
If the ratio is likely to continue itsdecline, then on a short-term basis we can expect it to decline to 1.27 or so.If the general stock market plunges, the ratio could move even lower, but let’sassume that stocks decline moderately (just as they did in the last couple ofdays) or that they do nothing or rally slightly. They’ve done all the aboverecently, so it’s natural to expect that this will be the case. Consequently,the trend in the GDXJ to GDX ratio would also be likely to continue, and thusexpecting a move to about 1.26 - 1.27 seems rational.
If the GDX is about to decline toapproximately $28 before correcting, then we might expect the GDXJ to declineto about $28 x 1.27 = $35.56 or $28 x 1.26 = $35.28. In other words, $28 in theGDX is likely to correspond to about $35 in the GDXJ.
Is there any technical support around $35that would be likely to stop the decline? Yes. It’s provided by the late-Feb.2020 low ($34.70) and the late-March high ($34.84). There’s also the late-Aprillow at $35.63. Conservatively, I’m going to place the profit-take level justabove the latter.
Consequently, it seems that expecting theGDXJ to decline to about $35 is justified from the technical point of view aswell.
In conclusion, investors showcased theirsweet tooth for gold, silver, and mining stocks on Aug. 27. However, with theUSD Index hovering near two key support levels and the yellow metal confrontingits second triangle-vertex-based reversal point, the taste may turn bitter overthe medium term. Moreover, with prior upswings underwritten by the Fed resultingin lower lows soon after, the precious metals’ bullish behavior is nothing new.As a result, their prior weakness will likely persist before reliable bottomsemerge later this year.
Thank you for reading our free analysistoday. Please note that the above is just a small fraction of today’sall-encompassing Gold & Silver Trading Alert. The latter includes multiplepremium details such as the targets for gold and mining stocks that could be reached in the next few weeks. If you’dlike to read those premium details, we have good news for you. As soon as yousign up for our free gold newsletter, you’ll get a free 7-day no-obligationtrial access to our premium Gold & Silver Trading Alerts. It’s really free– sign up today.
Thank you.
Przemyslaw Radomski, CFA
Founder, Editor-in-chief
Toolsfor Effective Gold & Silver Investments - SunshineProfits.com
Tools für EffektivesGold- und Silber-Investment - SunshineProfits.DE
* * * * *
About Sunshine Profits
SunshineProfits enables anyone to forecast market changes with a level of accuracy thatwas once only available to closed-door institutions. It provides free trialaccess to its best investment tools (including lists of best gold stocks and best silver stocks),proprietary gold & silver indicators, buy & sell signals, weekly newsletter, and more. Seeing is believing.
Disclaimer
All essays, research and information found aboverepresent analyses and opinions of Przemyslaw Radomski, CFA and SunshineProfits' associates only. As such, it may prove wrong and be a subject tochange without notice. Opinions and analyses were based on data available toauthors of respective essays at the time of writing. Although the informationprovided above is based on careful research and sources that are believed to beaccurate, Przemyslaw Radomski, CFA and his associates do not guarantee theaccuracy or thoroughness of the data or information reported. The opinionspublished above are neither an offer nor a recommendation to purchase or sell anysecurities. Mr. Radomski is not a Registered Securities Advisor. By readingPrzemyslaw Radomski's, CFA reports you fully agree that he will not be heldresponsible or liable for any decisions you make regarding any informationprovided in these reports. Investing, trading and speculation in any financialmarkets may involve high risk of loss. Przemyslaw Radomski, CFA, SunshineProfits' employees and affiliates as well as members of their families may havea short or long position in any securities, including those mentioned in any ofthe reports or essays, and may make additional purchases and/or sales of thosesecurities without notice.
Przemyslaw Radomski Archive |
© 2005-2019 http://www.MarketOracle.co.uk - The Market Oracle is a FREE Daily Financial Markets Analysis & Forecasting online publication.