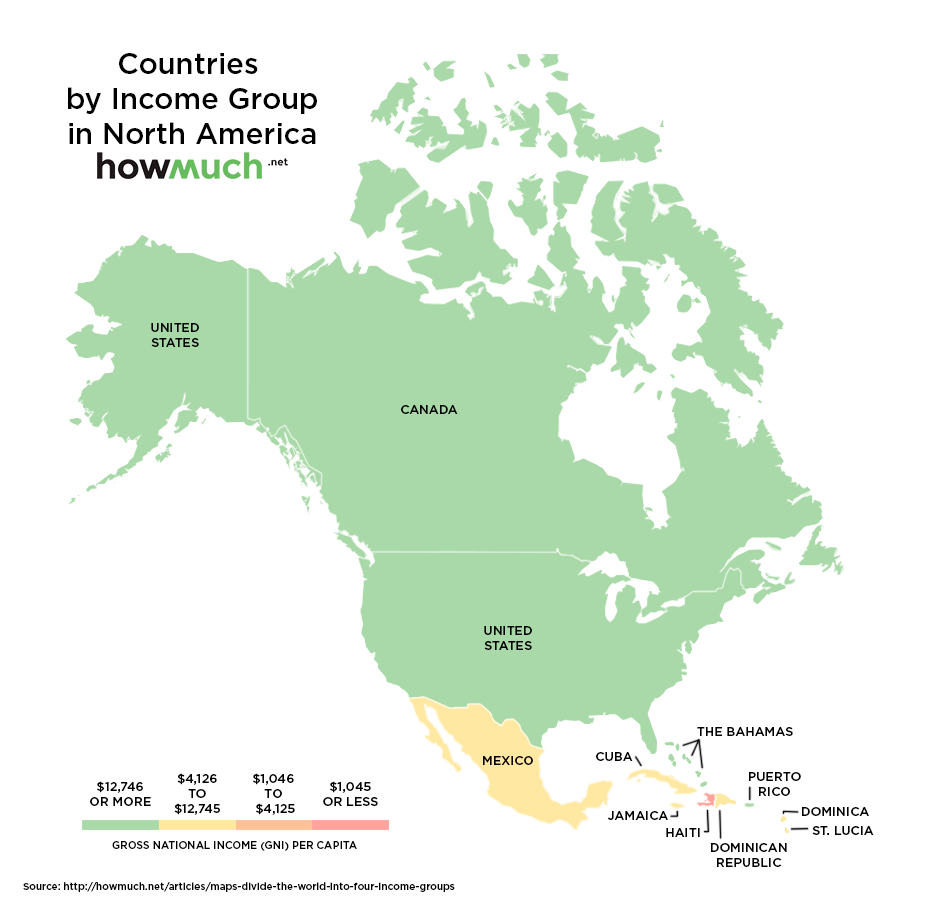
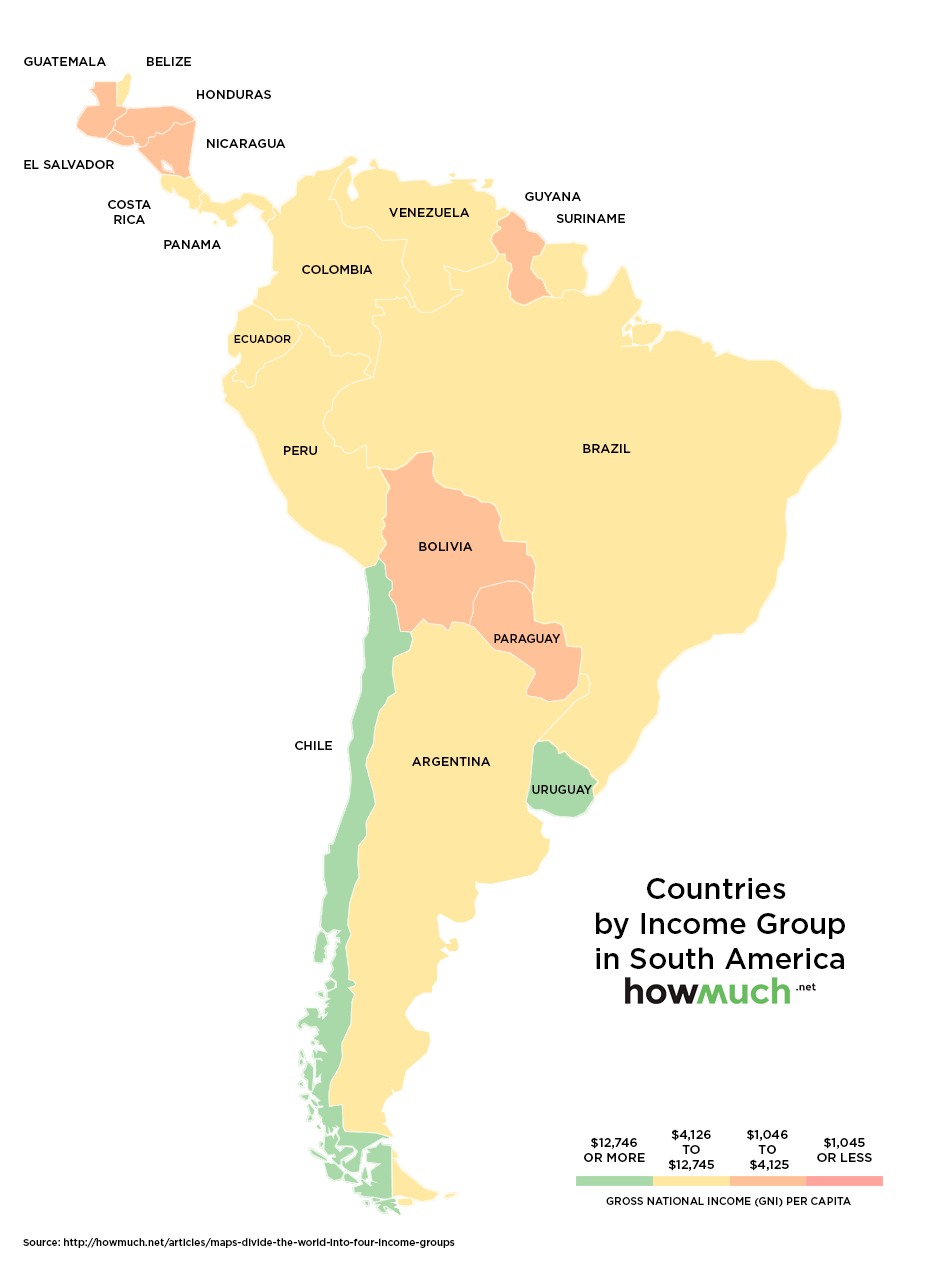
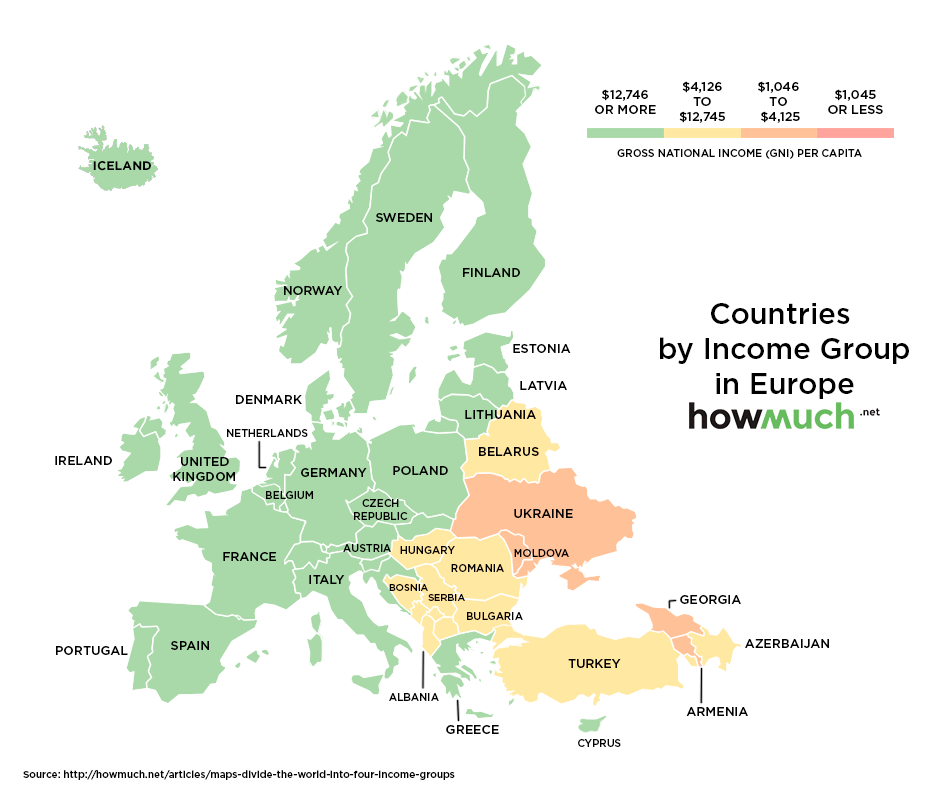
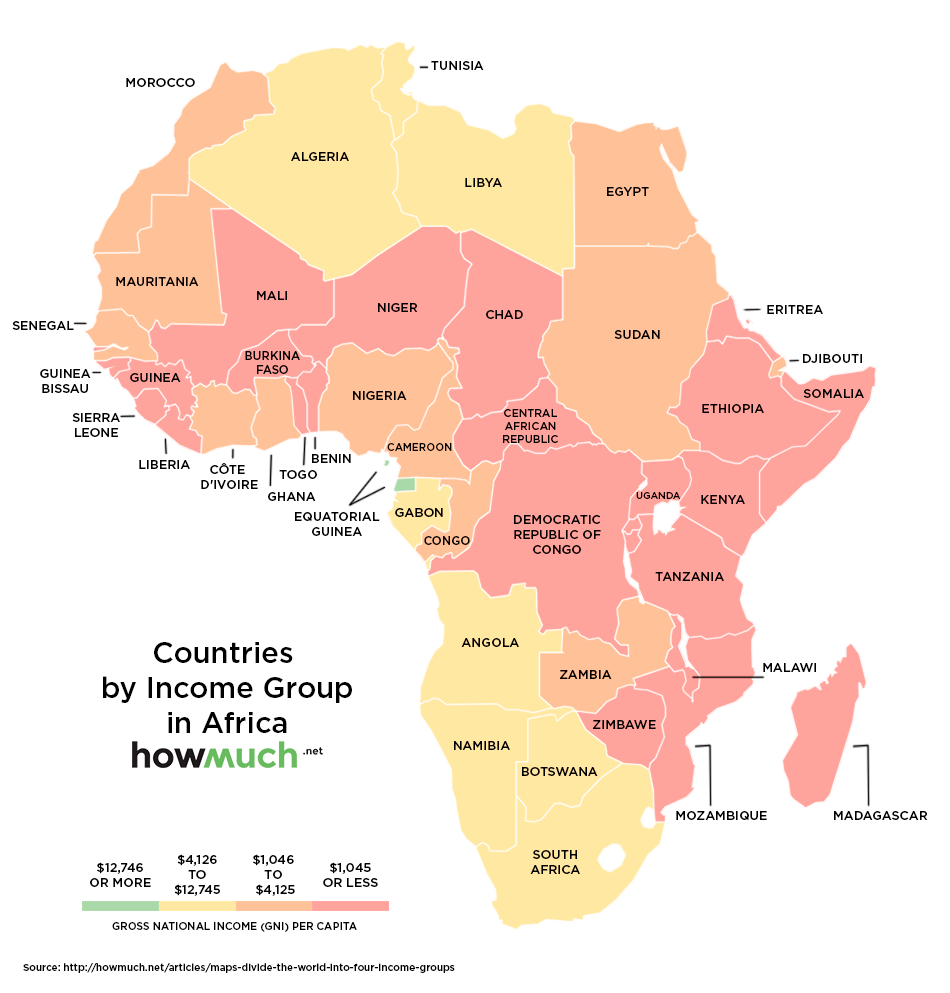
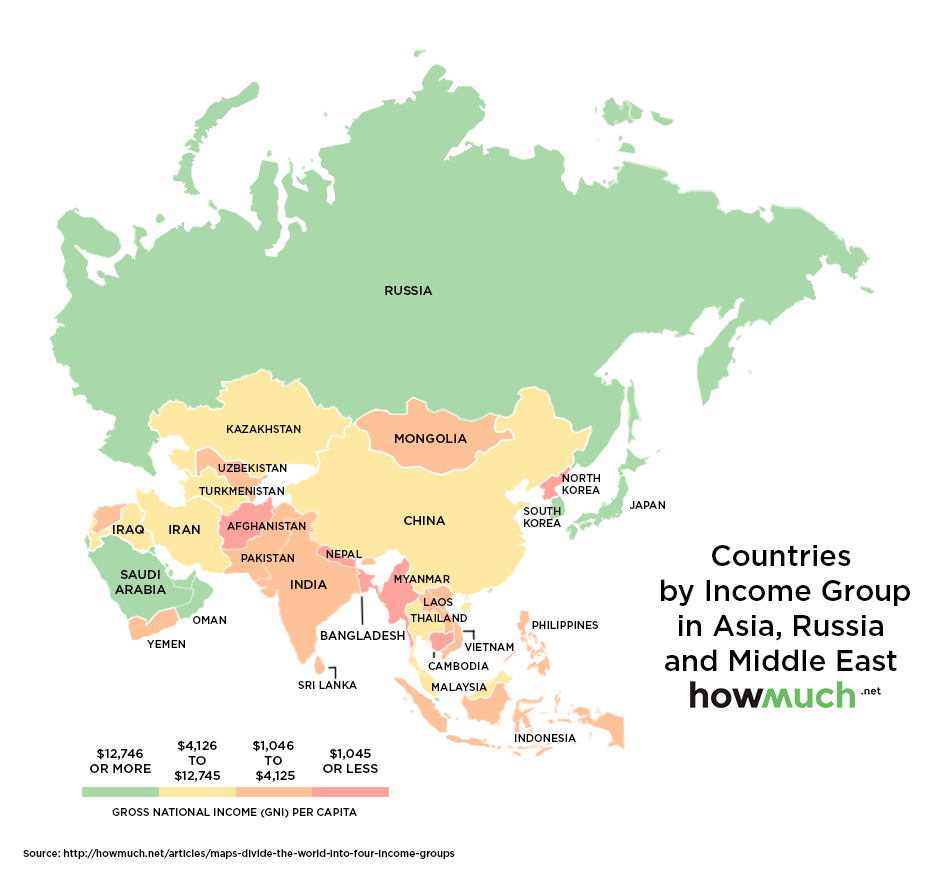
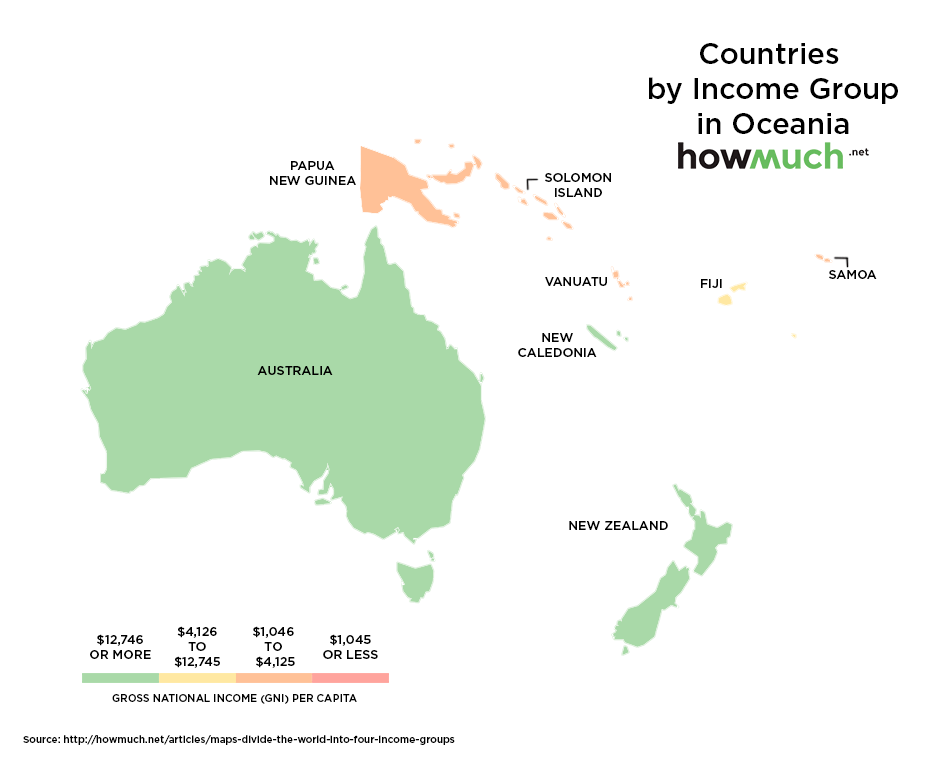
The richest and poorest countries in the world
The world economy is complex, but today's series of maps will allow you to simplify your understanding of the relative wealth of people around the globe.
Global Finance Magazine recently collated data from the World Bank on Gross National Income (GNI) per capita for 204 countries.
Each country was placed in one of four groups:
Low income: $1,045 or lessLower-middle income: $1,046 to $4,125Upper-middle income: $4,126 to $12,745High income: $12,746 or more
The good people at HowMuch.net, a cost information site, helped to transform this information on the richest and poorest countries into the following visuals:
![]()
![]()
![]()
![]()
![]()
![]()
Based on the data of 204 countries, below is a breakdown of the number of countries that fall within each of the four income groups listed above.
Low income: 17%Lower-middle income: 25%Upper-middle income: 26%High income: 32%As a side note, the World Bank has recently revised the poverty line to US$1.90 per day using 2011 PPP, which is equal to an income of $693.50 per year. This was mainly due to rising food prices.