Gold Is Likely To Go Down
The debt ceiling has increased the use of gold as a tier 1 asset, but as soon as the ceiling is lifted, gold will drop.
The similar patterns that are replicating, support our view that gold will drop in the next couple of months.
Gold is technically overbought and, therefore likely to weaken in price.
Last week, we wrote to our subscribers:
We conclude that it is probable that gold is forming a local top and that at best, gold will be in a trading-range below $1440 for the next several weeks.
One week later, we continue with the same conclusion. In this article, we present the reasons for our thinking.
Gold And Silver
The correlation between gold and silver is normally strongly positive; however, in 2012 and again in 2018, the correlation dropped suddenly before recovering. Both gold and silver seem to be replicating the pricing pattern that formed during the 2012-2016 period (chart below)
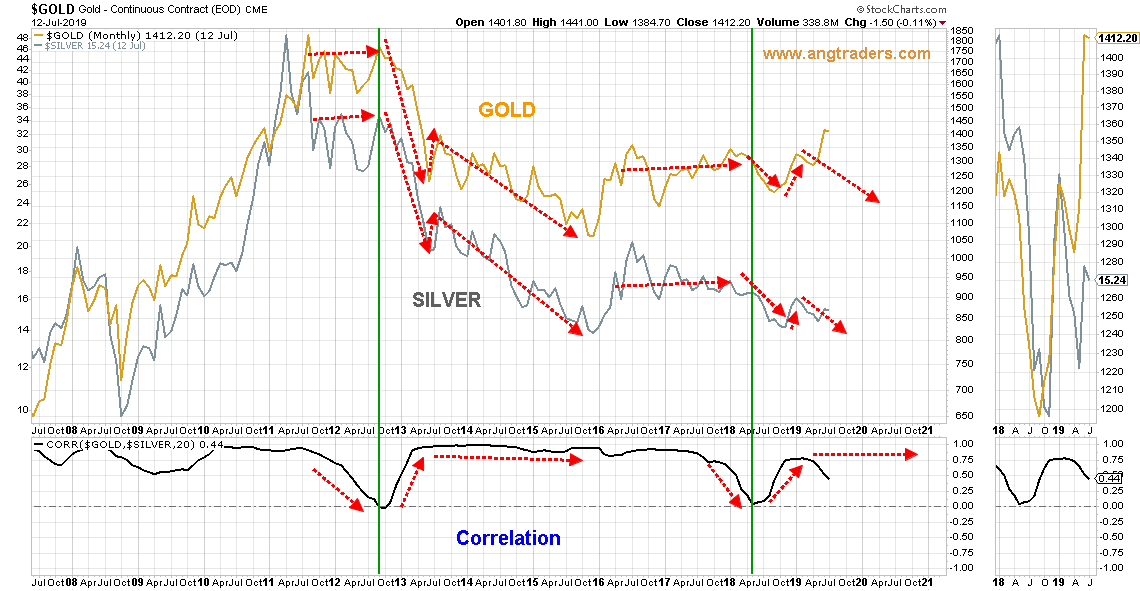
Source: ANG Traders, stockcharts
These patterns continue to replicate, and we expect both gold and silver to drop in price over the next several months.
Gold And Copper
There are similar patterns developing, in both the price and in the various momentum indicators of copper and gold, as during the 2014-2016 trading period (chart below).
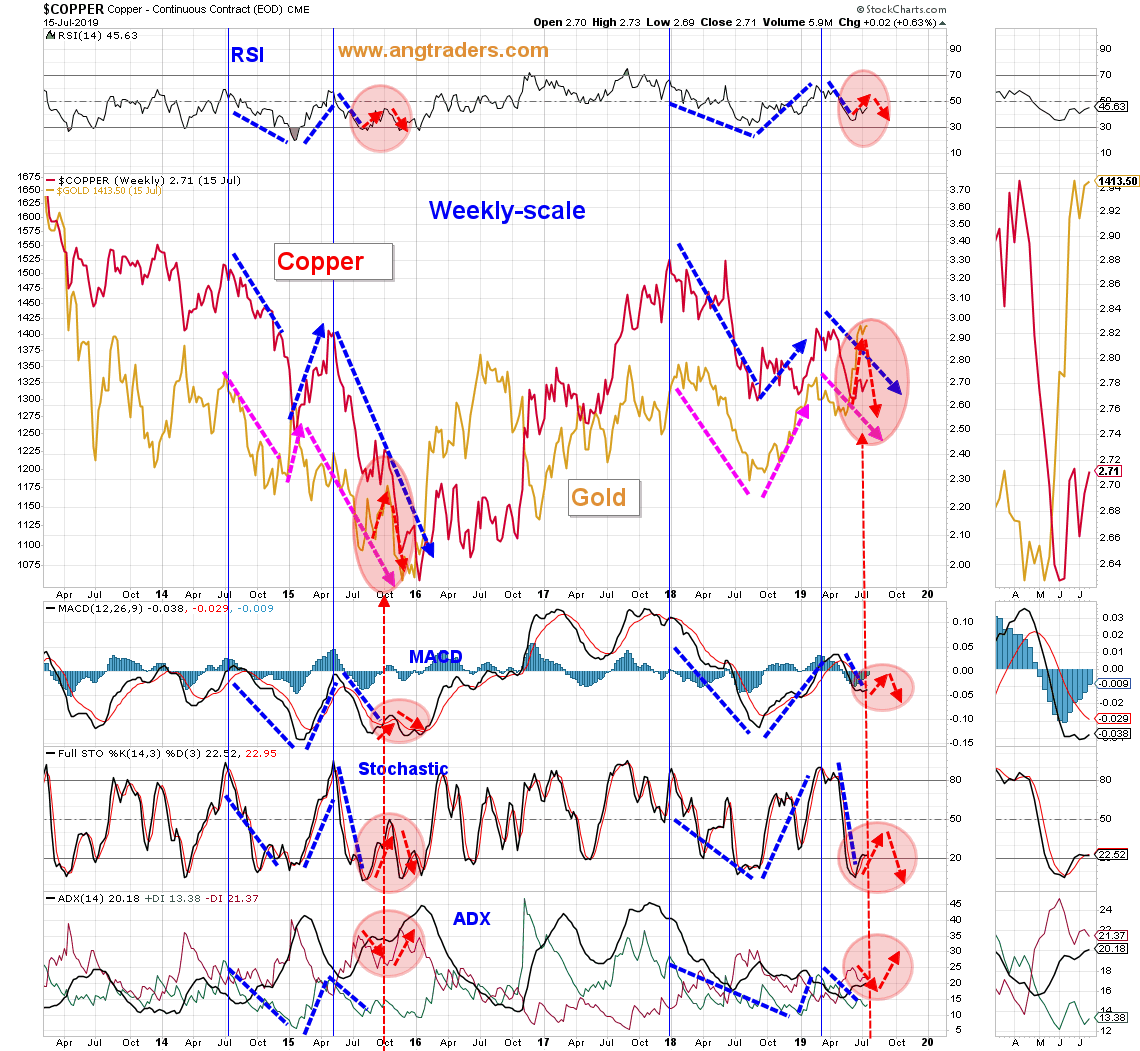 Source: ANG Traders, stockcharts
These patterns have been replicating since the start of 2018, which makes us expect the price of gold to continue dropping over the next several months.
Debt Ceiling Crisis, 2013-2014, And 2019
From Wikipedia:
Members of the Republican Party in Congress opposed raising the debt ceiling, which had been routinely raised previously on a bipartisan basis without conditions, without additional spending cuts. They refused to raise the debt ceiling unless President Obama would have defunded the Affordable Care Act (Obamacare), his signature legislative achievement.[1] The US Treasury began taking extraordinary measures to enable payments, and stated that it would delay payments if funds could not be raised through extraordinary measures, and the debt ceiling was not raised. During the crisis, approval ratings for the Republican Party declined.[1] The crisis ended on October 17, 2013 with the passing of the Continuing Appropriations Act, 2014, although debate continues about the appropriate level of government spending, and the use of the debt ceiling in such negotiations.
The debt ceiling stops the Treasury Department from issuing new Treasury securities - only enough to cover redemptions. This causes a bottleneck for the banks that need to add tier 1 assets to their reserves as they increase their lending. This bottleneck in Treasuries has had two consequences: A decrease in the yield on bonds in the secondary market, and a bidding up of gold since it is an alternative to Treasuries as a tier 1 asset.
The debt ceiling must be lifted soon because the extraordinary measures that the Treasury is implementing in order to continue operating, are almost exhausted. Here is Mnuchin with his latest plea to Congress:
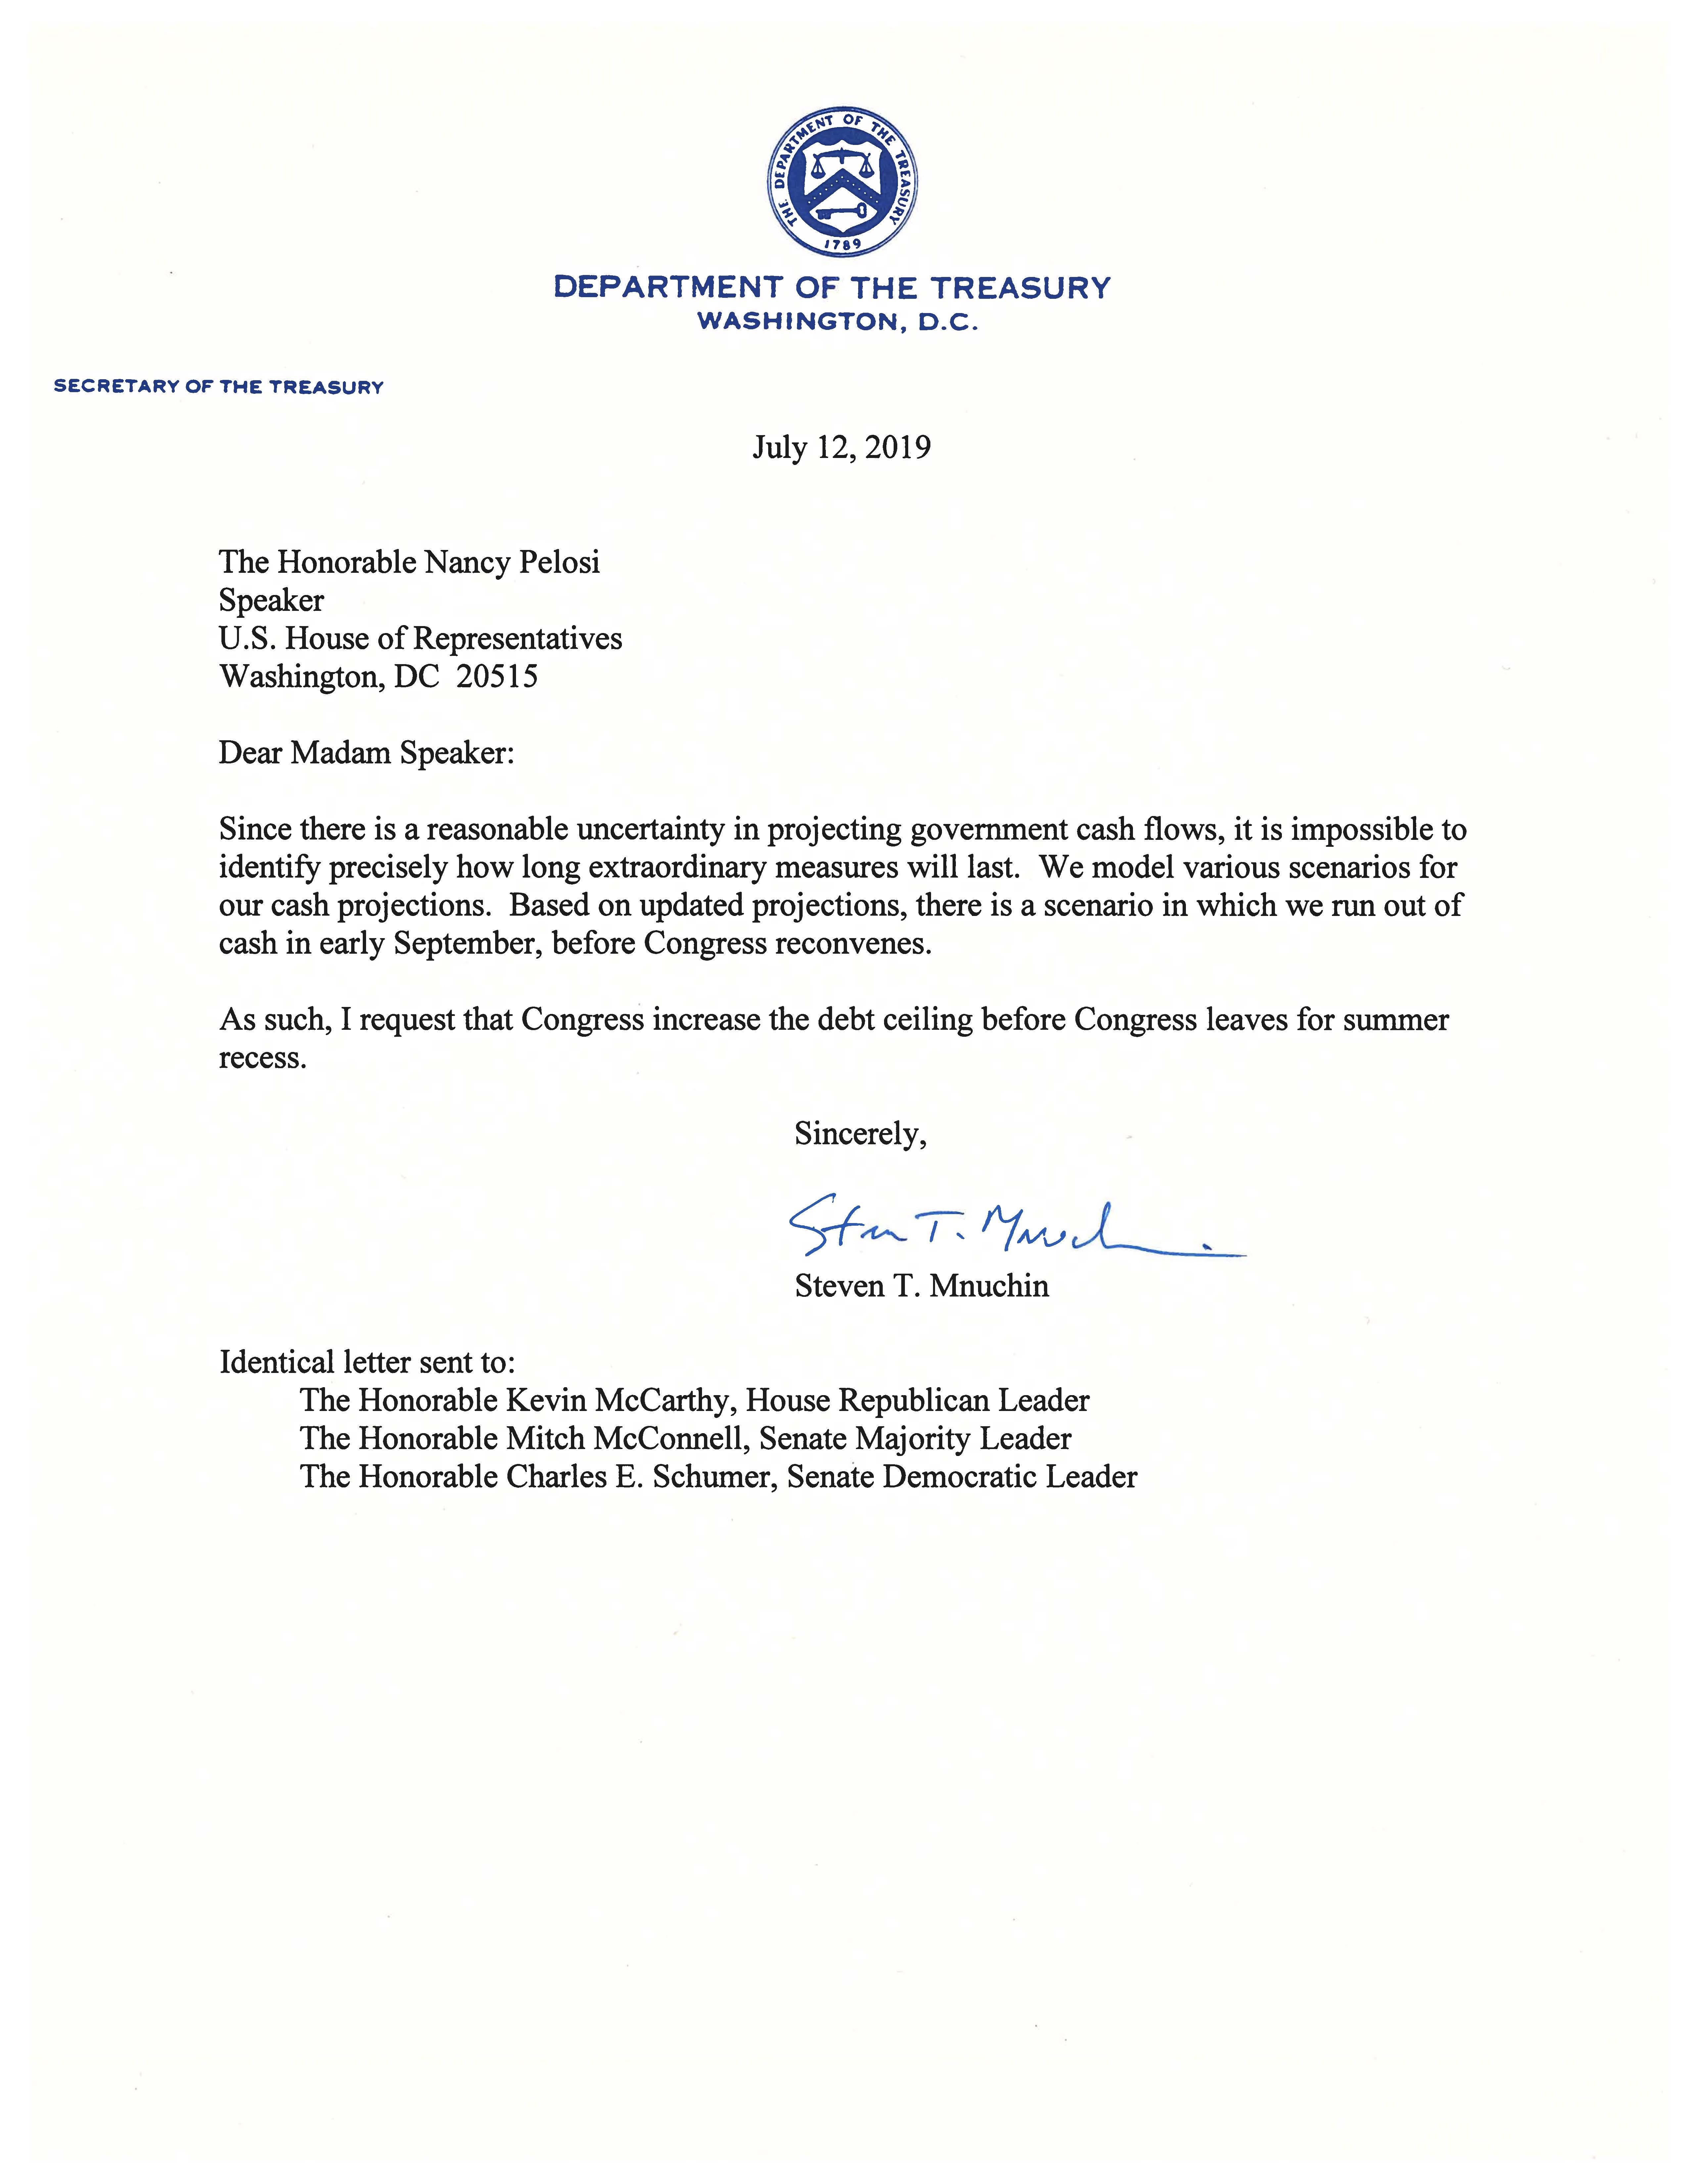 Source: Treasury.gov
Once the debt ceiling is raised, new Treasury securities can be issued, and the need to use gold as a tier 1 asset disappears. The latter fact, will cause the price of gold to crash.
Today we have the same story with the same actors as we had in 2013-14, so it isn't surprising to have similar price patterns in gold.
In 2013, the 20-week MA crossed under the 200-week MA unleashing a zig-zagging, downward-sloping price pattern in gold that has been replicating since the middle of 2018 when the moving averages once again crossed over. We are close to the point when the debt ceiling is raised and the gold price drops like it did in 2014 (chart below).
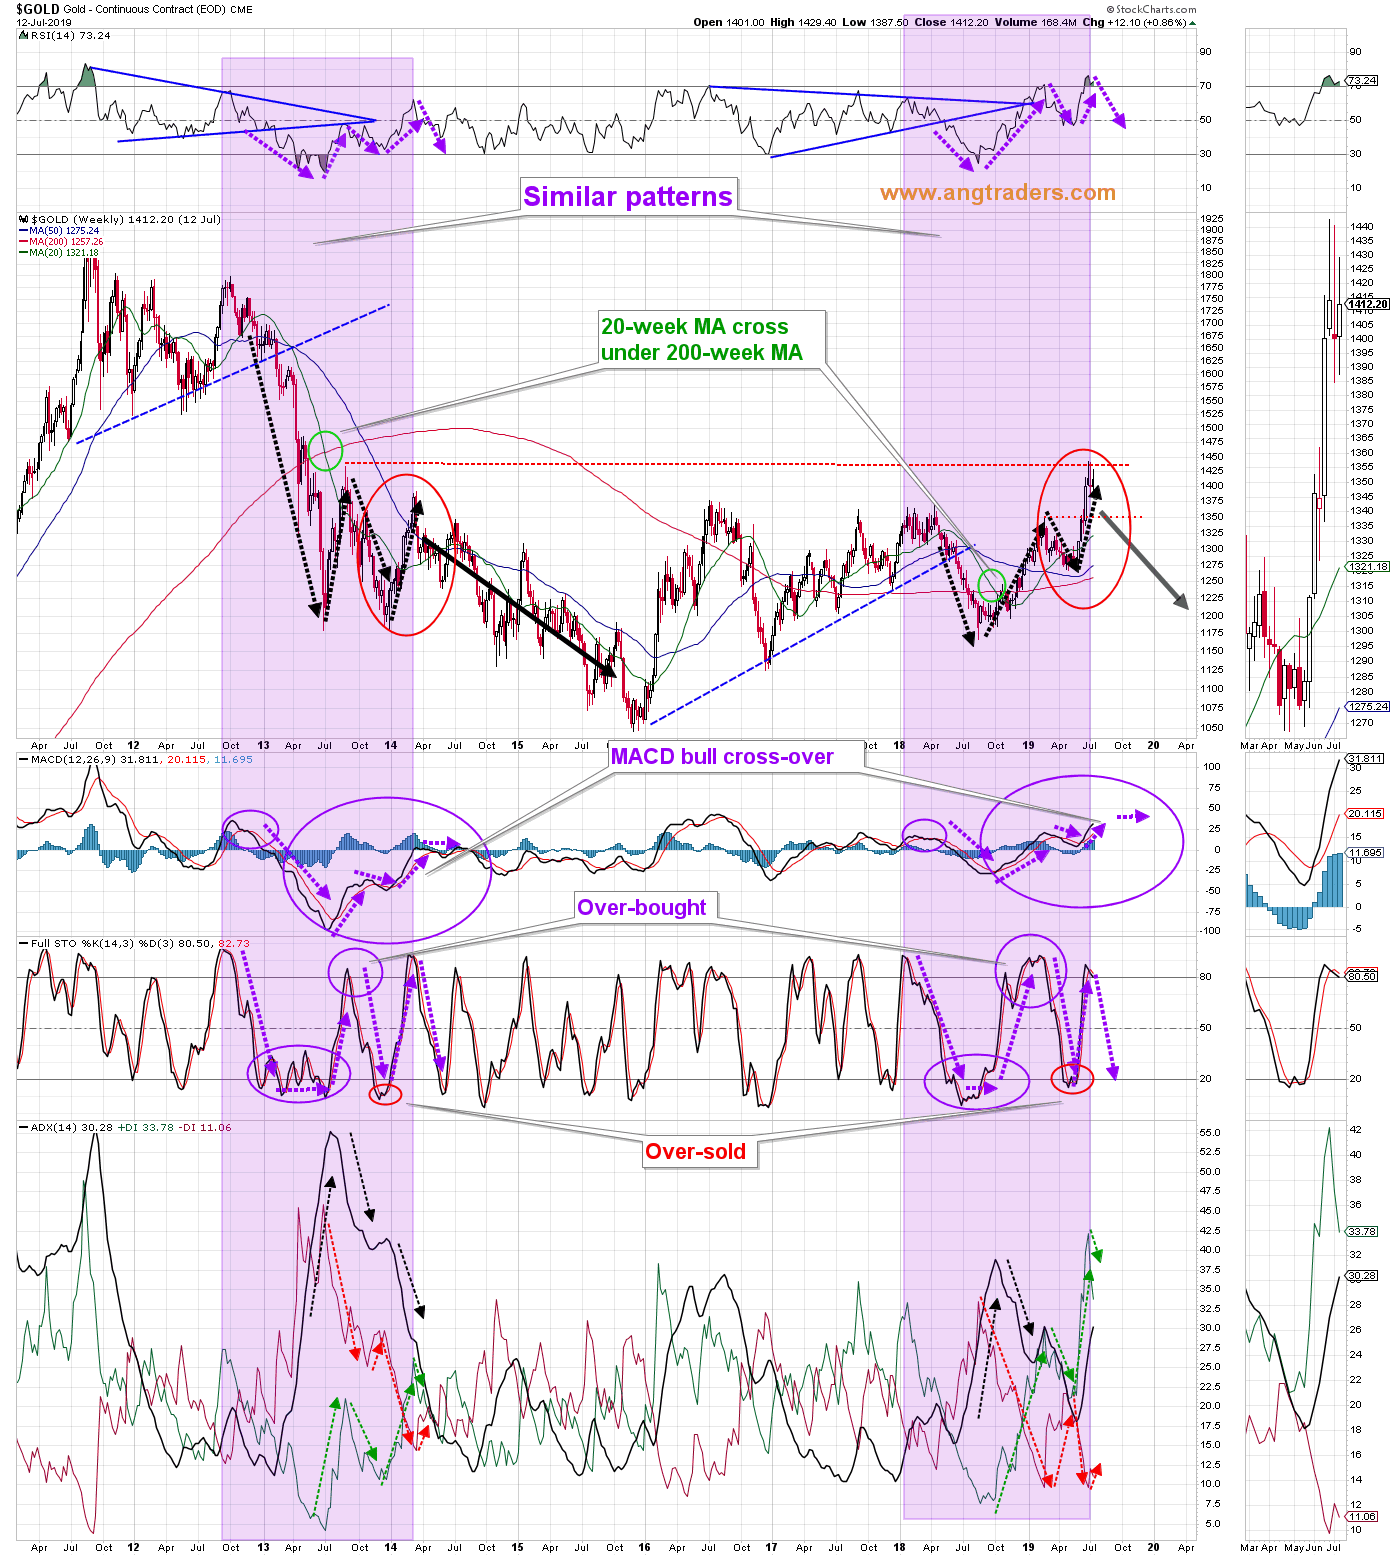 Source: ANG Traders, stockcharts
The Technical Take
Gold continues to be technically overstretched:
RSI is decreasing from a high overbought level (85). MACD has made a bear crossover. Stochastic is decreasing away from overbought levels. +DI is decreasing along with its momentum.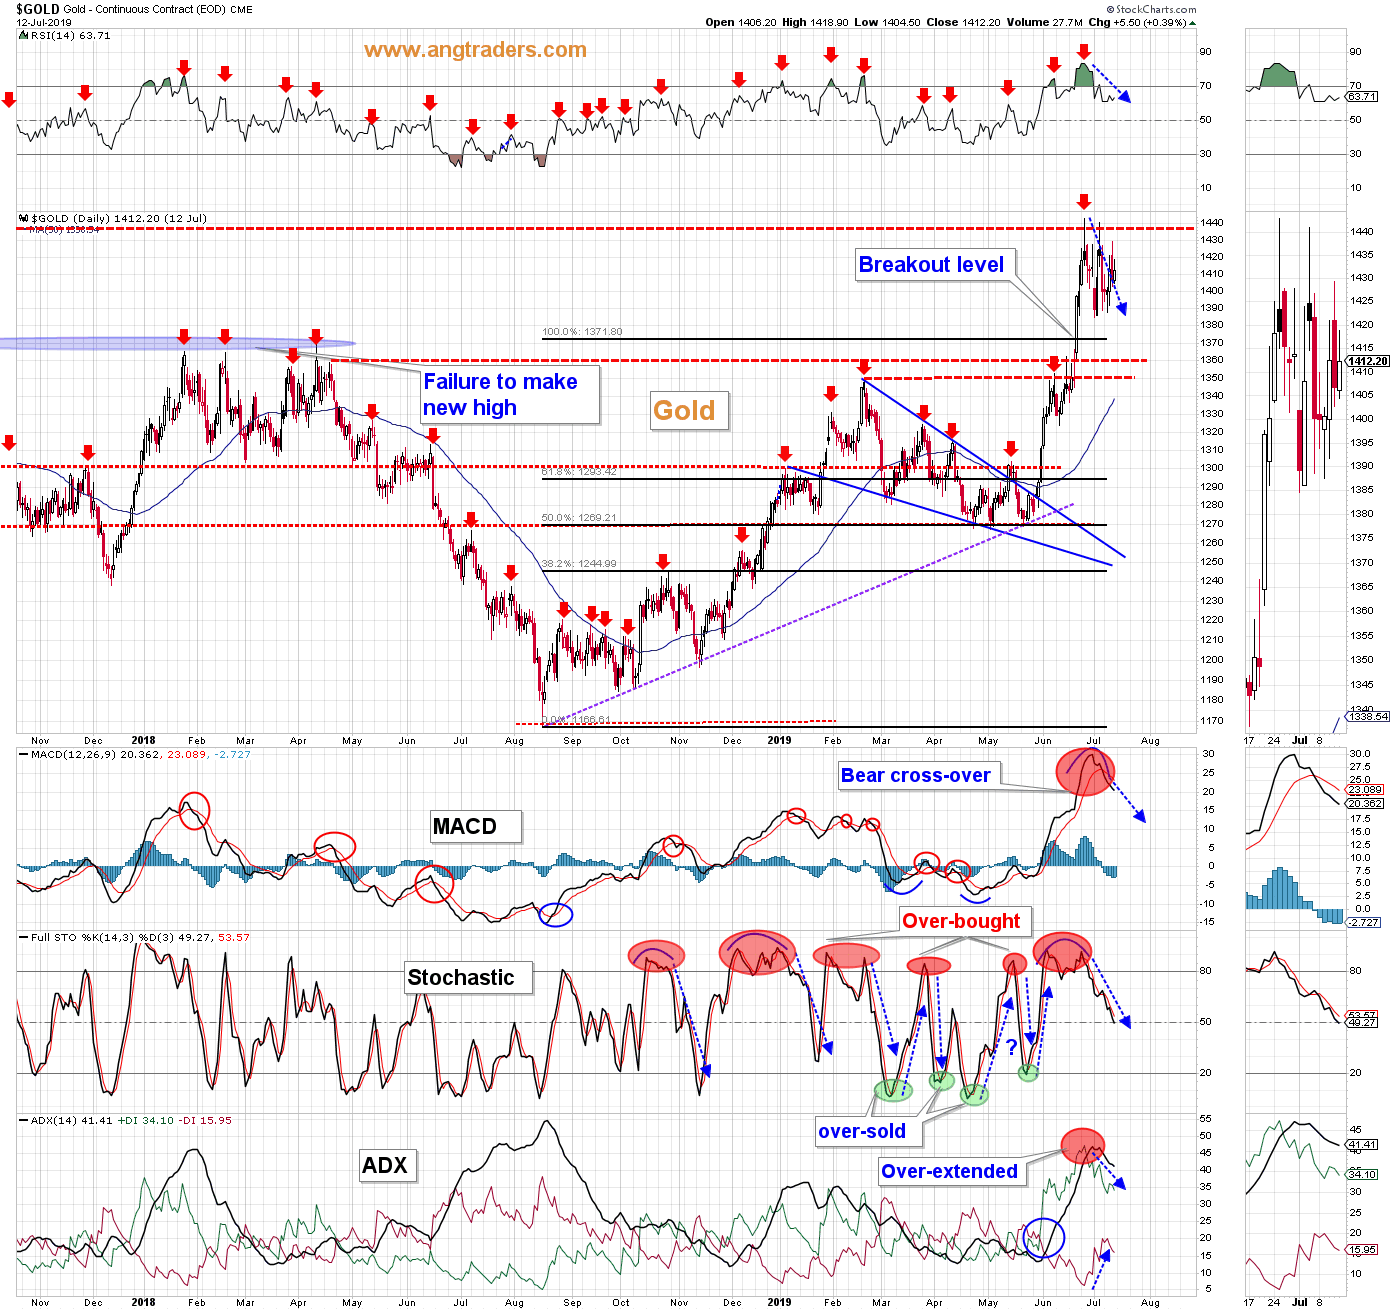 Source: ANG Traders, stockcharts
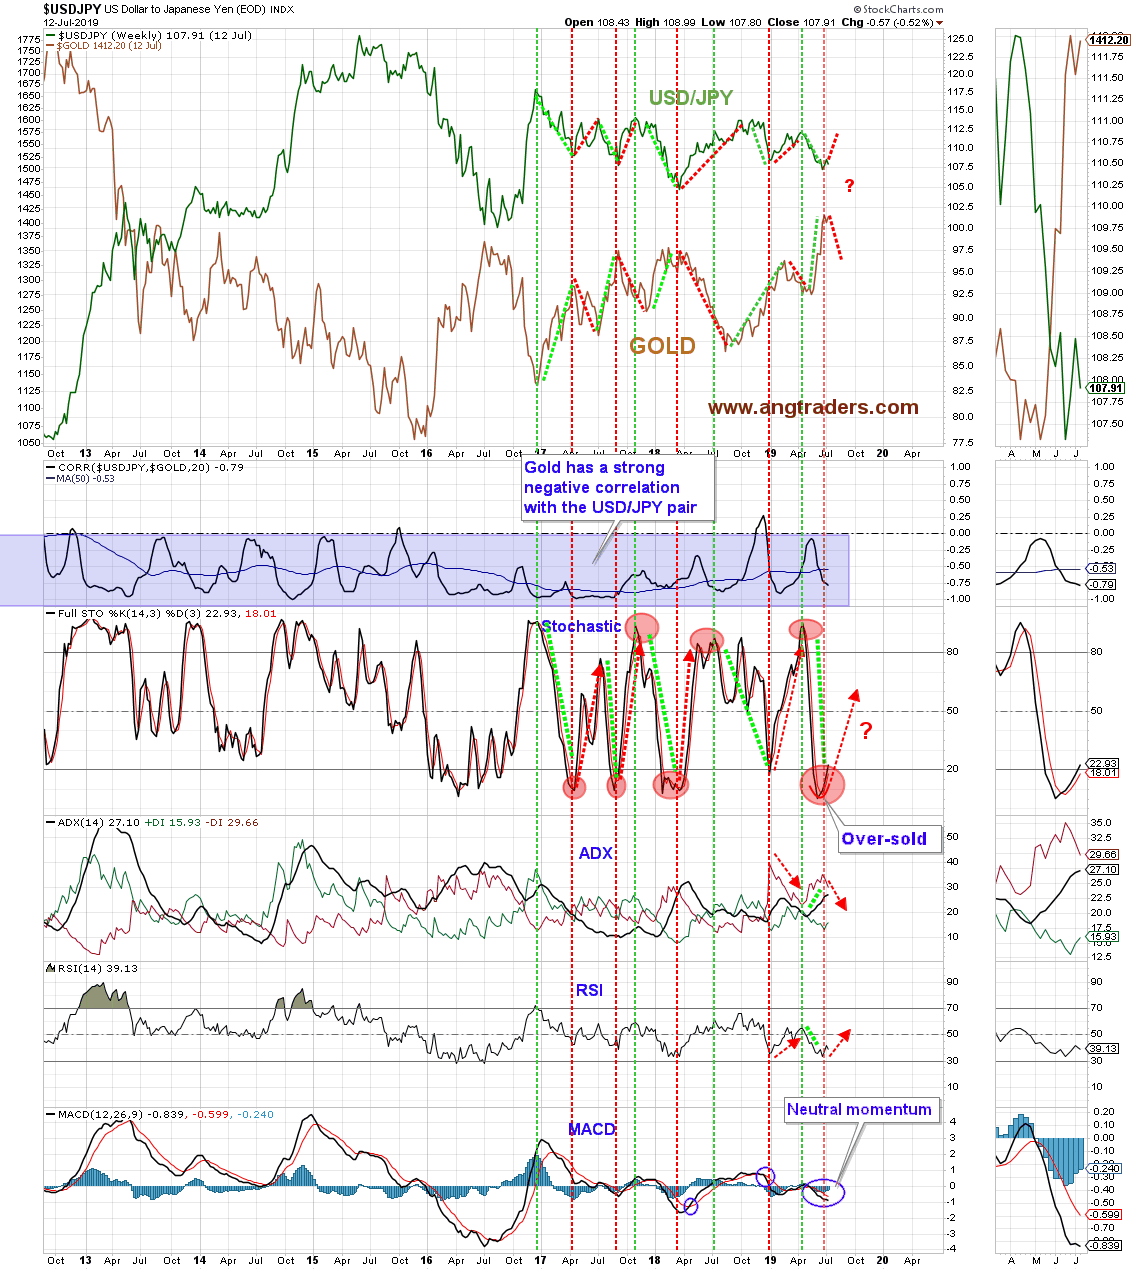
USD/JPY
The USD/JPY FOREX pair correlates inversely with gold. Technically, the pair is primed to rally, which means gold should fall (chart below).
 Source: ANG Traders, stockcharts
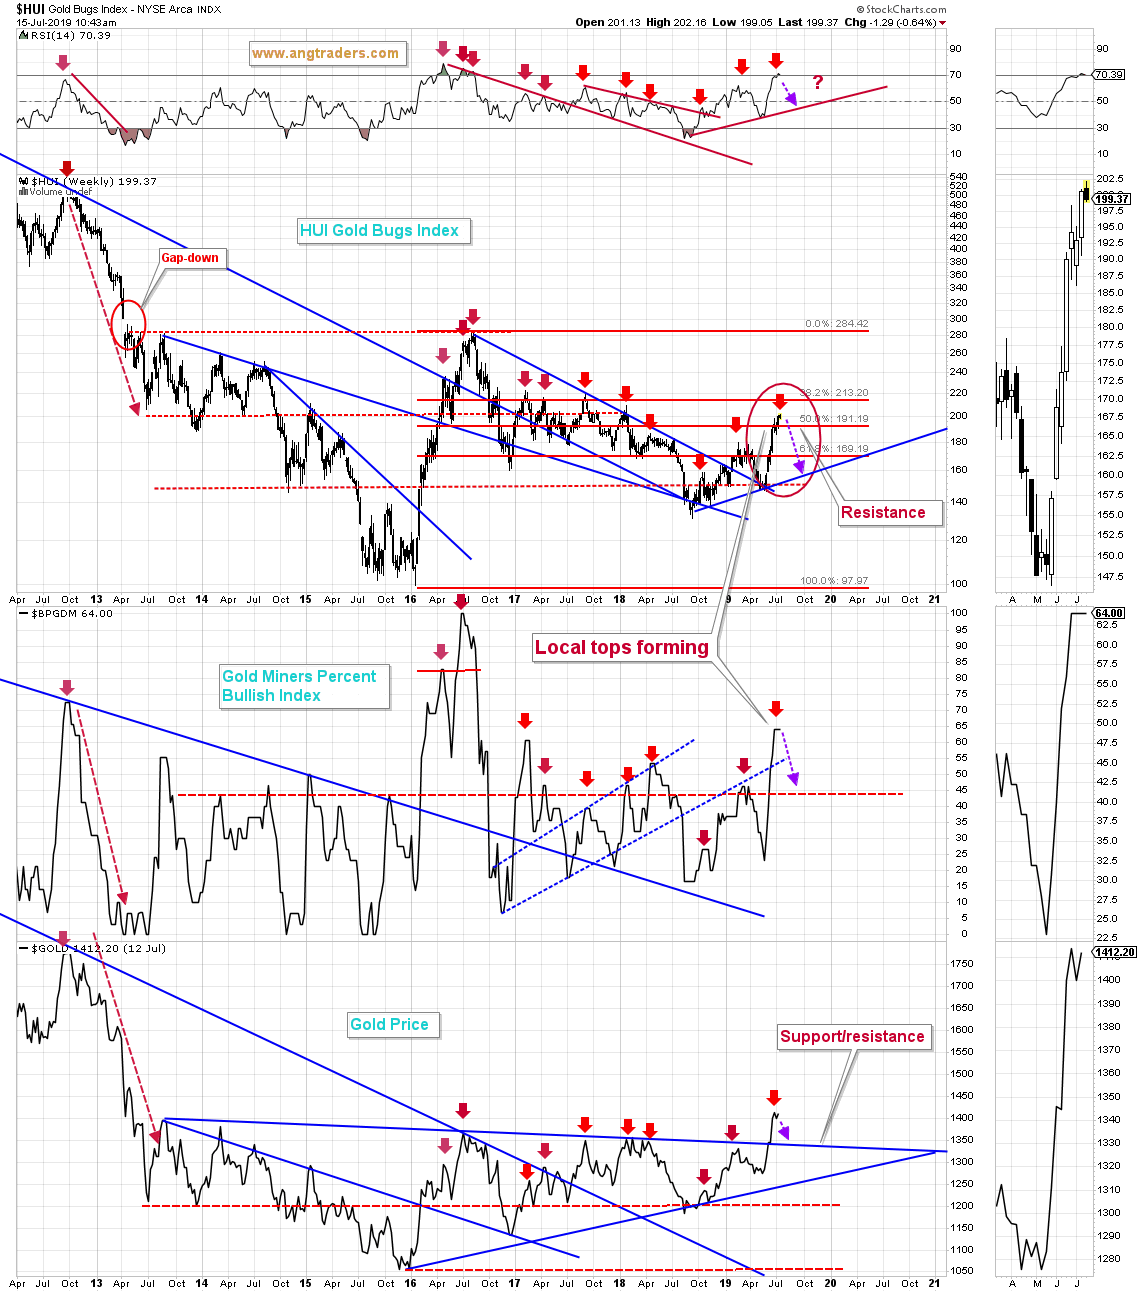
Gold Equity Indexes
The HUI Gold Bugs Index and the Gold Miners Percent Bullish Index are forming local tops, as is gold (red pointers on chart below).
 Source: ANG Traders, stockcharts
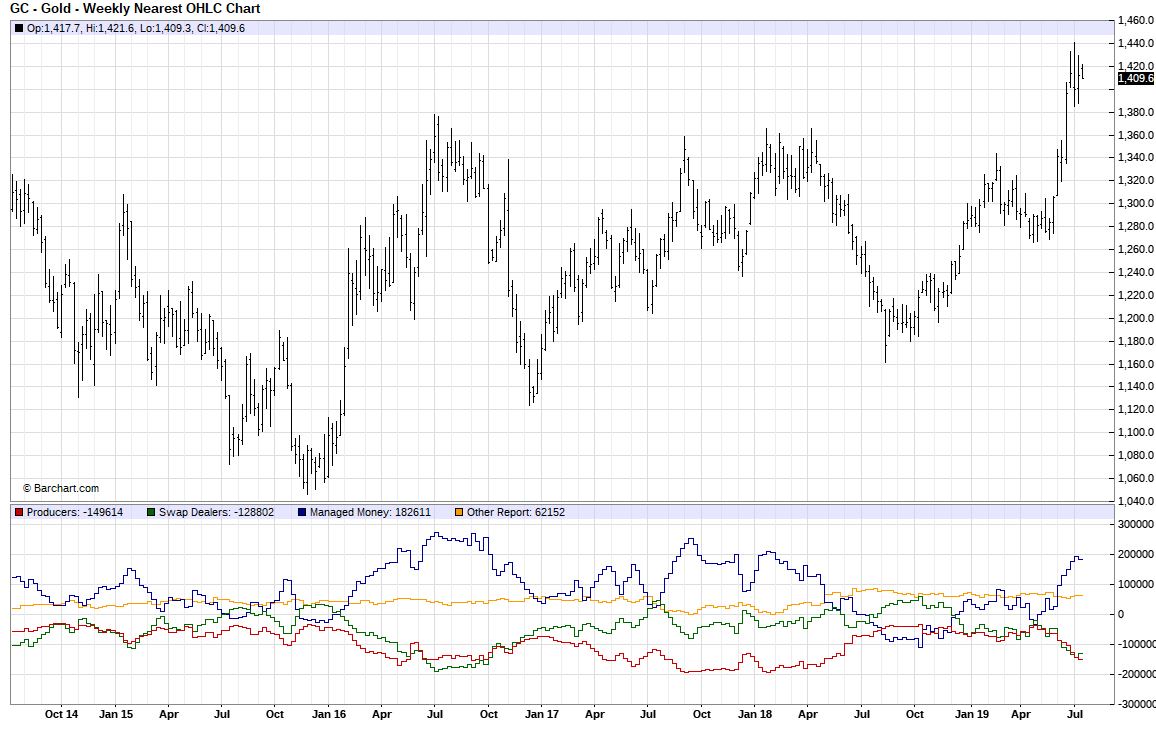
Commitments Of Traders
The chart below, shows the commitments of gold futures traders for the August contract. Notice that the "managed money" (blue line) are consistently maximally long when the gold price reaches a high, and minimally long or even short when the gold price bottoms out. This class of futures trader is a good contrarian indicator. At the moment, they are long 182k contracts, which means the upside for gold is probably limited (chart below).
Source: barchart.com
We continue to expect gold to either go sideways or decrease until the debt ceiling is raised, after which, gold should pull back substantially.
During the 2018 correction, our analysis showed that we were not at the start of a new bear market and that the bull market was not in the process of ending. As a result, our subscribers avoided the herd mentality of panicked-selling and the losses it created.
"Happy ANG subscriber here. I believe them to be the best broad market analysts on seeking alpha."
"... paid for the service on first trade."
"Best here in seeking alpha...@ANG Traders . Best of the best!"
Take advantage of our 14-day free trial and stay on the right side of the market and Away From the Herd.
Disclosure: I/we have no positions in any stocks mentioned, and no plans to initiate any positions within the next 72 hours. I wrote this article myself, and it expresses my own opinions. I am not receiving compensation for it (other than from Seeking Alpha). I have no business relationship with any company whose stock is mentioned in this article.
Follow ANG Traders and get email alerts