Gold Bulls- Gotta Love this pattern says Joe Friday!
In 2011 the Power of the Patttern suggested that Gold could be flat to down for years to come. See post HERE Since that post in 2011, Gold finds itself down around 30% and Silver is down over 65%.
2011 saw extremes in prices. After nearly 7-years of lower prices, could the trend in metals be about to change?
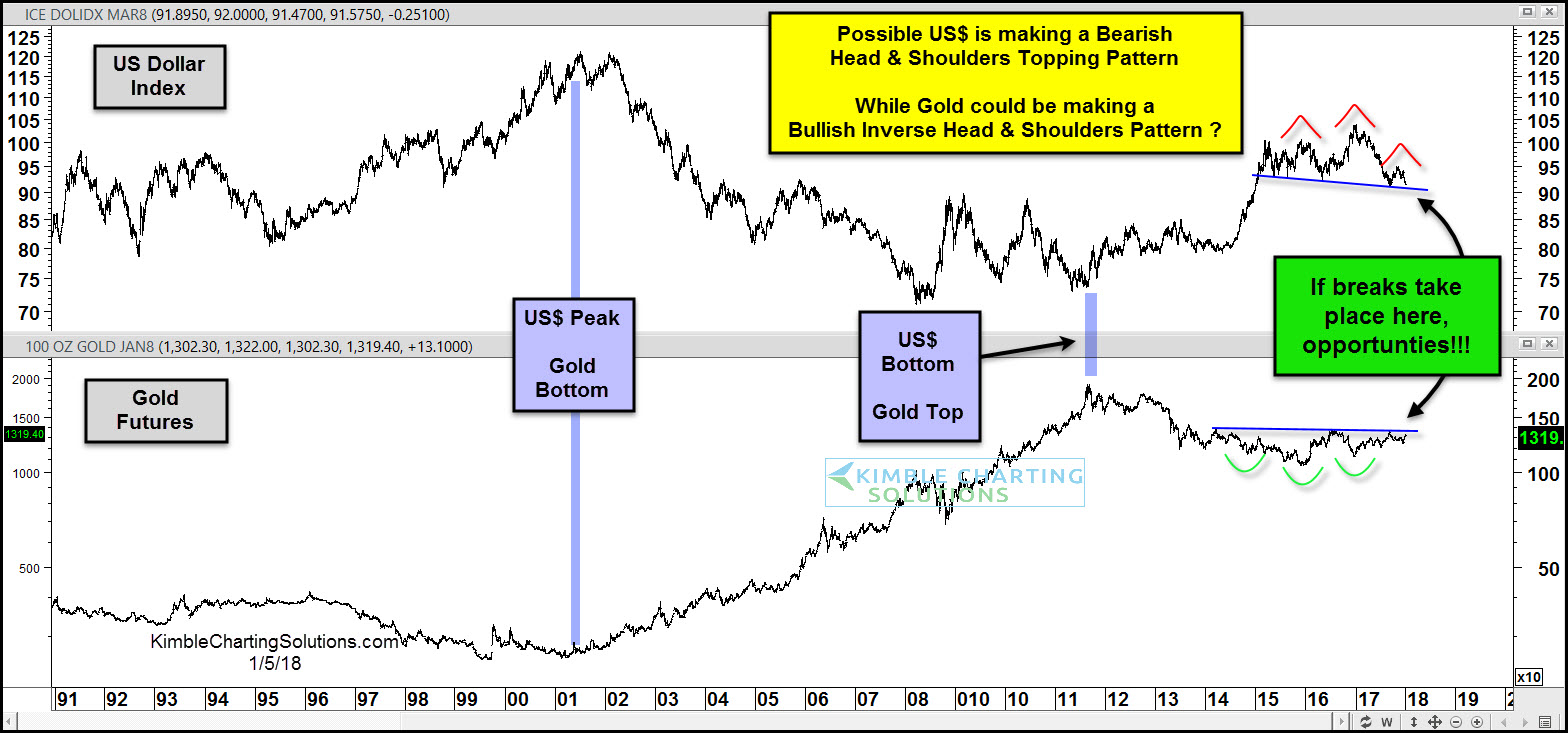
Below looks at chart of Gold and the US Dollar over the past 27-years-
CLICK ON CHART TO ENLARGE
This chart reflects the "potential" that the US Dollar could be creating a bearish head & shoulders topping pattern, while Gold could be creating bullish inverse head & shoulders bottoming pattern.
Joe Friday Just The Facts- The odds might be low that this read is correct. The impact would be BIG for metals (Gold, Silver and Miners) if it is!!!
If you would like to stay atop the important patterns in the Gold, Silver, Copper, Miners and Steel sector, we would be honored if you were a Metals or Premium Member.