Commodities-Multi-decade breakout test in play
CLICK ON CHART TO ENLARGE
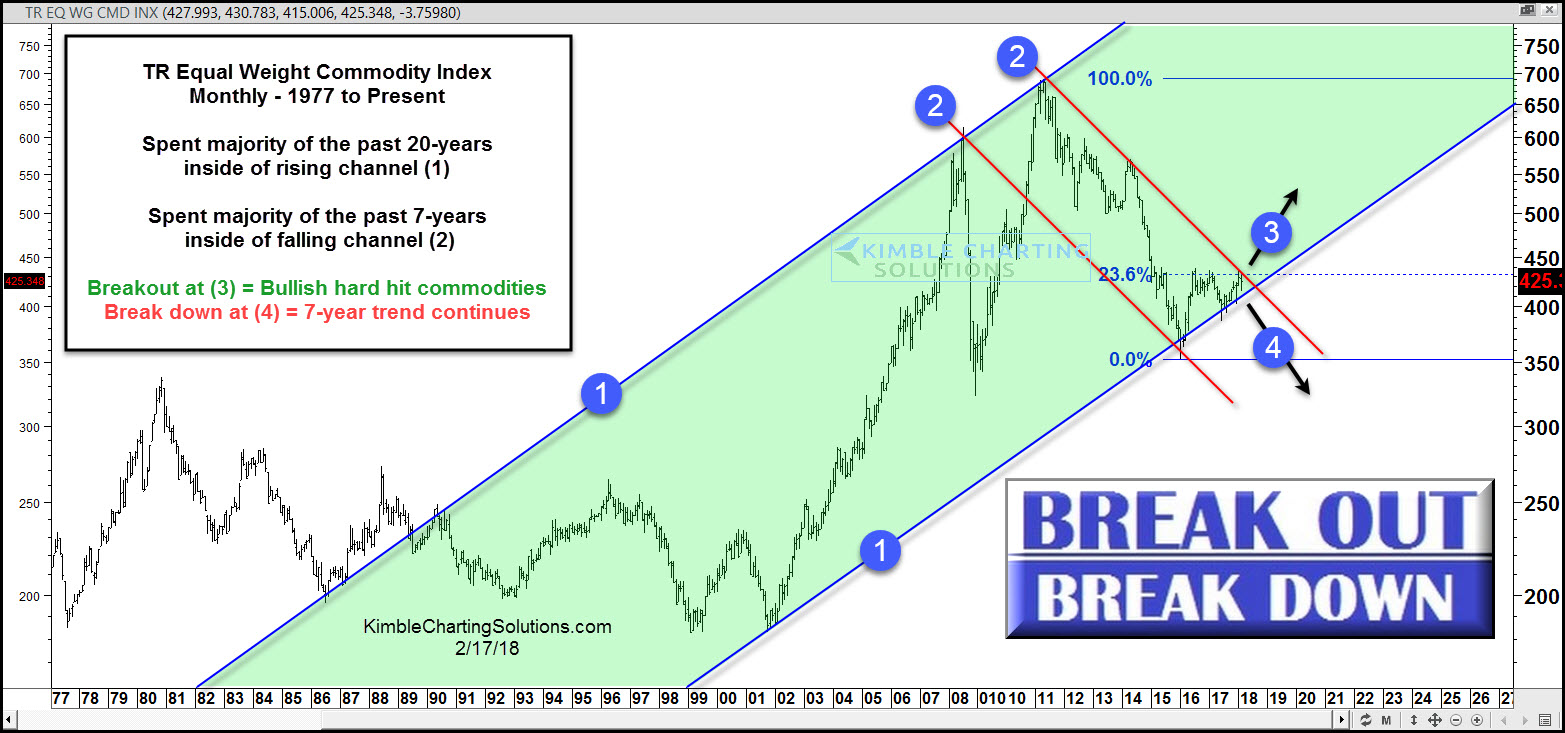
The chart above highlights that the Thomson Reuters Equal Weighted Commodity Index has spent the majority of the past 20-years inside of rising channel (1), reflecting that its long-term trend is up.
Over the past 7-years, this index has struggled big time after hitting the top of this channel in the spring of 2011, creating falling channel (2). Since topping in 2011, the index has lost nearly 50% of its value. The decline saw it hit the bottom of this multi-decade rising channel back in 2016 and since then it has created a series of higher lows.
The index now faces a key breakout/breakdown test right now, that could be important for commodities for years to come!
This Wednesday we will be conducting a private briefing for our blog viewers and this chart will be one of many that we will discuss. We will highlight its importance, the impact on other markets and how to play it. If you would like to attend our FREE webinar....CLICK HERE TO REGISTER
