Gold Vs. Stocks
Gold posted strong returns in the third quarter of 2019 amidst a general flight to havens.
This article looks at the long-term returns of the S&P 500 vs. gold.
Gold has produced lower total returns with higher variability. While it has had success in risk-off environments, it has proved to be an expensive hedge.
I have written over 700 articles on Seeking Alpha covering a wide variety of topics across the financial markets landscape, but have never authored about Gold (GLD). Gold is recently having one of its episodic moments. Amidst weakening global economic data, falling real yields on fixed income assets, and rising geopolitical tensions, there was a flight to haven assets in the third quarter of 2019. Treasuries, defensive stocks, the U.S. dollar, and gold were among the winners. On the quarter, the price of gold rose roughly 4.5% as global stocks posted negative to middling returns.
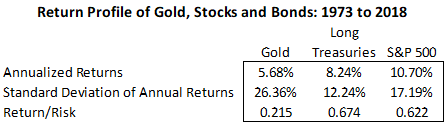
While the gold bugs rejoiced at the relative outperformance versus stocks, I want to take a moment to put the long-run performance of gold into context versus U.S. equities for Seeking Alpha readers. Using data back to 1974, I have tabled the performance of Gold, the S&P 500 (VOO), and a long duration U.S. Treasury index (TLT). I used 1974 because it is coincidentally during the Nixonian transition of the U.S. off the gold standard, and the first full available year of data for the now named Bloomberg Barclays Long U.S. Treasury Index.
As you can see below, Gold has produced the worst returns of the three series with the highest volatility over this long time series. The volatility of gold has been nearly two times that of stocks, which may come as a surprise to those who view it as a haven.
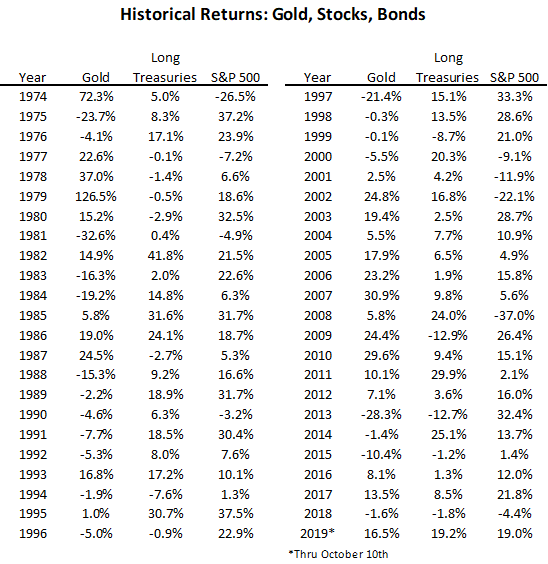
In spite of these flagging risk-adjusted returns, Gold has certainly had its moments. In the stagflationary environment of the mid-1970s, amidst the move to fiat currency globally, gold soared by 72% in 1974 as the S&P 500 sold off by 26%. During the collapse of the tech bubble, the S&P 500 shed 38% for the calendar years 2000-2002 while Gold rallied 21%. During the annus horribilis that was 2008, the S&P 500 lost 37% while Gold rallied roughly 6%.
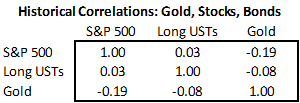
In the following table, I calculated the correlation of these three assets. Not surprisingly from the anecdotal tales of positive returns for gold in risk-off environments, it has a negative correlation with U.S. stocks (r=-0.19).
When two assets have low or negative correlation, combining them into a portfolio often produces less variable returns. With Gold underperforming stocks by roughly 5% per year over the past 45 years, we know that adding gold to an all-stock portfolio does not increase absolute returns. Does it enhance risk-adjusted returns though? To answer that question, I looked at a three asset portfolio - stocks, bonds, and gold, and solved for the weights that would produce the best absolute and risk-adjusted returns. Definitionally, the best absolute returns were in a 100% stock portfolio. The best-risk adjusted returns came from a 100% bond portfolio. Gold had a zero weight under both optimizations. There are years when owning gold is great, but there are too many long stretches when gold hampers portfolio performance. Gold ended 1980 at 590/ounce. It ended 2005, a quarter century later at $517/ounce.
The low realized return of gold does not come as a surprise to me. As a precious metal that acts as a store of wealth, but one that has not seen rising utility over time, the return to holding gold should probably be something akin to long-run inflation less a storage cost. Since 1974, the average rate for the Consumer Price Index published by the Bureau of Labor Statistics has been 4.0%. Maybe from that perspective gold has actually outperformed, potentially benefiting from a rise in financial market utility as the dollar detached from gold.
While gold has generated a modest real return, it has been crushed by the returns of stocks. A $100 investment in gold in 1974 would be worth $1102 today while $100 in the S&P 500 would have grown to $9583.
With the rising amount of negative yielding assets, it might pay to remember that gold is a zero yielding asset that investors have long paid to hold securely. I will not be adding gold as a financial asset even as others extol it as a virtuous "hedge". Over time, that hedge has been costly to portfolio performance.
Disclaimer: My articles may contain statements and projections that are forward-looking in nature, and therefore, inherently subject to numerous risks, uncertainties, and assumptions. While my articles focus on generating long-term risk-adjusted returns, investment decisions necessarily involve the risk of loss of principal. Individual investor circumstances vary significantly, and information gleaned from my articles should be applied to your own unique investment situation, objectives, risk tolerance, and investment horizon.
Disclosure: I am/we are long SPY. I wrote this article myself, and it expresses my own opinions. I am not receiving compensation for it (other than from Seeking Alpha). I have no business relationship with any company whose stock is mentioned in this article.
Follow Ploutos and get email alerts