Technical Scoop: Forecast Edition - Gold in 2020
TECHNICAL SCOOP Charts and commentary by David Chapman Chief Strategist, Enriched Investing Inc. Phone: 416-523-5454 Email: david@davidchapman.com dchapman@enrichedinvesting.com Twitter: @Davcha12 December 23, 2019 |
"Gold is money. Everything else is credit."
J.P. Morgan, American financier, banker, dominated corporate finance on Wall Street during the Gilded Age; 1837-1913
"Because gold is honest money it is disliked by dishonest men."
Ron Paul, American author, physician, politician; sought presidency of the U.S. as a Libertarian 1988, Republican 2008, 2012; b. 1935
"Gold will be slave or master."
Quintus Horatius Flaccus aka. Horace, Roman lyric poet; 65 BC-8 BC
Gold is money. Gold has been used as the currency of choice for almost three millenniums. The earliest known gold coins were seen in 560 BC after they were able to separate gold from silver. Both gold and silver circulated as the currency of choice before the introduction of paper money. With the end of Bretton Woods in August 1971, the world was taken off the gold standard and since then fiat currencies have been the currency of choice. Unlike gold, however, fiat currencies are not money as they are not backed by anything except a promise to pay in other words, credit.
Everything else is credit. Credit goes back even further to Sumer, 3500 BC. Loans were used for agricultural purposes. The Code of Hammurabi formalized in Babylon in 1800 BC established interest rates. During Roman times credit was documented on paper known as "nomina facit, negotium conficit," meaning "he uses credit to complete the purchase."
Today 92% of currency is digital and we live in a world of debt. Money is just flashes on a computer screen. But what if all the power went down? And what if someone were able to make all records disappear? Would the man who had gold now be king? Neither digital money nor, for that matter, fiat currencies (i.e., paper money) has intrinsic value.
Paper money is only worth what the government tells you it is worth. And that they have authorized it to be used as legal tender. Your credit card, on the other hand, is mere convenience as the card actually belongs to the company that issues it. The company keeps track of the flashes on the computer screen on your behalf. Otherwise, a credit card is not legal tender. And, given we are no longer on a gold standard, gold has intrinsic value but is not used as legal tender. Despite all this, central banks continue to hold gold as a part of their reserve assets. They hold gold to protect the purchasing power of their currencies, for liquidity purposes, for diversification purposes, and as a hedge against inflation. Central banks currently hold some 33,800 metric tonnes or roughly 20% of all the gold ever mined. Of that total, the U.S. has the largest gold reserves 8,133.5 metric tonnes.
We have always been struck how, since the end of the gold standard and the explosion of debt that has taken place, the price of gold has climbed with the debt. The chart below shows the price of gold vs. the U.S. debt limit and U.S. federal government debt. Since August 1971, the price of gold has increased by a factor of 42. U.S. federal government debt has increased by a factor of 58. By that measurement alone, gold should be trading at over $2,000. The Dow Jones Industrials (DJI) has only increased by a factor of 31 during that period. Gold, however, is viewed as the barbarous relic in some quarters.
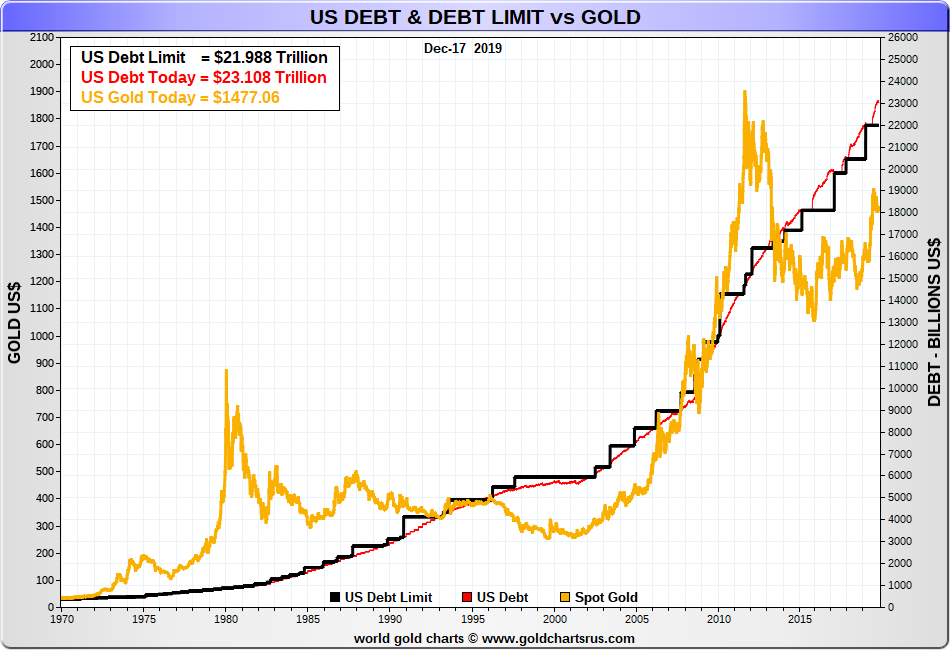
Source: www.goldchartsrus.com
In 2019, gold made new all-time highs in all major currencies except for the Swiss franc. All-time highs were seen in euros, Canadian dollars, Australian dollars, Japanese yen, pound sterling, and Swedish krona. Besides Swiss francs, gold did not see new all-time highs in 2019 for the Chinese yuan, Russian ruble, South African rand, Indian rupee, and U.S. dollar. In numerus other lesser currencies, gold made all-time highs in 2019.
That gold has performed so well in a host of currencies suggests that eventually gold in U.S. dollars could also see new all-time highs. The all-time high was seen in September 2011 at $1,923. Our chart below shows gold in Canadian dollars. Gold in Canadian dollars broke out in 2019 from a multi-year triangle consolidation pattern. The breakout implies that gold in Canadian dollars could hit a target of at least $2,400. The high so far has been $2,084.
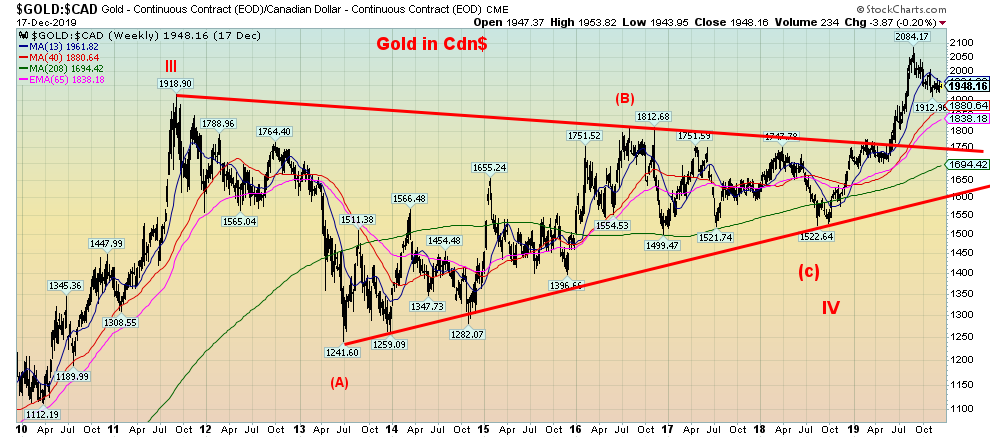
Source: www.stockcharts.com
Since the beginning of the new century, gold has been the best-performing asset. The return has been 410%. This, despite an underwhelming performance since 2011. The Dow Jones REIT Index (property) was the second-best performer returning 240%. Stocks, as represented here by the S&P 500 and the TSX Composite, returned 118% and 102% respectively despite strong performances over the past decade. Bringing up the rear was bonds, represented here by the U.S. 10-year Treasury note returning 33% (before interest payments) while the CRB Index representing commodities actually lost almost 10%.
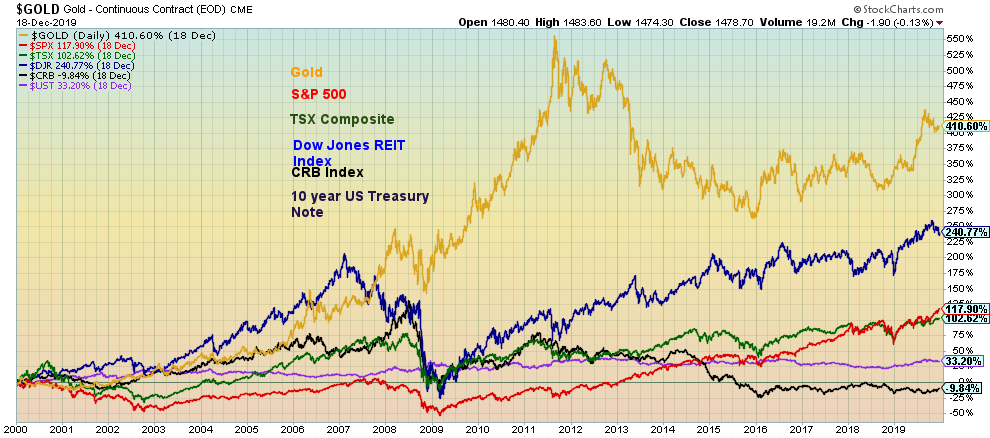
Source: www.stockcharts.com
Gold, despite its bad name in many quarters, is an important portfolio diversifier, given its negative correlation to stocks and bonds. Gold can act as a hedge during both inflationary and deflationary times and currency devaluations. Gold acts as a store of value. It is difficult to find and it takes years to complete a mine. Gold can act as potential cover during periods of geopolitical and macroeconomic uncertainty. If confidence were lost in governments, gold would most likely be the go-to asset.
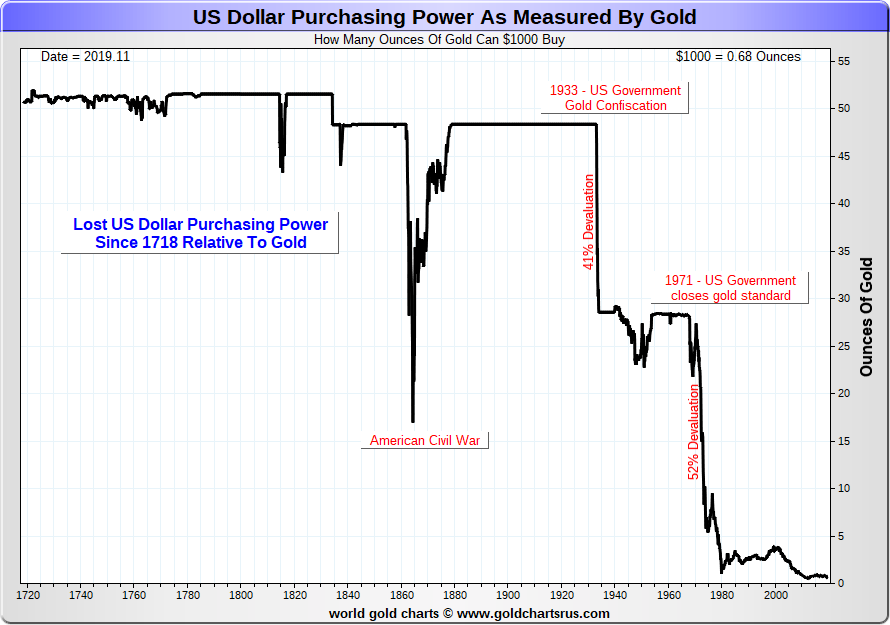
Source: www.goldchartsrus.com
The chart above shows how much the U.S. dollar has lost in terms of purchasing power relative to gold since 1718. The big drops occurred in 1933 when gold was revalued to $35/ounce from $20.67 effectively devaluing the U.S. dollar. The second big drop came when the U.S. closed down the gold standard, effectively ending Bretton Woods in August 1971. Since 1718 the purchasing power of $1,000 has fallen from over 50 ounces of gold to a mere 0.68 ounces today, a loss of 99%. Most of that loss has occurred since 1933.
Gold is a small market compared to other assets. All the gold ever mined is currently worth about $5.5 trillion vs. a market cap for global stock markets of about $75 trillion. The global bond market is worth about $115 trillion. Gold by comparison is a very small market.
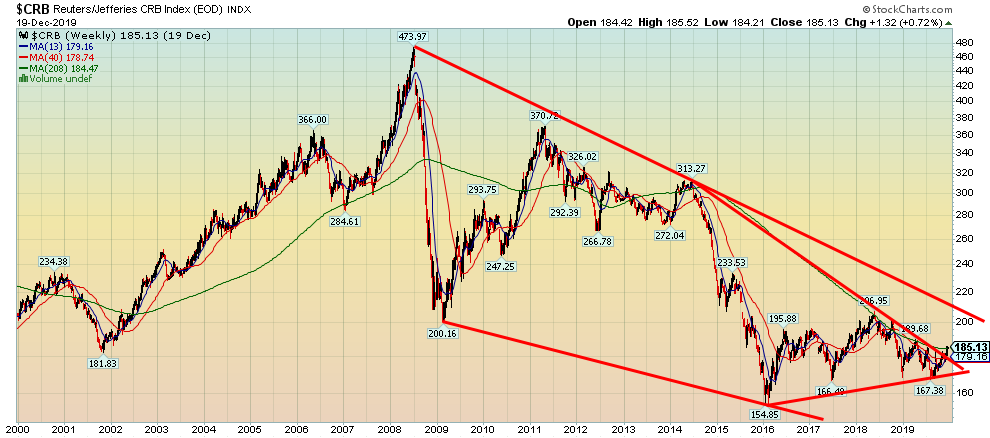
Could commodities be on the brink of a breakout? Commodities, as represented by the Reuters/Jefferies CRB Index, have been an atrocious performer since the turn of the century. Yes, there was a huge runup into 2008, generally peaking with oil prices. But since then commodities have been miserable and the CRB Index remains down some 60% from the 2008 high. There have been years of underinvestment, there has been an uptick in inflation although an annual rate of 2.1% is not high, and there is the potential for shortages of many commodities. A run to the downtrend line from the 2008 top would be a 13.5% gain from current levels. The CRB Index has been forming a slow rising series of higher lows since bottoming in early 2016. The CRB also appears to be forming a multi-decade wedge triangle. There is clearly considerable support for the CRB in the 150 to 200 zone. A rising CRB would be positive for gold. Note: The CRB Index comprises 19 commodities. 33% of the index is made up of petroleum-based products led by oil.
Source: www.stockcharts.com
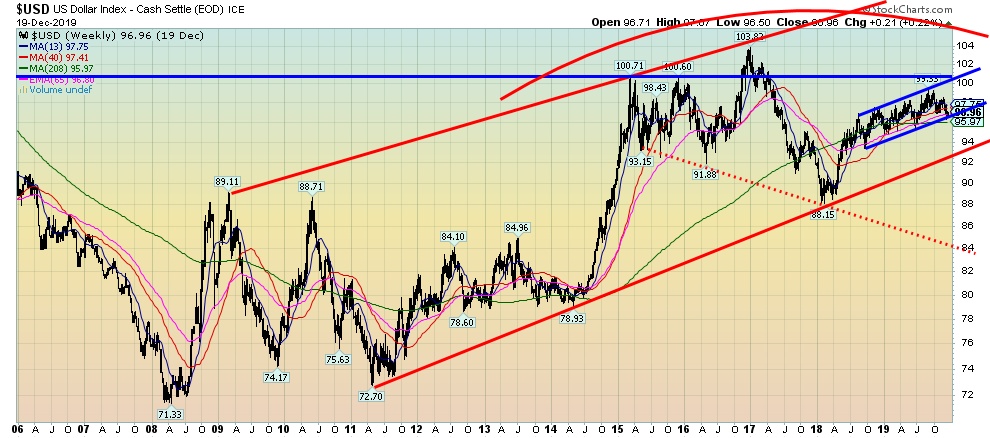
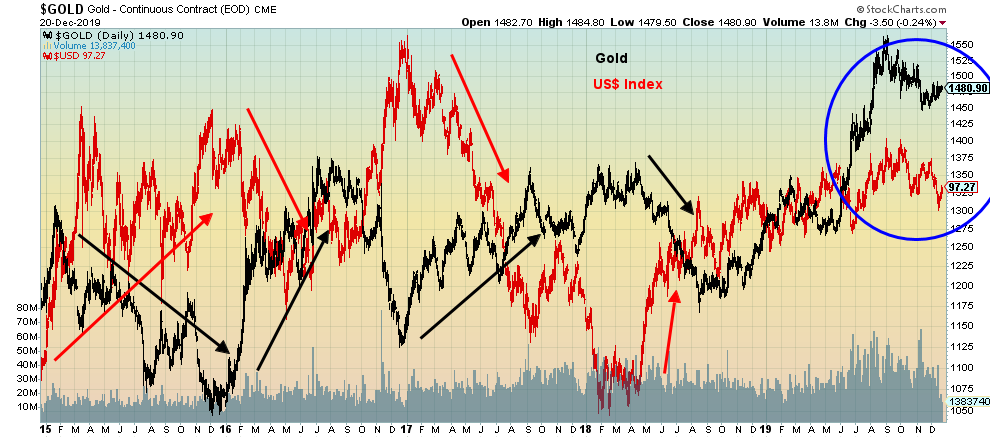
The key to gold going forward is the U.S. dollar. Gold and the U.S. dollar have had a long-term inverse relationship. Since the key low seen in 2011 for the US$ Index, the index embarked on a multi-year rise. That appears to have topped in 2017. Since last bottoming in early 2018 the US$ Index has been on a rise. That rise could be coming to an end. The index has currently found support in the 96.50 zone and is bouncing back.
However, if 96.50 should fail once again, the US$ Index could fall to major support near 93. The US$ Index has a rather interesting cycle of lows roughly every 16-17 years. Ray Merriman describes it as a 16.5-year cycle. The last major low was seen in 2011 and two previous important lows came in 1995 and 1978. The crest for the 1978 low came in 1985 while the crest from the 1995 low came in 2002. If, as we suspect, the US$ Index crested in January 2017 then we should be in the down cycle of the 16.5-year cycle with the next expected low due 2026-2028 centered on 2027. Key, of course, is that the US$ Index takes out the January 2018 low of 88.15 before it takes out the December 2016 high of 103.82.
Source: www.stockcharts.com
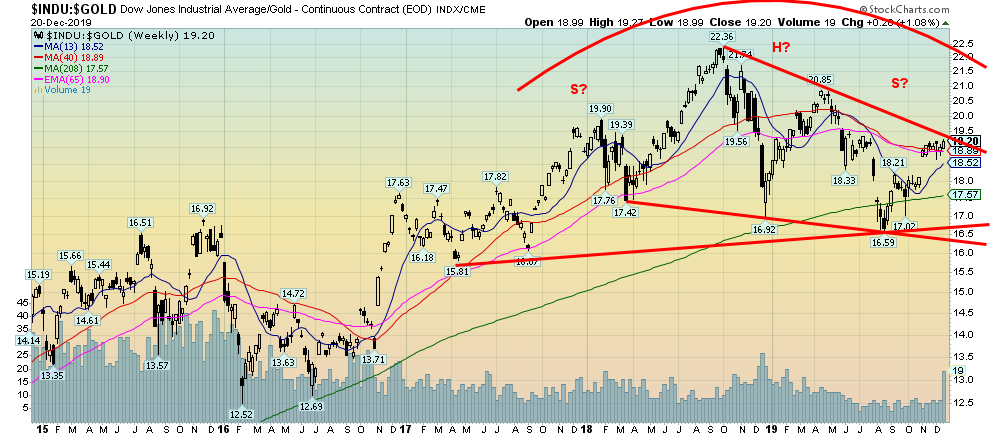
Another chart that could be a clue to gold's performance in 2020 is the Dow Jones Industrials (DJI)/Gold ratio. The DJI/Gold ratio last peaked in 1999 at 44.49. Gold outperformed for the next 11 years. The bottom came in August 2011 at 5.82. Since then the DJI has once again outperformed at least until September 2018 at 22.36, and since then the DJI/Gold ratio has started what appears to be a downtrend. Key now is that the DJI/Gold ratio holds below 19.40/19.50 and makes a new low below 16.59. The DJI/Gold could be forming a large head and shoulders top. It is an awkward one, however; we can point to a possible neckline at 16.70 that, if broken, could imply a decline to 10 to 10.50.
Source: www.stockcharts.com
The Fed is continuing its repo program. They have announced an additional $425 billion of new money for the period December 13, 2019 through January 14, 2020. There is also a special $50 billion program over year-end. They also noted they are prepared to buy short-term treasury notes if financing pressures required it. It is a matter of conjecture as to what this is for. Some believe it is a whole new round of money-printing or QE4, while others believe it is the Fed trying to keep a lid on interest rates.
Since starting this program, the US$ Index has fallen from a peak of 99.33 back on September 3, 2019 to its recent level of 96.96 a decline of 2.4%. It doesn't seem like much but it is significant. The repo program is helping to bring down the value the U.S. dollar, something Trump has been harping on with Powell for months now. It also highlights the fact that something is amiss in the markets a liquidity problem (clearly) or is there a large financial institution in trouble (Deutsche Bank?). We are well aware of problems in the European banking system and China's shadow banking system plus growing problems in emerging markets. The Fed's action in the repo market appears also be a sign that banks, who are normally the provider of funds in the repo market, are extremely reluctant to lend to one another. That is another signal that there is a problem.
It is interesting to note that the US$ Index topped on September 3, 2019, coinciding with the start of the Fed's repo program. The Fed's balance sheet has increased some $376 billion since then.
Source: www.stockcharts.com
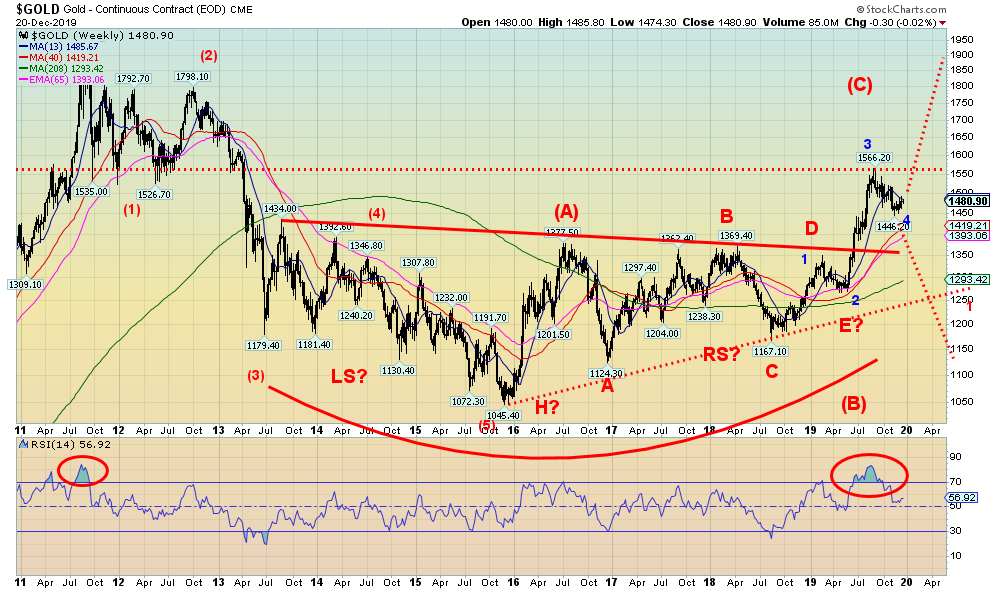
Our weekly chart of gold shows what we believe is a huge multi-year head and shoulders bottom pattern. The neckline formed in the $1,350 area following a peak of $1,434 in August 2013 and a low of $1,045 in December 2015. The breakout over $1,350 came in June 2019 and has a projection for gold to rise to at least $1,725/$1,750. The recent peak at $1,566 touched the bottom of the former support zone that formed in 2012 before the huge breakdown in 2013. The pullback, thus far, has held above the August 2013 high of $1,434. We could test lower before rising but, given gold is moving into a period of positive seasonals, we suspect that could be unlikely.
Gold is entering the fifth year of its current 7.83-year cycle. The 7.83-year cycle as defined by Ray Merriman of MMA Cycles last bottomed in December 2015. Previous lows commenced with the key low in September 1976. The next key low came in February 1985 (8.4 years), January 1993 (7.9 years), the double bottom in July 1999 and February 2001 (8.1 years), the low in October 2008 (7.7 years), and finally the low in December 2015 (7.2 years). The next major low is expected anywhere from 2022 to 2023, although if we were to base on a wide range it could be from late 2020 to early 2027. This low would also be the 23.5-year cycle low that last bottomed with the double bottom in August 1999 and February 2001 and was 23 and 25 years respectively from the 1976 low.
The 7.83-year cycle has some wondering whether the current cycle has topped with the high in August 2019 at $1,566. Naturally, it can't be ruled out until gold takes out that high before it breaks down and takes out $1,267 the last significant low seen in April 2019. The uptrend line from the 2015 low is currently near $1,250 so a breakdown under that level would be quite serious. Breaking under $1,350 would also be negative and be our first good clue that something was amiss.
Breaking back under $1,250 could also imply that the top in September 2011 at $1,923 was the crest of the current 23.5-year cycle. We believe there is one more wave up to complete the crest of this current cycle 7.83 year cycle, but until the September high of $1,566 is taken out the market has potential in either direction. Curiously, gold topped just as the Fed was getting its repo program underway. Gold's top came at the same time as the US$ Index topped on September 4, 2019. It is extremely rare for both the US$ Index and gold to move in the same direction as gold tends to move inversely to the U.S. dollar. Could something be amiss? We don't believe so and the U.S. dollar and gold moving in the same direction at once could be only temporary.
Source: www.stockcharts.com
Given a weakening U.S. dollar, a repo program that could be QE4, and the potential for the Fed to cut interest rates further leading into the 2020 election, it all suggests that we should have at least one more run to the upside before the down cycle into the 23.5-year cycle low gets underway.
Source: www.stockcharts.com
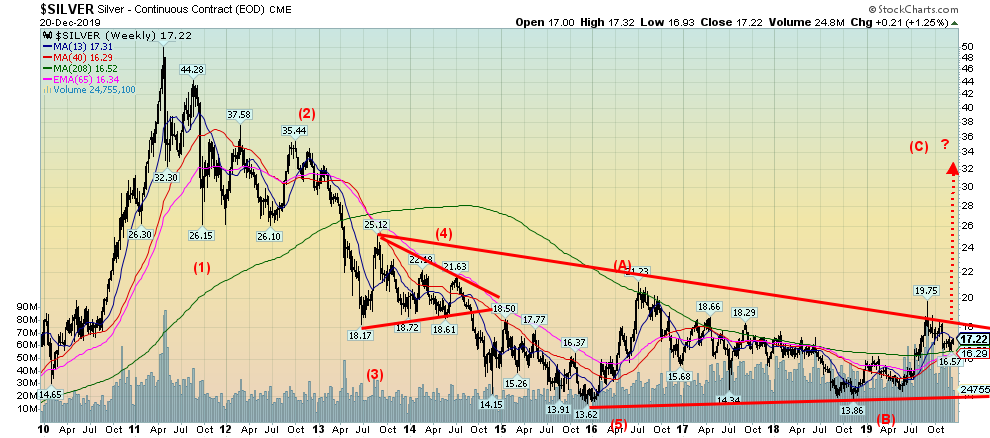
Could silver be on the cusp of breaking out to higher levels? Silver has underperformed gold. While gold took out the highs seen in 2016 and 2013 silver remains below both levels. In both bull and bear markets silver tends to outperform. Either the current underperformance of silver relative to gold suggests that silver could once again dominate in a bull market or one could also argue that its failure to lead is a bearish sign for both gold and silver. Silver has been languishing despite potential growing shortages. At $17.22 close Friday it was well below the 2013 high of $25.12 and the 2016 high of $21.23. The bottom of the current channel that joins the 2015 low with the 2018 low is just below $14. A breakout over $18.50 could be significant and suggest that silver is prepared to take a run at the 2013 and 2016 highs. We find it difficult to believe that the stunted rally from the 2018 low at $13.86 is it for the C wave up, a wave that has fallen well short of the A wave. We view silver as remaining bullish as long as it holds above $16.50. We know that is too close for comfort but a break under that level could suggest another test of the lower channel.
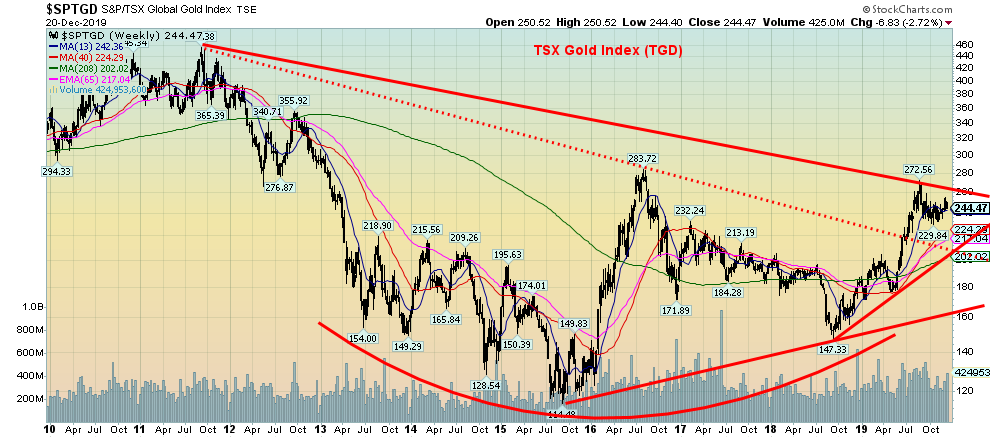
One encouraging area has been the recent performance of the gold stocks. While initially after gold topped in early September, the gold stocks underperformed; however, since mid-October the gold stocks have been outperforming gold, a positive sign given their propensity to either rise or fall faster than the metal. However, in looking back, we discover that the recent bull-run for the gold stocks has not seen them make new highs over the 2016 high. The TSX Gold Index (TGD) has been a stellar performer in 2019, gaining almost 31% (the Gold Bugs Index (HUI) is up almost 37% in 2019). Yet the TGD at 244 remains below its 2016 high of 284. The high so far has been 272. A breakout over 260 could see the TGD rise to potential targets up to 315.
As we move into 2020, the wide expectation is that gold should perform well. Numerous analysts including Goldman Sachs are calling for gold to rise in 2020. Goldman's forecast is for a rise to $1,600. Goldman cites gold's appeal as a hedge against financial turmoil, including more problems on the trade front and the potential for debt collapse. Central banks continue to be strong buyers of gold, having added some 550 metric tonnes to the end of Q3. Major buyers have been the central banks of Russia, China, and Turkey. Purchases in 2019 were higher by 12% over 2018. Central bank buying is expected to continue into 2020. Some have cited the heavy buying by central banks as the sign of a potential top for gold.
Source: www.stockcharts.com
Given positive seasonals as we move into 2020, we should see a rise in the gold price in Q1 2020. As noted, potential targets are up to $1,725 with some predicting even higher prices although not necessarily in 2020. Key, of course, is that first gold takes out $1,500/$1,525 and then takes out the September high of $1,566. A falling U.S. dollar could be key to gold's rise. After that we are not as sure, given that the weakness of the next 7.83-year cycle and the stronger pull of the 23.5-year cycle could kick in. Either way, 2020 could be an interesting year for gold, silver, and the gold stocks.
We are closing with a chart of the 10-year gold cycle. Given a shorter record of free trading, gold trends have not fully emerged. Years ending in zero have been mixed with two up years and three down years. Presidential election years are also mixed. The first six were all down, but the last four have all been up. Gold's return in 2019 has been the best of the decade (barring a collapse in the last two weeks). To say that it is has been a very difficult decade is an understatement. Given everything going on with the potential for a major financial crisis, gold, coupled with growing non-confidence in governments, should allow gold to perform well in 2020 as the current cycles crest. The first strong clue for a good year will be new highs over $1,566. Here's to a golden year.
Ten-Year Gold Cycle
Annual % Change in Gold
Year of Decade
decades | 1st | 2nd | 3rd | 4th | 5th | 6th | 7th | 8th | 9th | 10th |
1961-70 |
|
|
|
|
|
| -0.5 | 10.7 | 6.2 | -8.9 |
1971-80 | 16.5 | 48.9 | 75.6 | 60.6 | -23.3 | -3.8 | 23.4 | 36.5 | 134.8 | 10.9 |
1981-90 | -32.5 | 12.7 | -14.4 | -20.0 | 6.9 | 23.1 | 20.1 | -15.7 | -1.8 | -1.6 |
1991-00 | -10.6 | -5.9 | 17.6 | -1.9 | 1.0 | -4.9 | -21.5 | -0.2 | 0.1 | -6.0 |
2001-10 | 2.6 | 24.8 | flat | 25.6 | 18.2 | 22.8 | 31.4 | 5.8 | 23.9 | 29.8 |
2011-20 | 10.2 | 7.0 | -28.2 | -1.5 | -10.4 | 8.6 | 13.7 | -2.1 | 15.6* |
|
| 3 up 2 dn | 4 up 1 dn | 2 up 2 dn | 2 up 3 dn | 3 up 2 dn | 3 up 2 dn | 4 up 2 dn | 3 up 3 dn | 5 up 1 dn | 2 up 3 dn |
Note: * Year to date Source: David Chapman
(Note: Weekly Markets and Trends are on the next page)
Copyright David Chapman, 2019
About MARKETS AND TRENDS
|
|
| % Gains (Losses) Trends
| |||||
| Close Dec 31/18 | Close Dec 20/19 | Week | YTD | Daily (Short Term) | Weekly (Intermediate) | Monthly (Long Term) |
|
Stock Market Indices |
|
|
|
|
|
|
|
|
S&P 500 | 2,506.85 | 3,221.22 (new highs) | 1.7% | 28.5% | up | up | up (topping) |
|
Dow Jones Industrials | 23,327.46 | 28,455.09 (new highs) | 1.1% | 22.0%
| up | up | up (topping) |
|
Dow Jones Transports | 9,170.40 | 10,900.73 | 1.2% | 18.9% | up | up | up (weak, topping) |
|
NASDAQ | 6,635.28 | 8,924.26 (new highs) | 2.2% | 34.5% | up | up | up (topping) |
|
S&P/TSX Composite | 14,322.86 | 17,118.44 (new highs) | 0.7% | 19.5% | up | up | up (topping) |
|
S&P/TSX Venture (CDNX) | 557.20 | 548.84 | 1.5% | (1.5)% | up | down | down |
|
S&P 600 | 844.94 | 1,022.88 (new highs) | 0.8% | 21.1% | up | up | up (topping) |
|
MSCI World Index | 1,710.88 | 2,025.74 (new highs) | 0.6% | 18.3% | up | up | up |
|
NYSE Bitcoin Index | 3,769.99 | 7,175.18 | (0.7)% | 90.3% | down | neutral | up (weak) |
|
|
|
|
|
|
|
|
|
|
Gold Mining Stock Indices |
|
|
|
|
|
|
|
|
Gold Bugs Index (HUI) | 160.58 | 219.47 | (2.8)% | 36.7% | up | up | up |
|
TSX Gold Index (TGD) | 186.74 | 244.47 | (2.7)% | 30.9% | up | up | up |
|
|
|
|
|
|
|
|
|
|
Fixed Income Yields/Spreads |
|
|
|
|
|
|
|
|
U.S. 10-Year Treasury yield | 2.69 | 1.92 | 5.5% | (28.6)% |
|
|
|
|
Cdn. 10-Year Bond yield | 1.96 | 1.62 | 2.5% | (17.4)% |
|
|
|
|
Recession Watch Spreads |
|
|
|
|
|
|
|
|
U.S. 2-year 10-year Treasury spread | 0.21 | 0.30 | 42.9% | 42.9% |
|
|
|
|
Cdn 2-year 10-year CGB spread | 0.10 | -0.04 | 50.0% | (140.0)% |
|
|
|
|
|
|
|
|
|
|
|
|
|
Currencies |
|
|
|
|
|
|
|
|
US$ Index | 95.73 | 97.27 | 0.5% | 1.6% | down | down (weak) | up (weak) |
|
Canadian $ | 0.7350 | 0.7610 | 0.3% | 3.5% | up | up | down (weak) |
|
Euro | 114.58 | 110.75 | (0.4)% | (3.3)% | neutral | down (weak) | down (weak) |
|
Swiss Franc | 101.88 | 101.87 | 0.3% | flat | up | up | neutral |
|
British Pound | 127.50 | 129.90 | (2.6)% | 1.9% | neutral | up | up (weak) |
|
Japanese Yen | 91.24 | 91.35 | (0.1)% | 0.1% | down | down (weak) | up (weak) |
|
|
|
|
|
|
|
|
|
|
Precious Metals |
|
|
|
|
|
|
|
|
Gold | 1,281.30 | 1,480.90 | flat | 15.6% | neutral | up (weak) | up |
|
Silver | 15.54 | 17.15 | 0.8% | 10.4% | neutral | up (weak) | up (weak) |
|
Platinum | 795.90 | 935.50 | 0.7% | 17.5% | up (weak) | up | neutral |
|
|
|
|
|
|
|
|
|
|
Base Metals |
|
|
|
|
|
|
|
|
Palladium | 1,197.20 | 1,808.90 (new highs) | (4.4)% | 51.1% | up | up | up |
|
Copper | 2.63 | 2.806 | 0.9% | 6.7^ | up | up | neutral |
|
|
|
|
|
|
|
|
|
|
Energy |
|
|
|
|
|
|
|
|
WTI Oil | 45.41 | 61.18 | 1.9% | 34.7% | up | up | up (weak) |
|
Natural Gas | 2.94 | 2.33 | 1.3% | (20.8)% | down | down | down |
|
Source: www.stockcharts.com, David Chapman
Note: For an explanation of the trends, see the glossary at the end of this article.
New highs/lows refer to new 52-week highs/lows.
Copyright David Chapman, 2019
David Chapman is not a registered advisory service and is not an exempt market dealer (EMD). We do not and cannot give individualised market advice. The information in this newsletter is intended only for informational and educational purposes. It should not be considered a solicitation of an offer or sale of any security. The reader assumes all risk when trading in securities and David Chapman advises consulting a licensed professional financial advisor before proceeding with any trade or idea presented in this newsletter. We share our ideas and opinions for informational and educational purposes only and expect the reader to perform due diligence before considering a position in any security. That includes consulting with your own licensed professional financial advisor.
GLOSSARY
Trends
Daily - Short-term trend (For swing traders)
Weekly - Intermediate-term trend (For long-term trend followers)
Monthly - Long-term secular trend (For long-term trend followers)
Up - The trend is up.
Down - The trend is down
Neutral - Indicators are mostly neutral. A trend change might be in the offing.
Weak - The trend is still up or down but it is weakening. It is also a sign that the trend might change.
Topping - Indicators are suggesting that while the trend remains up there are considerable signs that suggest that the market is topping.
Bottoming - Indicators are suggesting that while the trend is down there are considerable signs that suggest that the market is bottoming.