Silver Is Preparing To Surprise
Silver is a stubborn metal.
A $16-17 range.
Watch out above.
Gold will lead, and silver will take the baton.
A bubbling bullish volcano.
The price of silver has gone to sleep, and the precious metal is like a hibernating polar bear in summer these days. However, anyone who has bought or sold silver since the late 1970s knows that when the metal awakens, it can be a bucking bronco like no other.
Silver has a long history of surprising, or even shocking market participants when it comes to price volatility. The price of silver can rally far beyond that fundamental and technical analysis projects, and it can fall far below what seems reasonable, rational, and logical at times.
Silver is like a rubber band; during its quiet times, it stretches the patience of market participants to the point where many throw in the towel, abandon positions and look to other markets for opportunities. However, silver tends to move significantly higher or lower when herds of buyers or sellers flock to the market causing impressive moves on a percentage basis on both the up and downside.
While gold has been threatening to challenge its 2016 high at $1377.50 per ounce and was trading at just $30 below that level on Monday, April 16, silver was miles below its peak from two years ago. In July 2016, silver traded to a high of just over $21 per ounce and these days, it is almost $4.50 lower. Moreover, silver has traded at a median level of 55:1 versus gold over the past four decades. With the yellow metal at the $1346 level, that would imply a price of just under $24.50 per ounce, and silver is almost $8 per ounce lower than that price these days.
Silver is a stubborn metal
Silver can be a stubborn precious metal, and it is not unusual for it to remain in a narrow trading range for long periods. 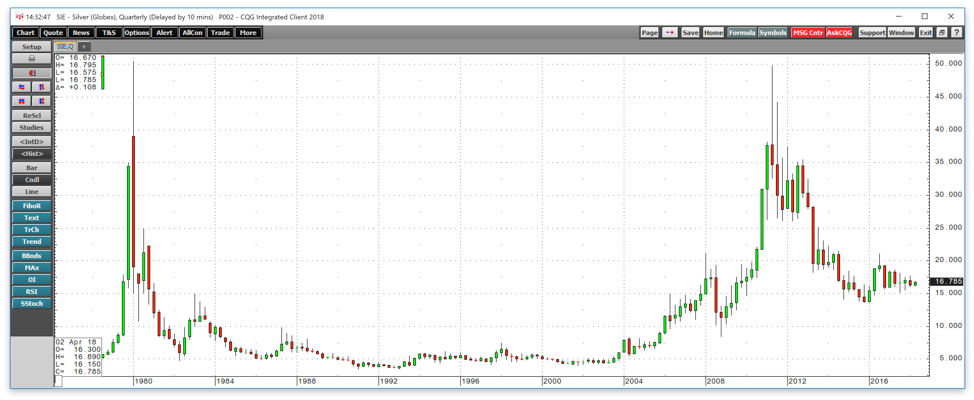
Source: CQG
As the quarterly chart highlights, from 1990-2000, silver traded in a range from a low of $3.505 to a high at $7.40 per ounce. The 90s were a decade of hibernation for the precious metal. Industrial demand from the photographic industry declined dramatically as digital photography replaced the need for silver nitrate during the decade. However, the growth of the computer industry replaced one demand vertical with another.
On a technical basis, silver broke out to the upside in 2006, when the price moved above the 1983 peak at $14.93 per ounce on the nearby COMEX futures contract. In the years that followed, silver rallied dramatically reaching a high of $49.82 per ounce in April 2011, a few months before gold hit its record level in September of that year at $1920.70 per ounce. Silver sent a signal to gold when it almost made it to the $50 level, and gold followed in its footsteps.
The most recent high in the silver futures market came in July 2016 following the shock of the Brexit referendum. Silver made it to $21.095 per ounce, but since then the market has gone back into hibernation. The price of silver has not traded below the $10 per ounce level since late 2008, and since the 2016 high, the bottom in the precious metal has been at $13.6350.
A $16-17 range
In early 2018, the price of silver made it up to a high of $17.785 on the active month May futures contract on January 25. The continuous contract peak was at $17.705. 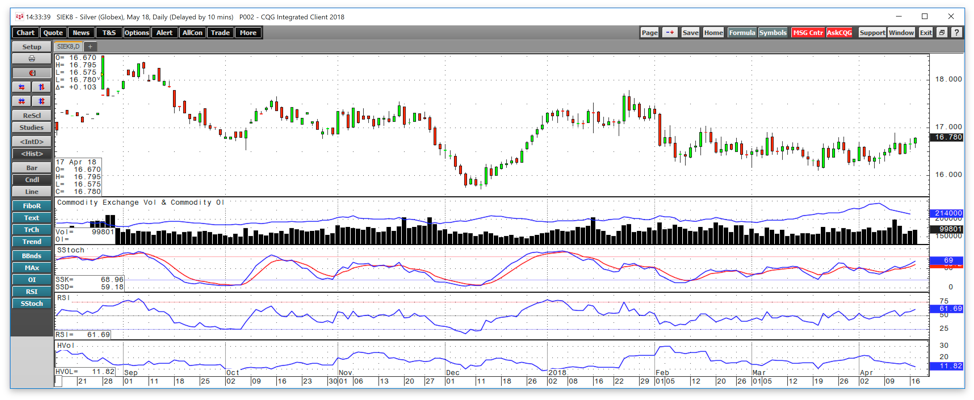
Source: CQG
As the daily chart of May futures shows, since the first week of February, silver has been in a trading range between $16 and $17. Critical support is at the March 20 low at $16.10 with resistance at the February 15 peak at $17.025 per ounce.
Open interest, the total number of open long and short positions in the COMEX futures market moved to a high of 243,411 contracts on April 6, which was a record high indicating a pickup in interest in the silver market by investors and traders. The metric has declined to the 214,000-contract level over recent sessions, perhaps because the roll from May to July futures is beginning and shorts are heading for exits. As I have been writing, it is likely that the interest in Bitcoin and other digital currency instruments has diverted attention from the silver market since 2017. After all, the price volatility and bull market in the cryptocurrencies offered trend-following traders and speculators all the excitement they desired without turning to silver.
However, the prices of the cryptos returned to earth over the first months of 2018, and some interest has returned to the silver market. Technical metrics are in neutral territory in the silver market these days as the price remains in its trading range. Silver was at the $16.785 per ounce level on Tuesday, April 17.
Watch out above
Silver has been in consolidation mode since early February. 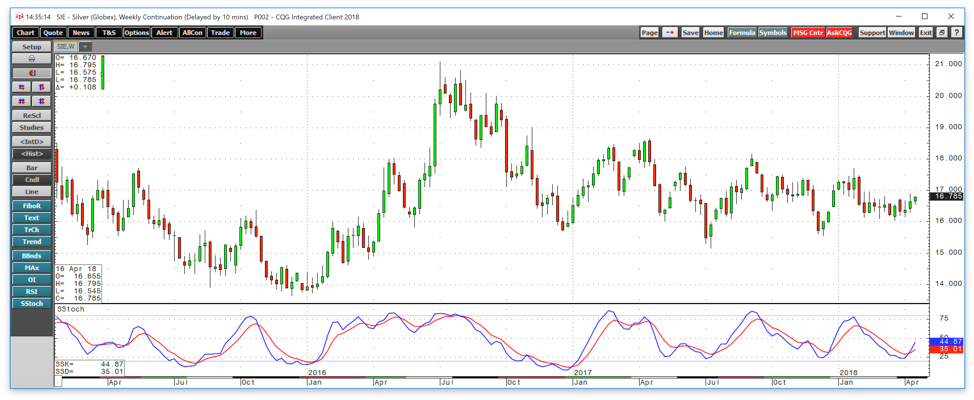
Source: CQG
As the weekly chart illustrates, since July 2017 when a flash crash during illiquid trading hours in Asia took the price to lows of $15.15 per ounce briefly, the price of silver has been making higher lows. At the same time, the precious metal has been making lower highs since the July 2016 peak at just over the $21 per ounce level. The slow stochastic, a momentum indicator, crossed to the upside in oversold territory in early April indicating that silver could be preparing to challenge the upper end of its trading range at the $17 per ounce level. To break the pattern of lower highs, silver will need to move above $17.705 the early 2018 peak, and above $18.16 per ounce, the high from September 2017. Any move above these levels could light a bullish fuse under the precious metal which could become explosive.
Gold will lead, and silver will take the baton
Perhaps the most bullish factor for silver these days is the action in the gold futures market. 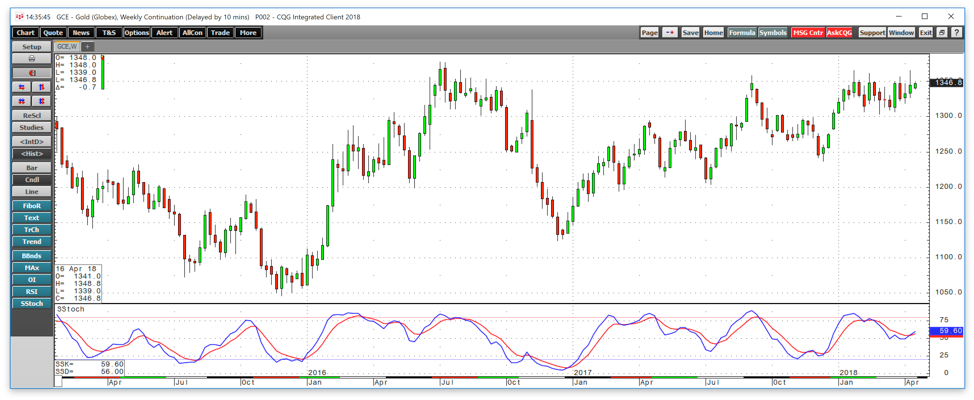
Source: CQG
As the weekly chart of the yellow metal shows, gold has been making higher lows since late 2015, and it reached its high, like silver, in the aftermath of the Brexit referendum during the summer of 2016. While silver climbed to over $21 per ounce, gold's peak was at $1377.50. However, unlike silver which is trading at over $4.31 below that peak, gold has been sitting comfortably at around $30 below its high. Gold has been in a trading range in 2018, but the band is much closer to the 2016 high than it is in the silver market.
We may need to see gold take the leadership role and break above $1377.50 before silver gets a bullish jolt and awakens from its nonvolatile slumber. If gold makes it to the $1400 per ounce level, I would not be surprised to see it hand a flaming bullish baton to the silver market which is becoming long overdue for a significant move to play catchup with the yellow metal.
A bubbling bullish volcano
Hibernation is a time to rest and rebuild strength for the future, and the silver market could be lulling market participants into a sleepy sense that the price will continue to languish and trade at a level that lags gold.
However, anyone who has experience trading silver over past decades knows that the metal that tends to move the most on a percentage basis often explodes or implodes when the market least expects.
As I look at the silver market these days, I see a potential volcano of bullish price action if gold can make its way over the $1380 level. It has been a long time since we have seen silver move $1 or higher during a trading session, and we may not have to wait much longer.
These days, I continue to favor the triple leveraged silver ETN product, USLV. 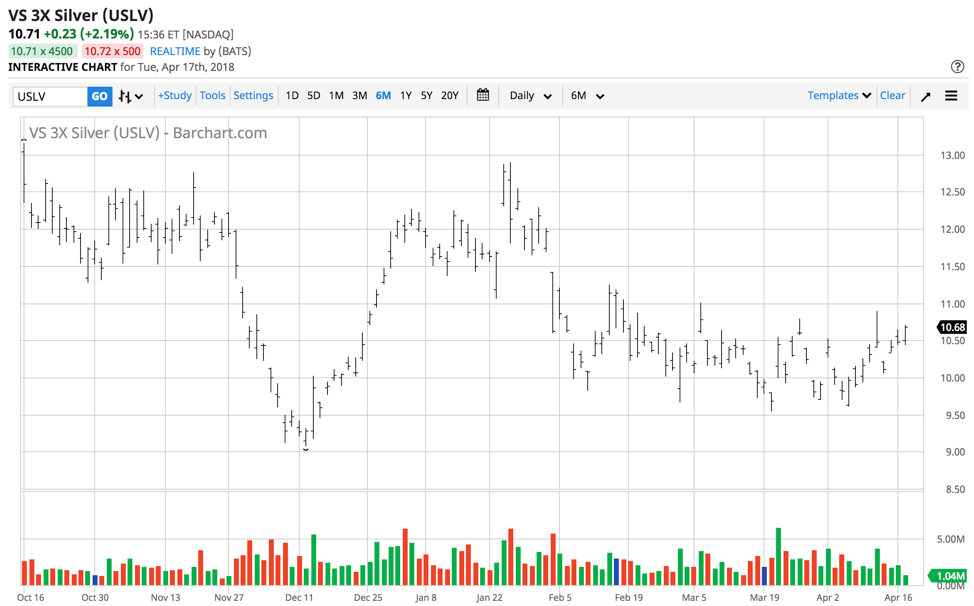
Source: Barchart
USLV has net assets of over $265 million and trades over 2.7 million shares each day making it a liquid trading vehicle. On Tuesday, April 17, USLV was trading at the $10.71 level and a significant move to the upside in silver over the coming days or weeks could launch this ETN product into the stratosphere given its gearing.
The price of silver remains in hibernation and within its $16-17 trading range, but there are signs that the market with a penchant for wide price variance is preparing to surprise on the upside.
The Hecht Commodity Report is one of the most comprehensive commodities reports available today from the #2 ranked author in both commodities and precious metals. My weekly report covers the market movements of 20 different commodities and provides bullish, bearish and neutral calls; directional trading recommendations, and actionable ideas for traders. More than 120 subscribers are deriving real value from the Hecht Commodity Report.
Disclosure: I/we have no positions in any stocks mentioned, and no plans to initiate any positions within the next 72 hours.
I wrote this article myself, and it expresses my own opinions. I am not receiving compensation for it (other than from Seeking Alpha). I have no business relationship with any company whose stock is mentioned in this article.
Additional disclosure: The author always has positions in commodities markets in futures, options, ETF/ETN products, and commodity equities. These long and short positions tend to change on an intraday basis.
Follow Andrew Hecht and get email alerts